Operations Bridge Manager
For Windows® and Linux operating systems
Software Version: 2018.11
Customized output from:
Operations Bridge Manager 2018.11 Integrations Guide
|
Document Release Date: November 2018 Software Release Date: November 2018 |
|
Legal Notices
Warranty
The only warranties for products and services of Micro Focus and its affiliates and licensors (“Micro Focus”) are set forth in the express warranty statements accompanying such products and services. Nothing herein should be construed as constituting an additional warranty. Micro Focus shall not be liable for technical or editorial errors or omissions contained herein. The information contained herein is subject to change without notice.
Restricted Rights Legend
Confidential computer software. Except as specifically indicated otherwise, a valid license from Micro Focus is required for possession, use or copying. Consistent with FAR 12.211 and 12.212, Commercial Computer Software, Computer Software Documentation, and Technical Data for Commercial Items are licensed to the U.S. Government under vendor's standard commercial license.
Copyright Notice
© Copyright 2015 - 2018 Micro Focus or one of its affiliates
Trademark Notices
Java is a registered trademark of Oracle and/or its affiliates.
Linux® is the registered trademark of Linus Torvalds in the U.S. and other countries.
Microsoft®, Windows®, Lync®, Windows NT®, Windows® XP, and Windows Vista® are either registered trademarks or trademarks of Microsoft Corporation in the United States and/or other countries.
Oracle is a registered trademark of Oracle Corporation and/or its affiliates.
UNIX® is a registered trademark of The Open Group.
This product includes an interface of the 'zlib' general purpose compression library, which is Copyright © 1995-2002 Jean-loup Gailly and Mark Adler.


About this guide
Integrating OBM with other software products is a great way to extend your IT management capability. This document describes some of the major integrations between OBM and other Micro Focus products, but does not consitute a full list of possible integrations. For a complete list of available product integrations, see the Integrations Catalog.
Integrations between multiple OBM deployments enable the exchange of events by using event synchronization and topology synchronization.
For more information on working with multiple OBM deployments, see the OBM Administration Guide.
OBM integrates with Universal CMDB to enable sharing topologies (CIs and relationships) between instances and enabling a consistent CI ID in an environment. The integration uses the Configuration Management System (CMS) topology. A single instance is configured to be the CMS and the global ID generator; synchronization is achieved by using the topology synchronization.
For details on setting up these integrations, see Integrating Multiple CMDBs in the Data Flow Management Guide. Additionally, review the OBM RTSM Best Practices.
Unless integrating OBM and SiS (where a mixed TLS setup is supported), ensure that the software products that you are integrating use the same TLS setup. For example, it is not supported to use HTTP for OO and at the same time HTTPS for OBM, or vice versa.
Choose the integration
Choose the product with which you want to integrate your OBM instance.
Choose your OBM deployment type
Choose if you are running OBM in an Operations Bridge container deployment or a classic deployment.
Choose your OM type
Choose if you are integrating with OM for Windows or OM for UNIX or Linux.
Choose if you use the OBM RTSM or an external UCMDB as Global ID generator
Choose if you use the OBM RTSM or an external UCMDB as Global ID generator.
Choose your APM or BSM version
Choose the version of your APM or BSM system.
Choose your OBA version
Choose the version of your OBA system.
Choose your OO version
Choose the version of your OO system.
Choose the OBA integration type
Choose the type of OBA integration you want to configure with OBM.
-
Cross Launch Integration: You can configure an integration that enables you to open OBA directly from OBM in the context of a specific event or host.
-
OBA alerts > OBM events: You can enable forwarding of OBA alerts to OBM, so that they are managed as OBM events.
-
OBA anomalies > OBM anomaly events: You can enable forwarding of OBA anomalies to OBM, so that they are managed as OBM anomaly events.
-
OBM Dashboard Integration: It is possible to configure a dashboard that displays the OBA user interface within OBM.
-
Log streaming: You can configure policies in OBM to collect data and forward it to OBA. This enables central configuration of log collection and normalization of the incoming data. To do so, configure a structured log file policy to collect data and a data forwarding policy to forward the data to OBM. For more information, see the OBA Online Help.
-
OBM event collection. You can connect your OBM instance as an OBM Event Collection source type in OBA so that the OBM event data is sent to OBA for further analysis. The OBM Event Collection collects events every 15 minutes. For more information, see the OBA Online Help.
Choose the OBR integration type for Reports
Choose the type of OBR integration you want to configure with OBM.
-
Event, HI and KPI Integration: OBR integrates with and collects OBM event data from the OBM database at regular intervals. The user and user group details are gathered from the Management database. The OBM Content Pack identifies the list of metrics that OBR must collect from each of these data sources. The corresponding topology and CI dimension data is collected from RTSM. OBR integrates with and collects Health and Key Performance Indicator metrics from OBM Service Health application; the metrics being stored in OBM Profile and Management databases.
- OBM-Management Packs Integration: OBR integrates and collects historical and ongoing database performance metrics from the OBM Management Packs for Enterprise reports.
-
OBM Integrated with APM: In this configuration, the OBM system provides topology data for all nodes and fact data for Operations Events and KPI. The APM system provides fact data from RUM and BPM that are directly monitored by APM.
Choose the SiS integration type
Choose the type of SiteScope integration you want to configure with OBM.
-
Event integration: SiteScope can forward events to OBM.
-
Topology integration: SiteScope can forward topology information to OBM.
-
Drilldown integration: When SiteScope monitors are used to set the status of a configuration item (CI), you can drill down from the CI in OBM to a SiteScope monitor that contributes to the HI's status.
-
Configuring and deploying SiteScope monitors from OBM: OBM provides a script that enables you to import templates from a SiteScope server so that you can include them in aspects, thus allowing you to manage the configuration and deployment of SiteScope monitors from within OBM.
Choose the SM integration type
Choose the type of SiteScope integration you want to configure with OBM.
-
Incident forwarding between SM and OBM: OBM enables you to forward events from OBM to SM. Forwarded events and subsequent event changes are synchronized back from SM to OBM. You can also drill down from OBM events to SM incidents or from SM incidents to OBM events.
-
Downtime forwarding from SM to OBM: You can create downtimes (also known as outages) in OBM based on Requests for Changes in SM.
-
Downtime notification from OBM to SM: OBM can send downtime start and end events to SM to notify operators when a downtime occurs. This provides additional information to the SM operator in case of a downtime that was not driven by an RFC.
-
View planned changes and incident details: This integration enables you to view planned changes and incident details in the Changes and Incidents and Hierarchy components in OBM.
-
The Business Impact Report integration enables Service Manager operators to launch an impact report from an incident in the context of the incident's affected CI. This opens an OBM KPI over time page, displaying the affected CI and impacted CIs and services, which allows the operator to categorize and prioritize the incident accordingly.
Choose the OM integration type
Choose the type of OM integration you want to configure with OBM.
- Event integration: Events from OM are displayed in the OBM Event Browser.
- Topology integration: The OM topology can synchronize with the OBMRTSM topology. Using topology synchronization, the OM services are synchronized with OBM, and by using corresponding mapping rules, they are transformed into CIs stored in the RTSM.
- Set up OBM in an environment managed by OM: You can set up OBM to run in an environment managed by OM, and set up forwarding targets for OM agent node creation.
View or print
You can view your customized document on the screen, or print it.
If you have a PDF print driver installed on your system, click Print to create PDF documents that are customized according to your selections. PDF print drivers are available from several open source and third-party providers.
Check your selections
The following steps are customized according to your selections. Check that your selections are correct.
If any selections are not correct, click Change.
Overview
The integration between OBM and OBA provides you with the following capabilities:
-
Cross launch integration. You can configure an integration that enables you to open OBA directly from OBM in the context of a specific event or configuration item (CI) of the type host.
-
OBA alerts > OBM events. You can enable forwarding of OBA alerts to OBM, so that they are managed as OBM events. OBA alerts are triggered by the OBA operator for the selected topology elements in OBA.
-
OBA anomalies > OBM anomaly events. Starting with OBA version 3.0, you can enable forwarding of OBA anomalies to OBM, so that they are managed as OBM anomaly events. OBA anomalies are triggered automatically by OBA when a greater deviation from the standard baseline is observed for a number of the monitored topology elements, such as metrics. Upon arrival of an anomaly event, you can set a rule that causes an alert to be created when the condition is met. This could be, for example, when the sufficient number of anomalies are detected or when the severity reaches the threshold.
-
OBM dashboard integration. It is possible to configure a dashboard that displays the OBA user interface within OBM. This can be done by adding OBA as a new component to OBM.
-
Log streaming. You can configure policies in OBM to collect data and forward it to OBA. This enables central configuration of log collection and normalization of the incoming data. To do so, configure a structured log file policy to collect data and a data forwarding policy to forward the data to OBM. For more information, see the OBA Online Help.
-
OBM event collection (forward events from OBM to OBA). You can connect your OBM instance as an OBM Event Collection source type in OBA so that the OBM event data is sent to OBA for further analysis. The OBM Event Collection collects events every 15 minutes. For more information, see the OBA Online Help.
Cross Launch
You can configure an integration that allows you to open OBA from OBM in the context of a specific event or node. This allows you to open analysis tools from OBA, such as log analytics and predictive analytics.
To set up the cross launch integration, do the following:
-
Prerequisite. Set up LW-SSO between OBM and OBA. Make sure you have a Single Sign On (SSO) account created in OBM with the same admin credentials as OBA. Under authentication management, add trusted domain of OBA with port id if you are accessing from outside network. For information on configuring LW-SSO in OBA, see the OBA Hardening Guide.
-
In OBM, log in as the administrator user or a user with the permissions to create tools. Navigate to Administration > Operations Console > Tools.
-
In the CI Types pane, select the CI type for which you want to enable the cross launch.
-
In the Tools pane, select New. Fill in the appropriate values on the General tab.
-
On the Type tab, select URL.
-
On the URL tab, specify a URL as seen in the following examples:
To query a single specified host over the last day:
http://<oba_application_server>:8080/opsa/#/logsearchpql?search=host%20withkey%20%22${event.node.dnsName}%22&selectedTimeRange=ONE_DAY&redirectTo query all hosts over the last hour:
http://<oba_application_server>:8080/opsa/#/logsearchpql?search=host%20withkey%20%20*&selectedTimeRange=ONE_HOUR&redirectTo launch a specific dashboard:
http://<oba_application_server>:8080/opsa/#/dashboard?search=DASHBOARD_NAME%20Dash%20dashboard&start=<event_time>&end=4h~1h&selectedTimeRange=CUSTOM_TIME&redirectNote The start time must contain the event time in milliseconds, for example from the OBM tool parameter, and the end time is defined by a duration, for example
4h~1hincluding four hours before the event time and one hour after the event time.To query a specified CI:
http://<oba_application_server>:8080/opsa/#/logsearchpql?search=host%20withkey%20%22${ci.primary_dns_name}%22&selectedTimeRange=ONE_DAY&redirectAlternatively, use port 8443 when using HTTPS.
-
To test the URL, click Test.
Tip To seamlessly test and run the tool without being prompted for your credentials, a user with the same user name must exist in OBA.
- To use the cross launch from OBM, navigate to Workspaces > Operations Console > Event Perspective. Right-click the desired event and select Launch > Tools from the context menu. Select the tool you created above and click Run.
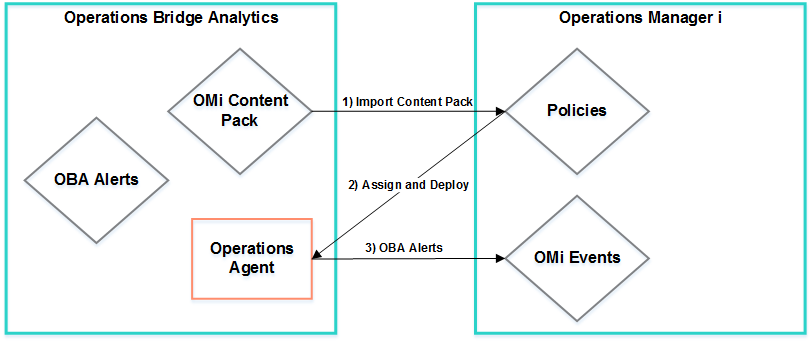
Alerts and Events Integration
To be able to manage OBA alerts and anomalies as OBM events, it is necessary to configure an OBA application server as an OBM monitored node. The Operations AgentThis means that you must have the Operations Agent installed on the OBA application server, which then enables monitoring the OBA alerts and anomalies and forwarding them to OBM.
You can configure the Operations Agent to retrieve alerts and anomalies from OBA and forward them to OBM as events. You can also directly open OBA by using drill-down links in OBM's Event Details. This enables you to get the benefit from using both the capabilities of OBA to identify events by using analytic tools and the advanced event management capabilities of OBM.
If configured, the OBA alerts and anomalies are logged into one predefined log file located on the OBA application server. When the Operations Agent is configured on the OBA application server as an OBM monitored node, it enables the Logfile Entry policy in OBM. The OBA alerts and anomalies are then forwarded to OBM to be managed as events and anomalies. You can filter the log file entries by a set of rules in the policy.
Note The OBA alerts and anomalies are sent with Low, Medium, and High severities, which are then mapped to the OBM severities (Normal, Major, and Critical) in the policies.
For more information about policy management in OBM, see the OBM Administration Guide.
The following diagram shows the details of this integration:
To be able to manage OBA and anomalies as OBA events in OBA 2.3x, you must configure the OBA server as an OBM monitored node. This means that you must install the Operations Agent on the OBA applicatoin server so that the policy template can monitor the log files in which OBA alerts and anomalies are written and create appropriate events in OBM.
Note To be able to use OBM Monitoring Automation features, the Operations Agent 12 or later is required.
When installing the agent, specify the gateway server, the load balancer, or the reverse proxy as the agent's management server. For information about installing the Operations Agent, see the Operations Agent and Operations Smart Plug-ins for Infrastructure Installation and Configuration Guide.
When the communication between the agent and the OBM server is established and the agent processes are running, a node CI is created in the RTSM for the OBA application server. You can then deploy management templates, aspects, policies, and instrumentation to the node. Alternatively, if the node matches an automatic assignment rule, OBM creates an assignment for the CI, and starts the deployment jobs required to transfer the monitoring configuration to the node. After the agent starts monitoring the system, it sends events to OBM, which you can view in the Event Browser.
Note The Operations Agent is available on the Micro Focus Operations Agent media DVD, which is included in the OBM media kit. The latest agent updates can be downloaded from the HPE Software Support website.
When you install OBA, the Operations Agent is installed, but not configured. Configure the agent using the name of the OBM server as follows:
-
Connect the agent to OBM:
-
Log on to the OBA application server.
-
Navigate to the following location:
/opt/OV/bin/OpC/install/ -
Run the following script to configure the Operations Agent on the OBA application server:
./oasetup.sh -configure -management_server <OBM_Gateway_Server/LB>For the
<OBM_Gateway_Server/LB>enter either the FQDN of your OBM gateway server, or the load balancer.
-
-
In the OBM user interface, open the Certificate Requests manager and accept the new certificate request:
Administration > Setup and Maintenance > Certificate Requests
For more information about granting certificate requests, see the OBM Administration Guide.
-
Optional. Check HTTPS communication in both directions:
bbcutil -ping https://<FQDN>If the connection is successful, the command returns
status=eServiceOK.
To configure the connection between OBM and OBA, do the following:
-
Import the content pack to OBM. OBA provides content packs that contain the management templates and aspects area ready to be used by OBM.
-
Copy the content pack, as required for your OBM/OBA versions, to your OBM system:
/opt/HP/opsa/content-packs/omi_content_pack/omi_<omi_version>_content_pack-<oba_version>.zip -
In OBM, navigate to Administration > Setup and Maintenance > Content Packs.
-
Click Import Content Pack Definitions and Content...
-
Click Browse and locate the content pack you copied over earlier.
-
Select Import.
-
- Assign and deploy
management templates to an OBA application server so that they can listen to the log files that report on the OBA alerts and anomalies.
In OBM, navigate to Administration > Monitoring > Management Templates & Aspects.
In the Configuration Folders pane, select the OpsAOBA Alerts Config Folder folder.
In the Management Templates & Aspects pane, select OpsA AspectOBA Aspect and click Assign and Deploy Item...
 .
. - In the Assign and Deploy wizard, select the configuration item (all OBA application servers) to which you want to assign the aspect. Click Finish.
Optional. In the Configure Options page, clear the Enable Assignment(s) check box if you do not want to enable the assignment immediately. You can enable the assignment later by using the Assignments & Tuning manager.
Click Finish. OBM creates a deployment job, which deploys the aspect to the node.
To verify the deployment, run the following command on the OBA application server:
/opt/OV/bin/ovpolicy -lThe result shows the deployed policies.
- In OBA, create alerts and anomalies. For more information, see the OBA Online Help.
Dashboard Integration
You can configure an OBM dashboard that displays the OBA user interface.
Note The OBA dashboard integration with OBM is not supported in Internet Explorer.
-
Prerequisite. LW-SSO must be configured in the OBA environment. For information on configuring LW-SSO in OBA, see the OBA Online HelpOBA Hardening Guide.
Note In order for LW-SSO authentication to work between OBM and OBA, you must use a user with the same name in OBM and OBA.
-
On the OBA application server, locate
/opt/HP/opsa/jboss/standalone/deployments/opsa-ui-web.war/WEB-INF/web.xml.As the root user, modify the following section from:
<init-param>
<param-name>X-Frame-Options</param-name>
<param-value>SAMEORIGIN</param-value>
</init-param>
to
<init-param>
<param-name>X-Frame-Options</param-name>
<param-value>Allow-From http(s)://<OBM gateway or load balancer FQDN>/opr-web</param value>
Important Configuring
X-Frame-OptionstoALLOW-FROM <FQDN>is not supported by all browsers. For more details, see https://developer.mozilla.org/en-US/docs/Web/HTTP/Headers/X-Frame-Options. -
Restart the OBA application server by running the command
opsa-server restart. -
Micro Focus recommends adding a mapping of the OBA IP and the OBA FQDN in the Windows
hostsfile in every client machine that will be used to access OBA. -
Delete the cookies of all browsers used to access OBM.
-
Add the FQDN of the OBA environment to the list of trusted hosts in OBM in the Authentication Management section. Navigate to Administration > Users > Authentication Management. In the Single Sign-On Configuration section, click Edit to open the Single Sign On Editor panel and add the OBA FQDN to the list of trusted hosts.
-
After you have completed the following workflow you will be able to open a log search based on an event in OBM focused on the last hour. In OBM, navigate to MyWorkspace and create a new page:
-
Log in to OBM as the integration user (a user set up with the same name in OBM and OBA).
- Click New Page, then Add Component in the new page or Component Gallery on the menu. Then click
 Add External Component to create a new component.
 -
Specify a name for your component and the URL
<oba server FQDN>:<port>/.Note that the URL must begin with
httporhttps, and the slash at the end must not be omitted. -
In the Configure Wiring section, click
 Add Context and select EventChange.
 -
In the URL Parameters and Value for EventChange section, click
New Parameter. Select Path and click OK. Enter opsa/#/logsearchpqlas value. To perform an XQL search instead, you can enteropsa/#/logsearchxql. -
Click
New Parameter again and select Query String. Enter searchin the Name field and click OK. Enter the following value for the parameter:host%20withkey%20<< event.node.dnsName >>&selectedTimeRange=ONE_HOUR&redirectTo alternatively perform an XQL search, you can enter the following:
Text:%20error%20hostname%3d<<event.node.dnsName>>&selectedTimeRance=ONE_HOUR&redirectThe attribute
event.node.dnsNamemust be selected from the Attributes list. -
The finished URL pattern should be as follows:
http(s)://example.example.net:<port>/opsa/#/logsearchpql?search=host%20withkey%20<< event.node.dnsName >>&selectedTimeRange=ONE_HOUR&redirectIf you decided to perform an XQL search instead, your finished URL pattern should be as follows:
http(s)://example.example.com:<port>/opsa/#/logsearchxql?search=Text:%20error%20hostname%3d<< event.node.dnsName >>&selectedTimeRance=ONE_HOUR&redirect - Click OK to save the component.
-
-
Add the component to a page. The component must be the full width of the page.
Tip For best results, use screen resolution 1920x1200 and maximize the browser.
Overview
OBR is a solution based on Big Data technology Vertica, and has been built to specifically address the challenges of reporting in dynamic IT environments. In addition to consolidating performance data and metrics from multiple domain-focused collectors, OBR also collects and collates specific information on the relationships between the IT elements and the business services. OBR provides sophisticated data collection and aggregation coupled with industry-leading report definition and generation capabilities.
OBM - OBR integration enables topology based service driven enterprise reporting on OpsBridge deployments. It also enables the use case of reporting on OpsBridge events, Health Indicators and KPIs. OBR reports can be interactively accessed in the context of a Configuration Item (CI) or Business View from the OBM Dashboard user interface.
In OBM - OBR integration (deployment scenario), Run-time Service Model (RTSM) is the source of topology information. OBR discovers and synchronizes topology information from RTSM. In OBM, this synchronization technique receives data from Operations Agent or Sitescope, NNMi, NNM iSPI Performance for Metrics. The following diagram shows the flow of data:
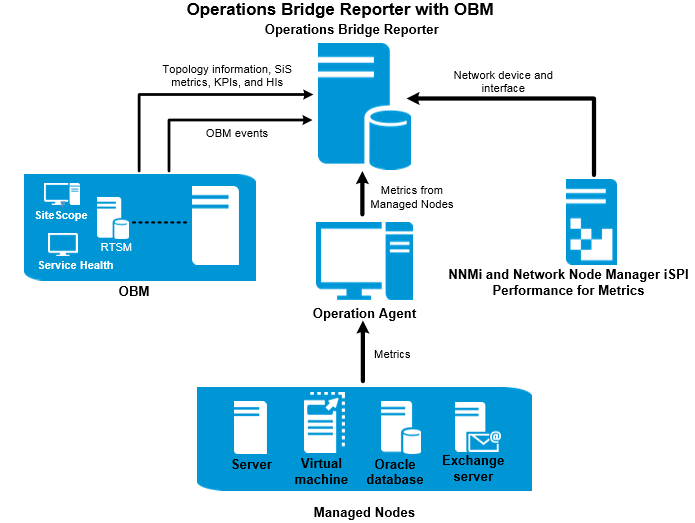
The Operations Bridge solution consolidates all events from the underlying components regardless of the source of the data. OBR, as a reporting solution, fetches these events from OBM over a long term. In this deployment, you can also view the application metrics from integrated APM applications such as BPM and RUM, and the physical and virtual system metrics from SiteScope, and Operations agent.
OBR processes the heterogeneous information and displays it in the reports in the form of charts and tables. It provides cross-domain reports that provide a unified view of the health, performance, and availability of the underlying infrastructure. This unified view shows how the underlying infrastructure is impacting your business services in the long-term.
For more deployment scenarios, see Operations Bridge Reporter documentation in the Documentation Portal.
You can configure APM or OBM as standalone topology and data sources.
In this configuration, the OBM system provides topology data for all nodes and fact data for operations, events and KPI. The APM/BSM system's profile database provides fact data from RUM, BPM, and SiteScope* that are directly monitored by it.
*SiteScope data can be directly accessed through APIs also.
The following areas can be reported in the deployment scenario where OBR is integrated with OBM:
- System Performance
- Operations Agent
- SiteScope
- Virtual Environment Performance
- Operations Agent
- SiteScope
- VMware vCenter
- Cloud Optimizer*
*For more information on Cloud Optimizer content pack integration to report on the virtualization content, see OBR Documentation.
- Network Performance
- Operations Events and KPIs
- OM Events
- OBM Events
- Service Health
- End User Monitoring
- Real User Monitor
- Business Process Monitor
- Enterprise Application Performance
- Microsoft SQL Server
- Microsoft Exchange Server
- Microsoft Active Directory
- Oracle
- Oracle Weblogic Server
- IBM WebSphere Application Server
For more information about OBR reports, see OBR Documentation.
Pre-requisites
Make sure to complete the following requirements before you integrate OBM with OBR for enabling enterprise reporting:
- Complete the installation requirements for OBR
- Pre-install requirements
- Install OBR
- Create the Vertica database
- Plan Configuration and perform the post-installation configuration in Configuration Wizard.
- Verify if you have completed the following steps on the OBM system:
- OBM is installed and configured successfully. For information, see OBM Documentation.
- If you are monitoring systems and applications using the Monitoring Automation component of OBM and Management Packs, make sure that necessary Management Pack policies are deployed. For more information, see OBR Documentation.
- If you are monitoring systems and applications using underlying OM servers and Smart Plug-ins (SPIs), make sure that necessary SPI policies are deployed.
Make sure to deploy necessary OBM views that are shipped with OBR
. This is an essential pre-requisite to enable topology collection from OBM into OBR. See Setup RTSM Topology Source for OBR. Setup RTSM Topology Source for OBR
RTSM is a source of the topology information for OBR. The topology information includes all CIs as modeled and discovered in RTSM. Node resource (CPU, disk etc.) information is directly obtained from the monitoring tools such as Operations Agent, Cloud Optimizer and SiteScope.
Prerequisite for Management Packs
To view reports for the following OBR content packs that gather data from the OBM data source, the corresponding Management Packs must be installed on Operations Agent:
- Microsoft Active Directory
- Microsoft Exchange
- Microsoft SQL Server
- Oracle
- Oracle WebLogic
- IBM WebSphere
- Systems Infrastructure
- Virtualization Infrastructure
Installing these management packs is recommended to view OBR reports for Service Health and OBM.
In APM environment, RTSM is used to discover the CIs and generate the topology views. To configure OBR to collect domain-specific data, you first need to deploy those topology views for each Content Pack.
These topology views contain specific CI attributes that Contents Packs use to collect the relevant data. However, these topology views can vary from one Content Pack to another.
For example, the Exchange Server Content Pack might require a topology view that lists exchange servers, mailbox servers, mailbox and public folder stores, and so on. A System Management Content Pack, however, might require a different topology view that lists all the Business Applications, business services, and system resource, such as CPU, memory, disk, within the infrastructure. Based on these views, the CI attributes for each Content Pack may vary.
List of Content Pack and Topology Views to DeployThe following Content Pack and Topology Views are available in the OBR system at the mentioned locations:
On Windows:
Content Pack
View Name
Location
BPM (Synthetic Transaction Monitoring)
EUM_BSMR.zip(BSM only)EUM_OMi.zip(OBM)%PMDB_HOME%\packages\EndUserManagement\ETL_BPM.ap\source\cmdb_views%PMDB_HOME%\packages\EndUserManagement\ETL_BPM_OMi.ap\source\cmdb_viewsIf BSM is the deployment scenario, then deploy only
EUM_BSMR.zipview in the BSM server.If OBM is the deployment scenario, then deploy only
EUM_OMi.zipview in the OBM server.Real User Transaction Monitoring
EUM_BSMR.zip(BSM only)EUM_OMi.zip(OBM)%PMDB_HOME%\packages\EndUserManagement\ETL_RUM.ap\source\cmdb_views%PMDB_HOME%\packages\EndUserManagement\ETL_RUM_OMi.ap\source\cmdb_viewsIf BSM is the deployment scenario, then deploy only
EUM_BSMR.zipview in the BSM server.If OBM is the deployment scenario, then deploy only
EUM_OMi.zipview in the OBM server.Network
SHR_Network_Views.zip%PMDB_HOME%\packages\Network\ETL_Network_NPS92_RTSM.ap\source\cmdb_viewsSystem Management
SM_BSM9_Views.zip%PMDB_HOME%\packages\SystemManagement\ETL_SystemManagement_PA.ap\source\cmdb_viewsOracle
SHR_DBOracle_Views.zipSHR_DBOracle_OM.zip%PMDB_HOME%\Packages\DatabaseOracle\ETL_DBOracle_DBSPI.ap\source\cmdb_viewsOracle WebLogic Server
J2EEApplication.zipJ2EEApplication_OM.zipFor OM/SPI:
%PMDB_HOME%\packages\ApplicationServer\ETL_AppSrvrWLS_WLSSPI.ap\source\cmdb_viewsFor OBM/MP:
%PMDB_HOME%\packages\ApplicationServer\ETL_AppSrvrWLS_WLSMP.ap\source\cmdb_viewsIBM WebSphere Application Server
J2EEApplication.zipJ2EEApplication_OM.zipFor OM/SPI:
%PMDB_HOME%\packages\ApplicationServer\ETL_AppSrvrWBS_WBSSPI.ap\source\cmdb_viewsFor OBM/MP:
%PMDB_HOME%\packages\ApplicationServer\ETL_AppSrvrWBS_WBSMP.ap\source\cmdb_viewsMicrosoft SQL Server
SHR_DBMSSQL_Views.zipSHR_DBMSSQL_OM.zip%PMDB_HOME%\packages\DatabaseMSSQL\ETL_DBMSSQL_DBSPI.ap\source\cmdb_viewsMicrosoft Exchange Server
SHR_Exchange_Business_View.zipSHR_Exchange_OM.zip%PMDB_HOME%\packages\ExchangeServer\ETL_Exchange_Server2007.ap\source\cmdb_views%PMDB_HOME%\packages\ExchangeServer\ETL_Exchange_Server2010.ap\source\cmdb_views%PMDB_HOME%\packages\ExchangeServer\ETL_Exchange_Server2013.ap\source\cmdb_viewsMicrosoft Active Directory
SHR_AD_Business_View.zipSHR_ActiveDirectory_OM.zip%PMDB_HOME%\packages\ActiveDirectory\ETL_AD_ADSPI.ap\source\cmdb_viewsVirtual Environment Performance SM_BSM9_Views.zip%PMDB_HOME%\packages\SystemManagement\ETL_SystemManagement_PA.ap\source\cmdb_viewsHealth and Key Performance Indicators (Service Health) All the views Cross-Domain Operations Events All the views Operations Events No views On Linux:
Content Pack
View Name
Location
BPM (Synthetic Transaction Monitoring)
EUM_BSMR.zip(BSM only)EUM_OMi.zip(OBM)Business view -
$PMDB_HOME/packages/EndUserManagement/ETL_BPM.ap/source/cmdb_viewsOM view -
$PMDB_HOME/packages/EndUserManagement/ETL_BPM_OMi.ap/source/cmdb_viewsIf BSM is the deployment scenario, then deploy only
EUM_BSMR.zipview in the BSM server.If OBM is the deployment scenario, then deploy only
EUM_OMi.zipview in the OBM server.Real User Transaction Monitoring
EUM_BSMR.zip(BSM only)EUM_OMi.zip(OBM)Business view -
$PMDB_HOME/packages/EndUserManagement/ETL_RUM_OMi.ap/source/cmdb_viewsOM view -
$PMDB_HOME/packages/EndUserManagement/ETL_RUM_OMi.ap/source/cmdb_viewsIf BSM is the deployment scenario, then deploy only
EUM_BSMR.zipview in the BSM server.If OBM is the deployment scenario, then deploy only
EUM_OMi.zipview in the OBM server.Network
SHR_Network_Views.zip$PMDB_HOME/packages/Network/ETL_Network_NPS92_RTSM.ap/source/cmdb_viewsSystem Management
SM_BSM9_Views.zip$PMDB_HOME/packages/SystemManagement/ETL_SystemManagement_PA.ap/source/cmdb_viewsOracle
SHR_DBOracle_Views.zipSHR_DBOracle_OM.zip$PMDB_HOME/Packages/DatabaseOracle/ETL_DBOracle_DBSPI.ap/source/cmdb_viewsOracle WebLogic Server
J2EEApplication.zipJ2EEApplication_OM.zipFor OM/SPI:
$PMDB_HOME/packages/ApplicationServer/ETL_AppSrvrWLS_WLSSPI.ap/source/cmdb_viewsFor OBM/MP:
$PMDB_HOME/packages/ApplicationServer/ETL_AppSrvrWLS_WLSMP.ap/source/cmdb_viewsIBM WebSphere Application Server
J2EEApplication.zipJ2EEApplication_OM.zipFor OM/SPI:
$PMDB_HOME/ packages/ApplicationServer/ETL_AppSrvrWBS_WBSSPI.ap/source/cmdb_viewsFor OBM/MP:
$PMDB_HOME/packages/ApplicationServer/ETL_AppSrvrWBS_WBSMP.ap/source/cmdb_viewsMicrosoft SQL Server
SHR_DBMSSQL_Views.zipSHR_DBMSSQL_OM.zip$PMDB_HOME/packages/DatabaseMSSQL/ETL_DBMSSQL_DBSPI.ap/source/cmdb_viewsMicrosoft Exchange Server
SHR_Exchange_Business_View.zipSHR_Exchange_OM.zip$PMDB_HOME/packages/ExchangeServer/ETL_Exchange_Server2007.ap/source/cmdb_views$PMDB_HOME/packages/ExchangeServer/ETL_Exchange_Server2010.ap/source/cmdb_views$PMDB_HOME/packages/ExchangeServer/ETL_Exchange_Server2013.ap/source/cmdb_viewsMicrosoft Active Directory
SHR_AD_Business_View.zipSHR_ActiveDirectory_OM.zip$PMDB_HOME/packages/ActiveDirectory/ETL_AD_ADSPI.ap/source/cmdb_viewsVirtual Environment Performance SM_BSM9_Views.zip$PMDB_HOME/packages/SystemManagement/ETL_SystemManagement_PA.ap/source/cmdb_viewsHealth and Key Performance Indicators (Service Health) All the views Cross-Domain Operations Events All the views Operations Events No views Deploy Topology Model Views in OBM ServerTo deploy the topology model views for the Content Packs in the OBM server, follow these steps:
In the web browser, type the following URL:
http://<OMi system FQDN>/omiwhere,
<OMi system FQDN>is the FQDN of the OBM server.You can launch the OBM server from a system where OBR is installed or any other local system. If you are launching from local system, ensure that you browse to the location mentioned in List of Content Pack and Topology Views to Deploy table and copy the required views to your local system.
The Operations Bridge Manager Login page appears.
- Type the login name and password and click Log In. The Workspace page appears.
Click Administration > RTSM Administration > Package Manager.
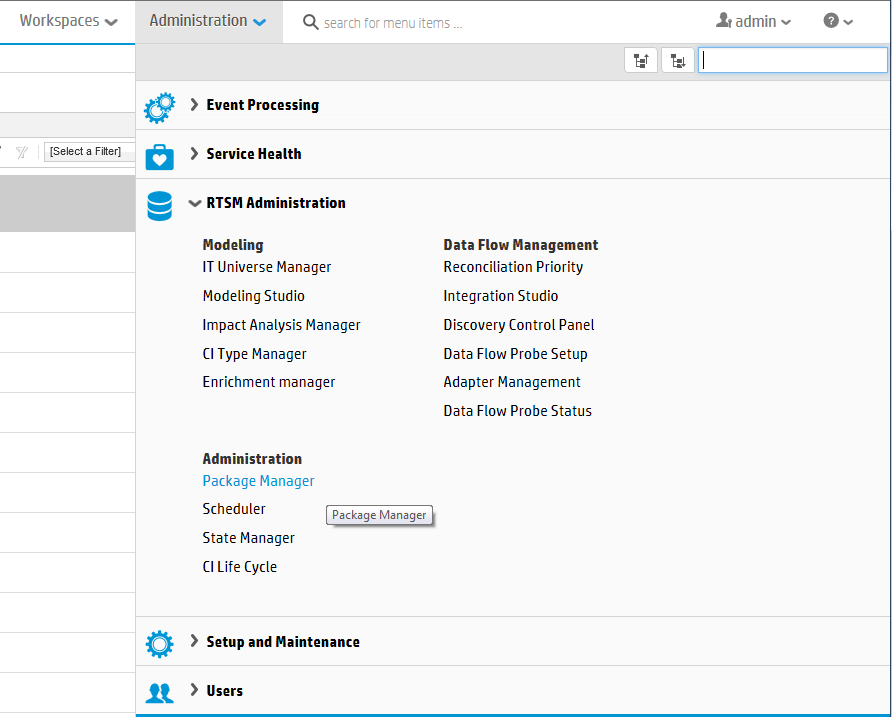
The Package Manager page appears.
Click the Deploy Packages to Server (from local disk)
 icon. The Deploy Package to Server dialog box appears.
Click the Add icon.
The Deploy Package to Server (from local disk) dialog box appears.
Browse to the location of the Content Pack zip files, select the required files, and then click Open.
You can view and select the TQL and ODB views that you want to deploy under Select the resources you want to deploy in the Deploy Package to Server (from local disk) dialog box. Ensure that all the files are selected.
Click Deploy to deploy the Content Pack views.
You have successfully deployed the Content Packs views based on the type of deployment scenario selected for OBR.
Event, HI and KPI Integration
Complete the following tasks on the OBR server to Integrate OBM and OBR:
To collect data for OBM, follow these steps on the OBR Administration Console:
-
In Data Source Selection Wizard, select Operations Bridge Manager (OBM).
-
In Operations Bridge Manager (OBM), select the version of the application deployed in your environment.
For additional deployment configurations using OBM and BSM, see:
-
OBM Topology Source with Integrated BSM
While you can configure BSM and OBM as standalone topology and data sources, you can also setup BSM to synchronize topology data with the OBM system.
In this configuration, the OBM system provides topology data and fact data for Operations Events and KPI. The BSM system provides fact data from RUM and BPM that are directly configured with it. For enabling topology sync between BSM and OBM, see the respective documentation.
Use the NPS RTSM ETL (NetworkPerf_ETL_PerfiSPI_RTSM) Content Pack component, if NNMi is integrated to OBM RTSM. Otherwise, use the non NPS RTSM ETL (NetworkPerf_ETL_PerfiSPI_NonRTSM) Content Pack component.
-
OBM Topology and Fact Source after BSM Upgrade
While you can configure BSM and OBM as standalone topology and data sources, you can also upgrade your BSM system to an OBM system.
In this configuration, the existing topology synchronized between BSM system and OBR system is removed and the OBM system provides topology data for all nodes and fact data for Operations Events and KPI. The BSM system provides fact data from RUM, BPM, and SiteScope that are directly configured with BSM.
In this scenario, if you are already using NPS RTSM ETL (NetworkPerf_ETL_PerfiSPI_RTSM) when OBR was connected to BSM 9.2x then ensure that NNMi is integrated to OBM RTSM after BSM is upgraded to OBM.
In this configuration, after the BSMsystem is upgraded to OBM, all topology and fact data is collected from OBM. To perform the upgrade, follow these steps:
Note Perform the following steps only if the CIIDs for the CI(s) are unchanged after OBM upgrade.
For more information on OBM upgrade, see Operations Bridge Manager Installation and Upgrade Guide.
-
Stop collection service manually from the OBM systems.
Wait until all data is loaded into OBR tables
- Complete the BSM to OBM upgrade process.
-
From the OBR system Administration Console > Content Pack Deployment page:
- Uninstall the older ETL component of BPM (SynTrans_ETL_BPM) and install the newer (SynTrans_ETL_BPM_OMi10) ETL component.
- Uninstall the older ETL component of RUM (RealUsrTrans_ETL_RUM) and install the newer (RealUsrTrans_ETL_RUM_OMi10) ETL component.
- If SiteScope is integrated with OBM then install the SiteScope Direct API (SysPerf_ETL_SiS_API) ETL.
-
To modify the RTSM topology source for OBM, follow these steps:
-
Log on to Postgres database from OBR system using the command line interface:
psql -U pmdb_admin -p 21425 -d dwabc
-
Enter the password given at the time of management database creation during post-install configuration.
-
Run the following commands:
update dwabc.dict_cmdb_ds set hostname='<omi10hostname>';commit;
where
<omi10hostname>, is the hostname of your OBM.
-
-
Log in to Administration Console > Data Source Configuration > Topology Source, and click Configure to modify the user name, password, and port as relevant for OBM.
- Add Operations database connection of OBM in Administration Console > Data Source Configuration > BSM/APM/OBM page. For more information, see Configuring the Management and Profile Database Data Source topic.
-
Enable HI/KPI Data Collection and optionally SiteScope.
- Change the collection service to manual and start the collection service.
Ensure to configure the topology source to OBM in OBR soon after the upgrade and before starting the collection service. Otherwise OBM will continue to point and collect the data from BSM system even after upgrading to OBM. During this period, if a new CI is discovered in BSM and this new CI is collected by OBR, it will end up being a duplicate in OBR when the topology is changed to OBM. If you come across such situation, then use DLC to clean up the duplicates.
-
-
-
(Optional). You may select SiteScope for system performance, Operations Agent and VMware vCenter data source for the virtual environment
- Click Next
Based on the data sources selected in OBR Administration Console, the content types will be listed in the Data Source Selection Wizard > Content Type Selection page.
Follow these steps to select the content type according to your data sources:
- In Data Source Selection Wizard > Content Type Selection > Operations Bridge Manager (OBM), select the required Content Type.
-
(Optional).
- If you select SiteScope for system performance, then SiteScope Metric Channel section appears.
- You must select either Profile DB or Direct API as the metric channel for SiteScope.
In the Content Pack Deployment page, components for Direct API are selected automatically if the option is selected in the Configuration Wizard.
If SiteScope is used to monitor system or virtual environment performance in OBM, the metric channel for SiteScope is through Direct API.
The OBR Administration Console Data Source Selection Wizard > OBM Management Packs/OM SPIs Selection tab displays the selection options only when Enterprise application performance is selected in Content Type Selection tab.
Perform the following steps for each of the deployment scenario:
1. In Data Source Selection Wizard > OBM Management Packs/OM SPIs Selection, select Management Pack and/or Smart Plug-In(SPi).
You must make sure that necessary Management Pack and/or Smart Plug-In (SPi) policies are installed.
2. Click Next.
- To configure RTSM topology source, follow these steps on the OBR Administration Console > Data Source Configuration > Topology Source page.
- Click Create New. The Connection Parameter appears.
-
In the Connection Parameter, type the following details:
Field Description Host name
IP address or FQDN of the APM or OBM server. If your OBM installation is distributed, type the name of the gateway server in the field.
In a distributed OBM deployment with multiple gateway servers and load balancer configured, type the virtual IP address of the load balancer in this field.
Port
Port number to query the RTSM web service. The default port number is 80.
Set the port to 443 when RTSM is HTTPS enabled.
If the port number has been changed, contact your OBM administrator for more information.
User name Name of the RTSM web service user. The default user name is admin.
You can use the user with only RTSMOpenApiUser role assigned to it.
Password Password of the RTSM web service user.
Collection station If you installed collectors on remote systems, you can choose either the local collector or a remote collector.
To configure a remote collector to collect data from this RTSM source, select one of the available remote systems in the drop down list.
To use the collector that was installed by default on the OBR system, select local.
- Click OK.
- Click Save to save the information.
-
Click Test Connection. A success message appears in the information message panel.
You can configure additional RTSM data sources by repeating the same steps.
If the Test Connection fails, check the
{PMDB_HOME}/log/remotepoller.logfor more information. - Click Next. The Content Type Selection page appears.
In case of remote collector, follow the same configuration steps on the system where remote collector is installed.
If RTSM is HTTPS enabled, follow these steps:
-
Set the port to 443 when RTSM is HTTPS enabled during topology source configuration.
-
Export the OBM webserver CA certificate. You can use the
opr-cert-mgmtcommand-line interface to get certificates.For example:
./opr-cert-mgmt.sh ‑export "OBM Webserver CA Certificate" JKS "test" "/tmp/test.jks"If FIPS is enabled, export the certificate in PKCS12 format, else export in PEM format.
- For OBM with multiple Gateways, export the OBM Webserver CA Certificate PEM from the Gateways entry listed in Default Virtual Gateway Server for Data Collectors URL of the OBM user interface Administration > Setup and Maintenance > Infrastructure Settings > Platform Administration - Host Configuration.
-
For OBM configured with a load balancer which performs SSL-offloading, or SSL-forwarding, export the load balancer certificate by running the following command:
openssl s_client -servername <OBMGateway or LoadBalancer FQDN> -connect <OBMGateway or LoadBalancer FQDN>:443 </dev/null | sed -ne '/-BEGIN CERTIFICATE-/,/-END CERTIFICATE-/p' >certificate.pem
For more information about the options that OBM provides to get the certificates, see OBM Documentation.
-
Import the BSM/OBM root CA certificate into OBR server trust store. To import the CA certificates, follow these steps:
-
On Windows
keytool -import -trustcacerts -keystore <Path to store> -file "<filename with path>" -
On Linux
keytool -import -trustcacerts -keystore <Path to store> -file "<filename with path>"where,
<filename with path>is the location and file name of the OBM CA certificates.<
Path to store> is the path to the trust store. You have to mention the same path in the collection service.
-
-
On the collector system chosen in above configuration, add the following fields in
config.prp, located at%PMDB_HOME%\data(on Windows)$PMDB_HOME/data(on Linux):Field
Value
ucmdb.protocolhttpsYou must make sure to add
ucmdb.protocolvalue in{PMDB_HOME}/data/config.prpfile on the OBR server.shr.truststorepathFull path to the keystore file. The path is in the format: C:\HPE-OBR\PMDB\keystore\SHR_CERT_HTTPS.jksNote: You may use the OBR keystore path OR you may create a new keystore.
shr.truststorepasswordPassword of the keystore shr.truststoretypeType of the trust store - JKS or PKCS12 -
Follow these steps to add the entries in collection service scripts:
-
On Windows
- Open the Services window, right-click the HPE_PMDB_Platform_Collection service, and then click Stop.
-
Add
-Djavax.net.ssl.trustStore=<Path to store> -Djavax.net.ssl.trustStorePassword=<password>to JVM_ARGS in%PMDB_HOME%\bin\CollectionServiceCreation.batfile.where, <
Path to store> is the path to the trust store. Example:C:\OBR\PMDB\keystore\SHR_CERT_HTTPS.jksImportant If OBR is upgraded from the 10.2x version to 10.3x version, with HTTPs configured RTSM, make sure to update the <
Path to store> and <password> in the%PMDB_HOME%\bin\CollectionServiceCreation.batfile. -
Recreate the collection service, follow these steps:
-
Open the command line console, run the following commands:
CollectionServiceCreation.bat -remove <OV Install Directory> <Product Install Directory>CollectionServiceCreation.bat -install <OV Install Directory> <Product Install Directory>where,
<OV Install Directory>is%OVInstallDir%<Product Install Directory>is%PMDB_HOME%\..
-
- Open the Services window, right-click the HPE_PMDB_Platform_Collection service, and then click Start.
-
On Linux
-
Go to
/etc/init.ddirectory, and run the following command:On RHEL 6.x/SLES 11.x:
service HPE_PMDB_Platform_Collection stopOn RHEL 7.x/SLES 12.x/OEL:
systemctl stop HPE_PMDB_Platform_Collection.service -
Add
-Djavax.net.ssl.trustStore=<Path to store> -Djavax.net.ssl.trustStorePassword=<password>to JVM_ARGS in$PMDB_HOME/bin/hpbsm_pmdb_collector_start.shfiles.where, <
Path to store> is the path to the trust store.If OBR is upgraded from the 10.2x version to 10.3x version, with HTTPs configured RTSM, make sure to update the <
Path to store> and <password> in the$PMDB_HOME/bin/hpbsm_pmdb_collector_start.shfile. -
Go to
/etc/init.ddirectory, and run the following command:On RHEL 6.x/SLES 11.x:
service HPE_PMDB_Platform_Collection startOn RHEL 7.x/SLES 12.x/OEL:
systemctl start HPE_PMDB_Platform_Collection.service
-
-
-
Stop and start the HPE_PMDB_Platform_Administration service as follows:
On Windows:
- Open the Services window, right-click the HPE_PMDB_Platform_Administration service, and then click Stop.
- Wait for the service to stop.
- Open the Services window, right-click the HPE_PMDB_Platform_Administration service, and then click Start.
On Linux:
-
Go to the
/etc/init.ddirectory, and run the following command:On RHEL 6.x/SLES 11.x:
service HPE_PMDB_Platform_Administration stopOn RHEL 7.x/SLES 12.x/OEL:
systemctl stop HPE_PMDB_Platform_Administration.service -
Wait for the service to stop and then run the following command:
On RHEL 6.x/SLES 11.x:
service HPE_PMDB_Platform_Administration startOn RHEL 7.x/SLES 12.x/OEL:
systemctl start HPE_PMDB_Platform_Administration.service
For installing the required Content Packs, OBR provides the Content Pack Deployment page through the Administration Console. This web-based interface simplifies the process of installation by organizing the Content Packs based on the domain, the data source applications from where you want to collect data, and the specific Content Pack components you want to install to collect the data.
Before you begin installing Content Packs, make sure that:
- OBR Post-installation is complete.
- Data source selections are complete
- In a distributed scenario, if OBR is installed on Windows, irrespective of BO installed on Windows or Linux or on the same system or different system, you must configure DSN on OBR system (installed on Windows) to connect to Vertica database. If OBR is installed on Linux then installer automatically handles the DSN configuration and connection to Vertica database. To configure DSN, see Configuring DSN on Windows for Vertica Database topic in OBR Documentation. To install Content Packs on Windows Operating System, make sure that UAC is disabled on the system.
Use the Content Pack Deployment page in the Administration Console to install the Content Pack components.
The Content Packs already selected in the Content Pack Deployment page may be mutually exclusive. For information on Content Packs that are mutually exclusive, see Listing of ETLs topic in OBR Documentation.
To install the Content Packs, follow these steps:
-
To log on to Administration Console, follow these steps:
-
Launch the following URL:
https://<OBR_Server_FQDN>:21412/OBRApp
where,
<OBR_Server_FQDN>is the fully qualified domain name of the system where OBR is installed. -
Type administrator in the Login Name field and password in the Password field. Click Log In to continue. The Home page appears.
If you use any other user account to access the Administration Console, make sure that the user account has administrator privileges.
-
-
On the left pane, click Content Pack Deployment. The Content Pack Deployment page appears.
The Content Pack Deployment displays the Content Pack components that can be installed in the supported deployment scenario. You can modify the selection by clearing the selected content, the data source application, or the Content Pack components from the list.
While you clear the components of the selected Content Pack that you do not want to install, make sure that you clear the dependent components of the Content Pack.
The following table lists the content that is specific to each deployment scenario:
List of Content Packs
Content
OBM
Default
ü
Cross-Domain Operations Events
ü
Health and Key Performance Indicators
ü
IBM WebSphere Application Server
ü
Microsoft Active Directory
ü
Microsoft Exchange Server
ü
Microsoft SQL Server
ü
MSAppCore ü
Network Performance*
ü
Network Component Health ü
Network Interface Health ü
Operations Events
ü
Oracle
ü
Oracle WebLogic Server
ü
Real User Transaction Monitoring
ü
Synthetic Transaction Monitoring
ü
System Performance
ü
Virtual Environment Performance
ü
To generate reports on data from EVENT database, make the following selections:
-
CrossOprEvent_ETL_OBM
-
CrossOprEvent_ETL_OBM10x
-
CrossOprEvent_Domain_Reports
-
CrossOprEvent_ETL_OBM10x_Extended
-
CrossOprEvent_ETL_OBM_Extended
-
CrossOprEvent_Domain_Reports_Extended
You must upgrade the CrossOprEvent_Domain_Reports_Extended core domain component to the latest version and then install the CrossOprEvent_ETL_OBM10x_Extended component. Also, make sure to uninstall the CrossOprEvent_ETL_OBM10_Extended component.
To generate reports on data from OBM for HI and KPIs, make the following selections:
- HIKPI_ETL_ServiceHealth (RTSM topology)
- HIKPI_ETL_ServiceHealth_OMi10 (OBM topology)
- HIKPI_Domain
- HIKPI_Reports_ServiceHealth
Install the following dependent content packs (and their components) along with this content pack for it to function:
-
Core
- Core_Domain
The dependent domain content pack get selected automatically, you have to select only the ETLs based on the topology source.
The Content Pack components for RTSM and OBM topology source are mutually exclusive. Ensure that only one of them is selected.
-
-
Click Install / Upgrade to install the Content Packs.
An Installation Started status appears in the Status column for Content Pack that is currently being installed. The Content Pack Deployment page automatically refreshes itself to display the updated status. Once the installation completes, an Installation Successful status appears. If the installation fails, an Installation Failed status appears.
The HPE_PMDB_Platform_Orchestration and the Timer service will be stopped automatically during Content Pack(s) install/uninstall operation and will be started once operation is complete.
During install/uninstall process, Content Pack Deployment page does not allow you to interrupt the process. Instead, you must wait till the current process is complete before you can perform any other operations on the Content Pack Deployment page.
After installing Health and Key Performance Indicators Content Pack, you must configure OBR to collect required data from various data collectors. The data collectors work internally within the OBR infrastructure to collect the data. Therefore, you cannot directly interface with these collectors. Instead, you can specify the data sources from where the collectors can collect the data through the Administration Console.
You can configure OBR to collect data from the following Business Service Management data repositories:
-
Management database: The Management database stores system-wide and management-related meta data for the Business Service Management environment.
-
Profile database: The Profile database stores raw and aggregated measurement data obtained from the Business Service Management data collectors. The Profile database also stores measurements collected through OBM, BPM, RUM, and Service Health.
Make sure to assign the same OBR collector to each instance of the Operations/Profile database and Management database connections.
To configure a new Management Database, follow these steps:
-
In the OBR Administration Console, click Data Source Configuration > BSM/APM/OBM > Management Database.
To discover Profile or Operations database in OBR system, you must copy the
seed.propertiesandencryption.propertiesfiles from OBM server to OBR system. For more information, see Configure Multiple Profile Database topic. -
Click Create New. The Connection Parameters dialog box appears.
-
Based on the topology source, select Data Source as OBM.
-
Enter appropriate values in the fields of Connection Parameters dialog box:
For Oracle Database:
Field Description OBM
Select the data source from the options
Database in Oracle RAC Enable this option to select the Database in Oracle RAC. Enable TLS Enable JDBC connection over TLS. This option is displayed when Database type selected is ORACLE. Truststore Path Full path to the
truststorepath. This option is displayed when Enable TLS is selected.It is recommended to have a common trust store file.
Truststore Password The password to access the truststore. This option is displayed when Enable TLS is selected. Host name IP address or FQDN of the Management Database server.
Not displayed when Database in Oracle RAC is selected.
Port Port number to query the Management Database server.
Not displayed when Database in Oracle RAC is selected.
Service name Name of the service. This option appears only if Database in Oracle RAC is selected.
ORA file name The ORA file that contains connection information to the Oracle Real Application Cluster. This option appears only if Database in Oracle RAC is selected. Database type The type of database engine that is used to create the Management Database - Oracle.
Database instance System Identifier (SID) of the Management Database instance.
Not displayed when Database in Oracle RAC is selected.
For information about the database host name, port number, and SID, contact your Business Service Management administrator.
User name Name of the Management Database user, which was specified in the BSM Configuration Wizard when setting up the Management Database.
If the Windows Authentication option is selected, this field is disabled.
Password Password of the Management Database user.
If the Windows Authentication option is selected, this field is disabled.
Collection Station If you installed collectors on remote systems, you can choose either the local collector or a remote collector.
To configure a remote collector with this topology source, select one of the available remote systems in the drop down list.
To use the collector that was installed by default on the OBR system, select local.
For MS SQL Database:
Field Description OBM
Select the data source from the options
Database in Oracle RAC Clear this option. Host name IP address or FQDN of the Management Database server.
Port Port number to query the Management Database server.
Database type The type of database engine that is used to create the Management Database - MSSQL.
Database instance System Identifier (SID) of the Management Database instance.
For information about the database host name, port number, and SID, contact your Business Service Management administrator.
Windows Authentication If you have selected MSSQL as the database type, you have the option to enable Windows authentication for MSSQL, that is, the user can use the same credentials to access SQL Server as that of the Windows system hosting the database.
This option is not supported if OBR server is installed on Linux Operating System.
Database name Name of the database. This field appears only if MSSQL is selected as the database type. User name Name of the Management Database user, which was specified in the BSM Configuration Wizard when setting up the Management Database.
If the Windows Authentication option is selected, this field is disabled.
Password Password of the Management Database user.
If the Windows Authentication option is selected, this field is disabled.
Collection Station If you installed collectors on remote systems, you can choose either the local collector or a remote collector.
To configure a remote collector with this topology source, select one of the available remote systems in the drop down list.
To use the collector that was installed by default on the OBR system, select local.
For PostgreSQL Database:
Field Description OBM
Select the data source from the options
Database in Oracle RAC Clear this option. Host name IP address or FQDN of the Management Database server.
Port Port number to query the Management Database server.
Database type The type of database engine that is used to create the Management Database - PostgreSQL.
Database name Name of the database. User name Name of the Management Database user, which was specified in the BSM Configuration Wizard when setting up the Management Database.
If the Windows Authentication option is selected, this field is disabled.
Password Password of the Management Database user.
If the Windows Authentication option is selected, this field is disabled.
Collection Station This option is used for a collector installed on a remote system.
If you installed collectors on remote systems, you can choose either the local collector or a remote collector.
To configure a remote collector with this topology source, select one of the available remote systems in the drop down list.
To use the collector that was installed by default on the OBR system, select local.
-
Click OK.
- Click Test Connection to test the connection.
-
Click Discover Database to automatically discover corresponding Profile database(s).
If management database and profile database are on the same system as the BSM system (local database), clicking Discover Database will automatically discover the corresponding Profile database. If the databases are on different systems (remote database), you have to manually configure the Profile database using the Profile Database tab. You have to manually provide configuration details with user name and password for each profile database.
After you configure management database with Database in Oracle RAC option selected and the Test Connection is successful, clicking Discovery Database does not automatically discover the corresponding Profile database(s). You have to manually configure the profile database using the Profile Database tab. You have to manually provide configuration details with user name and password for each profile database.
- Click Save to save the changes. A
Saved Successfullymessage appears in the Information message pane.
To configure a new Profile database, follow these steps:
-
In the Administration Console, click Data Source Configuration > BSM/APM/OBM > Profile Database.
-
Click Create New. The Connection Parameters dialog box appears.
-
Type the following values in the Connection Parameters dialog box:
For Oracle database:
Field Description Database in Oracle RAC Enable this option to select the Database in Oracle RAC. Enable TLS Enable JDBC connection over TLS. Truststore file Full path to the
truststorepath. This option is displayed when Enable TLS is selected.It is recommended to have a common trust store file.
Truststore Password The password to access the truststore. This option is displayed when Enable TLS is selected. Host name IP address or FQDN of the Profile Database server.
Not displayed when Database in Oracle RAC is selected.
Port Port number to query the Profile Database server.
Not displayed when Database in Oracle RAC is selected.
Service name Name of the service. This option appears only if Database in Oracle RAC is selected.
ORA file name The ORA file that contains connection information to the Oracle Real Application Cluster. This option appears only if Database in Oracle RAC is selected. Database type The type of database engine that is used to create the Profile Database - Oracle. Management Database Links Profile Database to the Management Database. If you collect data from only SiteScope, no Management Database needs to be selected. Domains Select the domains for which you want to enable data collection.
You must select the domains from which you want to enable data collection. If you have skipped topology configuration during post-install configuration and installed the content packs, you must return here to select from among the following domains to enable data collection.
- Operations Manager
- OBM
- RUM
- BPM
- Service Health
Database instance System Identifier (SID) of the Profile Database instance.
Not displayed when Database in Oracle RAC is selected.
For information about the database host name, port number, and SID, contact your Business Service Management administrator.
User name Name of the Profile Database user, which was specified in the BSM Configuration Wizard when setting up the Profile Database.
If the Windows Authentication option is selected, this field is disabled.
Password Password of the Profile Database user, which was specified in the BSM Configuration Wizard when setting up the Profile Database.
If the Windows Authentication option is selected, this field is disabled.
Collection Station This option is used for a collector installed on a remote system. For MS SQL Database:
Field Description Database in Oracle RAC Clear this option. Host name IP address or FQDN of the Profile Database server.
Port Port number to query the Profile Database server.
Database type The type of database engine that is used to create the Profile Database - MSSQL. Management Database Links Profile Database to the Management Database. If you collect data from only SiteScope, no Management Database needs to be selected. Domains Select the domains for which you want to enable data collection.
You must select the domains from which you want to enable data collection. If you have skipped topology configuration during post-install configuration and installed the content packs, you must return here to select from among the following domains to enable data collection.
- Operations Manager
- OBM
- RUM
- BPM
- Service Health
Database instance System Identifier (SID) of the Profile Database instance.
For information about the database host name, port number, and SID, contact your Business Service Management administrator.
Windows Authentication If you have selected MSSQL as the database type, you have the option to enable Windows authentication for MSSQL, that is, the user can use the same credentials to access SQL Server as that of the Windows system hosting the database.
This option is not supported if OBR server is installed on Linux Operating System.
Database name Name of the database. This field appears only if MSSQL is selected as the database type. User name Name of the Profile Database user, which was specified in the BSM Configuration Wizard when setting up the Profile Database.
If the Windows Authentication option is selected, this field is disabled.
Password Password of the Profile Database user, which was specified in the BSM Configuration Wizard when setting up the Profile Database.
If the Windows Authentication option is selected, this field is disabled.
Collection Station This option is used for a collector installed on a remote system. -
Click OK.
- Click Test Connection to test the connection.
- Click Save to save the changes made on this page. A
Saved Successfullymessage appears in the Information message pane.
After you save the newly created Management database connection, OBR (local collector or remote collector) retrieves the Profile database information from the Management database data source and lists all the existing Profile database data sources under the Profile Database section of the page.
Data collection for the Profile database data source is enabled by default. In addition, the collection frequency is scheduled for every one hour.
In case of a Remote Collector, the collection station has to be selected from the Database type drop down box provided in the Profile Database section of the page.
Enable KPI Data Collection for Service Health CIs
KPIs are high-level indicators of a CI’s performance and availability. The KPI data pertaining to certain logical Service Health CIs, such as Business Service, Business Application, Business Process, and Host, are logged by default in the Profile database. OBR collects this data from the database for reporting.
However, the KPI data for other CI types are not automatically logged in the Profile database. To enable the logging of the KPI data for these CI types, you must configure the CIs in the BSM. For more information, see the Persistent Data and Historical Data section of the Business Service Management - Using Service Health guide. This document is available for the product, Application Performance Management (BAC), at the Software URL.
After installing OBM Event Content Packs, you must configure OBR to collect required data from various data collectors. The data collectors work internally within the OBR infrastructure to collect the data. Therefore, you cannot directly interface with these collectors. Instead, you can specify the data sources from where the collectors can collect the data through the Administration Console.
In OBM deployment scenario, SiteScope and Operations Agent monitors the physical and virtual nodes. When you configure data source in this scenario, choose Operations Agent and/or SiteScope as the data source.
If you install the OBM Content Pack, you must configure the OBM database connection for data collection. You can configure OBR to collect data from the following OBM data repositories:
-
Events database: The events database stores data obtained from OMi (9.x versions) data source.
-
Operations database: The operations database stores data obtained from OBM 10 (and later versions OBM) data source.
Before you create a new OBM data source connection, make sure that a data source connection for the Management database exists on the Management DB / Profile DB page, see Configuring the Management and Profile Database Data Source topic. This data connection is required to retrieve Assigned User/Group information for OBM, which is stored in the Management database.
If you have one or more OBM setups in your environment, you must configure the OBM data source that belongs to the BSM RTSM that was configured as the topology source.
To configure the OBM data source connections, follow these steps:
-
In the Administration Console, click Data Source Configuration > BSM/APM/OBM > Operations Database.
- Click Create New to create a new OBM data source connection. The Connection Parameters dialog box appears.
-
Specify or type the following values in the Connection Parameters dialog box:
For Oracle database:
Field Description Event
Operations
Select your data source. Database in Oracle RAC Enable this option to select the Database in Oracle RAC. Enable TLS Enable JDBC connection over TLS. This option is displayed when Database type selected is ORACLE. Truststore file Full path to the truststorepath. This option is displayed when Enable TLS is selected.Truststore Password The password to access the truststore. This option is displayed when Enable TLS is selected. Service name Name of the service. This option appears only if Database in Oracle RAC is selected.
ORA file name The ORA file that contains connection information to the Oracle Real Application Cluster. This option appears only if Database in Oracle RAC is selected. Host name IP address or FQDN of the Management Database server.
Not displayed when Database in Oracle RAC is selected.
Port Port number to query the Management Database server.
Not displayed when Database in Oracle RAC is selected.
Database type The type of database engine that is used to create the Management Database - Oracle.
Management Database Links Profile Database to the Management Database. If you collect data from only SiteScope, no Management Database needs to be selected. Database instance System Identifier (SID) of the Management Database instance.
Not displayed when Database in Oracle RAC is selected.
For information about the database host name, port number, and SID, contact your Business Service Management administrator.
User name Name of the OBM Database user, which was specified in the BSM Configuration Wizard when setting up the Profile Database.
If the Windows Authentication option is selected, this field is disabled.
Password Password of the OBM Database user, which was specified in the BSM Configuration Wizard when setting up the Profile Database.
If the Windows Authentication option is selected, this field is disabled.
Collection Station This option is used for a collector installed on a remote system. For MS SQL database:
Field Description Event
Operations
Select your data source. Database in Oracle RAC Clear this option. Host name IP address or FQDN of the Management Database server.
Port Port number to query the Management Database server.
Database type The type of database engine that is used to create the Management Database - MSSQL.
Management Database Links Profile Database to the Management Database. If you collect data from only SiteScope, no Management Database needs to be selected. Database instance System Identifier (SID) of the Management Database instance.
For information about the database host name, port number, and SID, contact your Business Service Management administrator.
Windows Authentication If you have selected MSSQL as the database type, you have the option to enable Windows authentication for MSSQL, that is, the user can use the same credentials to access SQL Server as that of the Windows system hosting the database.
This option is not supported if OBR server is installed on Linux Operating System.
Database name Name of the database. This field appears only if MSSQL is selected as the database type. User name Name of the OBM Database user, which was specified in the BSM Configuration Wizard when setting up the Profile Database.
If the Windows Authentication option is selected, this field is disabled.
Password Password of the OBM Database user, which was specified in the BSM Configuration Wizard when setting up the Profile Database.
If the Windows Authentication option is selected, this field is disabled.
Collection Station This option is used for a collector installed on a remote system. For PostgreSQL database:
Field Description Event
Operations
Select your data source. Database in Oracle RAC Clear this option. Host name IP address or FQDN of the Management Database server.
Port Port number to query the Management Database server.
Database type The type of database engine that is used to create the Management Database . For Operations database - PostgreSQL.
Management Database Links Profile Database to the Management Database. If you collect data from only SiteScope, no Management Database needs to be selected. Database name Name of the database. This field appears only if MSSQL is selected as the database type. User name Name of the OBM Database user, which was specified in the BSM Configuration Wizard when setting up the Profile Database.
If the Windows Authentication option is selected, this field is disabled.
Password Password of the OBM Database user, which was specified in the BSM Configuration Wizard when setting up the Profile Database.
If the Windows Authentication option is selected, this field is disabled.
Collection Station This option is used for a collector installed on a remote system. -
Click OK.
You can create only one OBM data source connection. After the connection is created, the Create New button is disabled by default. Make sure that you type in the correct values.
- Click Test Connection to test the connection.
- Click Save to save the changes. A
Saved Successfullymessage appears in the Information message panel. - To change the OBM data collection schedule for one or more hosts, in the Schedule Frequency column, specify a collection time between 1 and 24 hours in the Hrs box.
- Click Save to save the changes. A
Saved Successfullymessage appears in the Information message panel.
Points to note:
- After upgrading to the OBM 10.x content pack, the K_Event_PropertyChanges and R_Event_propertyChanges tables are retained to store the History of Event Property changes. The Event property change history will be captured within the K_Event_HistoryLine and R_Event_HistoryLine tables in compressed xml format. Based on these tables any custom extensions can be designed.
- For OMi versions till 9.x, the Initiated by ID metric from OMi event database is stored in the InitiatedByID column of K_Event_Ext table. In OMi 10.x and higher versions, the Initiated by ID metric from OBM event database is stored in the Event_temp2 [Event Temporary column2 ] column of K_Event_Ext table.
OBM Integrated with APM
Complete the following tasks on the OBR server to Integrate OBM and OBR:
To collect data for OBM, follow these steps on the OBR Administration Console:
-
In Data Source Selection, select Operations Bridge Manager (OBM).
-
In Operations Bridge Manager (OBM), select the version of the application deployed in your environment.
For additional deployment configurations using APM, see:
-
OBM Topology Source with Integrated APM
In this configuration, the OBM system provides topology data and fact data for Operations Events and KPI. The APM system provides fact data from RUM, BPM, SiteScope and Service Health that are directly configured with it. For enabling topology sync between APM and OBM, see the respective documentation.
-
-
(Optional). You may select SiteScope for system performance, Operations Agent and VMware vCenter data source for the virtual environment
- Click Next
Based on the data sources selected in OBR Administration Console, the content types will be listed in the Data Source Selection Wizard > Content Type Selection page.
Follow these steps to select the content type according to your data sources:
- In Data Source Selection Wizard > Content Type Selection > Operations Bridge Manager (OBM), select the required Content Type.
-
(Optional).
- If you select SiteScope for system performance, then SiteScope Metric Channel section appears.
- You must select either Profile DB or Direct API as the metric channel for SiteScope.
In the Content Pack Deployment page, components for Direct API are selected automatically if the option is selected in the Configuration Wizard.
If SiteScope is used to monitor system or virtual environment performance in OBM, the metric channel for SiteScope is through Direct API.
The OBR Administration Console Data Source Selection Wizard > OBM Management Packs/OM SPIs Selection tab displays the selection options only when Enterprise application performance is selected in Content Type Selection tab.
Perform the following steps for each of the deployment scenario:
1. In Data Source Selection Wizard > OBM Management Packs/OM SPIs Selection, select Management Pack and/or Smart Plug-In(SPi).
You must make sure that necessary Management Pack and/or Smart Plug-In (SPi) policies are installed.
2. Click Next.
- To configure RTSM topology source, follow these steps on the OBR Administration Console > Data Source Configuration > Topology Source page.
- Click Create New. The Connection Parameter appears.
-
In the Connection Parameter, type the following details:
Field Description Host name
IP address or FQDN of the APM or OBM server. If your APM installation is distributed, type the name of the gateway server in the field.
In a distributed APM deployment with multiple gateway servers and load balancer configured, type the virtual IP address of the load balancer in this field.
Port
Port number to query the RTSM web service. The default port number is 80.
Set the port to 443 when RTSM is HTTPS enabled.
If the port number has been changed, contact your APM administrator for more information.
User name Name of the RTSM web service user. The default user name is admin.
You can use the user with only RTSMOpenApiUser role assigned to it.
Password Password of the RTSM web service user.
Collection station If you installed collectors on remote systems, you can choose either the local collector or a remote collector.
To configure a remote collector to collect data from this RTSM source, select one of the available remote systems in the drop down list.
To use the collector that was installed by default on the OBR system, select local.
- Click OK.
- Click Save to save the information.
-
Click Test Connection. A success message appears in the information message panel.
You can configure additional RTSM data sources by repeating the same steps.
If the Test Connection fails, check the
{PMDB_HOME}/log/remotepoller.logfor more information. - Click Next. The Content Type Selection page appears.
In case of remote collector, follow the same configuration steps on the system where remote collector is installed.
If RTSM is HTTPS enabled, follow these steps:
-
Set the port to 443 when RTSM is HTTPS enabled during topology source configuration.
-
Export the OBM webserver CA certificate. You can use the
opr-cert-mgmtcommand-line interface to get certificates.For example:
./opr-cert-mgmt.sh ‑export "OBM Webserver CA Certificate" JKS "test" "/tmp/test.jks"If FIPS is enabled, export the certificate in PKCS12 format, else export in PEM format.
- For OBM with multiple Gateways, export the OBM Webserver CA Certificate PEM from the Gateways entry listed in Default Virtual Gateway Server for Data Collectors URL of the OBM user interface Administration > Setup and Maintenance > Infrastructure Settings > Platform Administration - Host Configuration.
-
For OBM configured with a load balancer which performs SSL-offloading, or SSL-forwarding, export the load balancer certificate by running the following command:
openssl s_client -servername <OBMGateway or LoadBalancer FQDN> -connect <OBMGateway or LoadBalancer FQDN>:443 </dev/null | sed -ne '/-BEGIN CERTIFICATE-/,/-END CERTIFICATE-/p' >certificate.pem
For more information about the options that OBM provides to get the certificates, see OBM Documentation.
-
Import the BSM/OBM root CA certificate into OBR server trust store. To import the CA certificates, follow these steps:
-
On Windows
keytool -import -trustcacerts -keystore <Path to store> -file "<filename with path>" -
On Linux
keytool -import -trustcacerts -keystore <Path to store> -file "<filename with path>"where,
<filename with path>is the location and file name of the OBM CA certificates.<
Path to store> is the path to the trust store. You have to mention the same path in the collection service.
-
-
On the collector system chosen in above configuration, add the following fields in
config.prp, located at%PMDB_HOME%\data(on Windows)$PMDB_HOME/data(on Linux):Field
Value
ucmdb.protocolhttpsYou must make sure to add
ucmdb.protocolvalue in{PMDB_HOME}/data/config.prpfile on the OBR server.shr.truststorepathFull path to the keystore file. The path is in the format: C:\HPE-OBR\PMDB\keystore\SHR_CERT_HTTPS.jksNote: You may use the OBR keystore path OR you may create a new keystore.
shr.truststorepasswordPassword of the keystore shr.truststoretypeType of the trust store - JKS or PKCS12 -
Follow these steps to add the entries in collection service scripts:
-
On Windows
- Open the Services window, right-click the HPE_PMDB_Platform_Collection service, and then click Stop.
-
Add
-Djavax.net.ssl.trustStore=<Path to store> -Djavax.net.ssl.trustStorePassword=<password>to JVM_ARGS in%PMDB_HOME%\bin\CollectionServiceCreation.batfile.where, <
Path to store> is the path to the trust store. Example:C:\OBR\PMDB\keystore\SHR_CERT_HTTPS.jksImportant If OBR is upgraded from the 10.2x version to 10.3x version, with HTTPs configured RTSM, make sure to update the <
Path to store> and <password> in the%PMDB_HOME%\bin\CollectionServiceCreation.batfile. -
Recreate the collection service, follow these steps:
-
Open the command line console, run the following commands:
CollectionServiceCreation.bat -remove <OV Install Directory> <Product Install Directory>CollectionServiceCreation.bat -install <OV Install Directory> <Product Install Directory>where,
<OV Install Directory>is%OVInstallDir%<Product Install Directory>is%PMDB_HOME%\..
-
- Open the Services window, right-click the HPE_PMDB_Platform_Collection service, and then click Start.
-
On Linux
-
Go to
/etc/init.ddirectory, and run the following command:On RHEL 6.x/SLES 11.x:
service HPE_PMDB_Platform_Collection stopOn RHEL 7.x/SLES 12.x/OEL:
systemctl stop HPE_PMDB_Platform_Collection.service -
Add
-Djavax.net.ssl.trustStore=<Path to store> -Djavax.net.ssl.trustStorePassword=<password>to JVM_ARGS in$PMDB_HOME/bin/hpbsm_pmdb_collector_start.shfiles.where, <
Path to store> is the path to the trust store.If OBR is upgraded from the 10.2x version to 10.3x version, with HTTPs configured RTSM, make sure to update the <
Path to store> and <password> in the$PMDB_HOME/bin/hpbsm_pmdb_collector_start.shfile. -
Go to
/etc/init.ddirectory, and run the following command:On RHEL 6.x/SLES 11.x:
service HPE_PMDB_Platform_Collection startOn RHEL 7.x/SLES 12.x/OEL:
systemctl start HPE_PMDB_Platform_Collection.service
-
-
-
Stop and start the HPE_PMDB_Platform_Administration service as follows:
On Windows:
- Open the Services window, right-click the HPE_PMDB_Platform_Administration service, and then click Stop.
- Wait for the service to stop.
- Open the Services window, right-click the HPE_PMDB_Platform_Administration service, and then click Start.
On Linux:
-
Go to the
/etc/init.ddirectory, and run the following command:On RHEL 6.x/SLES 11.x:
service HPE_PMDB_Platform_Administration stopOn RHEL 7.x/SLES 12.x/OEL:
systemctl stop HPE_PMDB_Platform_Administration.service -
Wait for the service to stop and then run the following command:
On RHEL 6.x/SLES 11.x:
service HPE_PMDB_Platform_Administration startOn RHEL 7.x/SLES 12.x/OEL:
systemctl start HPE_PMDB_Platform_Administration.service
For installing the required Content Packs, OBR provides the Content Pack Deployment page through the Administration Console. This web-based interface simplifies the process of installation by organizing the Content Packs based on the domain, the data source applications from where you want to collect data, and the specific Content Pack components you want to install to collect the data.
Before you begin installing Content Packs, make sure that:
- Post-installation is complete
- Data source selections are complete
- In a distributed scenario, if OBR is installed on Windows, irrespective of BO installed on Windows or Linux or on the same system or different system, you must configure DSN on OBR system (installed on Windows) to connect to Vertica database. If OBR is installed on Linux then installer automatically handles the DSN configuration and connection to Vertica database. To configure DSN, see Configuring DSN on Windows for Vertica Database topic in OBR Documentation. To install Content Packs on Windows Operating System, make sure that UAC is disabled on the system.
Use the Content Pack Deployment page in the Administration Console to install the Content Pack components.
The Content Packs already selected in the Content Pack Deployment page may be mutually exclusive. For information on Content Packs that are mutually exclusive, see Listing of ETLs topic in OBR Documentation.
To install the Content Packs, follow these steps:
-
To log on to Administration Console, follow these steps:
-
Launch the following URL:
https://<OBR_Server_FQDN>:21412/OBRApp
where,
<OBR_Server_FQDN>is the fully qualified domain name of the system where OBR is installed. -
Type administrator in the Login Name field and password in the Password field. Click Log In to continue. The Home page appears.
If you use any other user account to access the Administration Console, make sure that the user account has administrator privileges.
-
-
On the left pane, click Content Pack Deployment. The Content Pack Deployment page appears.
The Content Pack Deployment displays the Content Pack components that can be installed in the supported deployment scenario. You can modify the selection by clearing the selected content, the data source application, or the Content Pack components from the list.
While you clear the components of the selected Content Pack that you do not want to install, make sure that you clear the dependent components of the Content Pack.
The following table lists the content that is specific to each deployment scenario:
List of Content Packs
Content
OBM
Default
ü
Cross-Domain Operations Events
ü
Health and Key Performance Indicators
ü
IBM WebSphere Application Server
ü
Microsoft Active Directory
ü
Microsoft Exchange Server
ü
Microsoft SQL Server
ü
MSAppCore ü
Network Performance*
ü
Network Component Health ü
Network Interface Health ü
Operations Events
ü
Oracle
ü
Oracle WebLogic Server
ü
Real User Transaction Monitoring
ü
Synthetic Transaction Monitoring
ü
System Performance
ü
Virtual Environment Performance
ü
To generate reports on data from EVENT database, make the following selections:
-
CrossOprEvent_ETL_OBM
-
CrossOprEvent_ETL_OBM10x
-
CrossOprEvent_Domain_Reports
-
CrossOprEvent_ETL_OBM10x_Extended
-
CrossOprEvent_ETL_OBM_Extended
-
CrossOprEvent_Domain_Reports_Extended
You must upgrade the CrossOprEvent_Domain_Reports_Extended core domain component to the latest version and then install the CrossOprEvent_ETL_OBM10x_Extended component. Also, make sure to uninstall the CrossOprEvent_ETL_OBM10_Extended component.
To generate reports on data from OBM for HI and KPIs, make the following selections:
- HIKPI_ETL_ServiceHealth (RTSM topology)
- HIKPI_ETL_ServiceHealth_OMi10 (OBM topology)
- HIKPI_Domain
- HIKPI_Reports_ServiceHealth
Install the following dependent content packs (and their components) along with this content pack for it to function:
-
Core
- Core_Domain
The dependent domain content pack get selected automatically, you have to select only the ETLs based on the topology source.
The Content Pack components for RTSM and OBM topology source are mutually exclusive. Ensure that only one of them is selected.
-
-
Click Install / Upgrade to install the Content Packs.
An Installation Started status appears in the Status column for Content Pack that is currently being installed. The Content Pack Deployment page automatically refreshes itself to display the updated status. Once the installation completes, an Installation Successful status appears. If the installation fails, an Installation Failed status appears.
The HPE_PMDB_Platform_Orchestration and the Timer service will be stopped automatically during Content Pack(s) install/uninstall operation and will be started once operation is complete.
During install/uninstall process, Content Pack Deployment page does not allow you to interrupt the process. Instead, you must wait till the current process is complete before you can perform any other operations on the Content Pack Deployment page.
After installing Health and Key Performance Indicators Content Pack, you must configure OBR to collect required data from various data collectors. The data collectors work internally within the OBR infrastructure to collect the data. Therefore, you cannot directly interface with these collectors. Instead, you can specify the data sources from where the collectors can collect the data through the Administration Console.
You can configure OBR to collect data from the following Business Service Management data repositories:
-
Management database: The Management database stores system-wide and management-related meta data for the Business Service Management environment.
-
Profile database: The Profile database stores raw and aggregated measurement data obtained from the Business Service Management data collectors. The Profile database also stores measurements collected through OBM, BPM, RUM, and Service Health.
Make sure to assign the same OBR collector to each instance of the Operations/Profile database and Management database connections.
To configure a new Management Database, follow these steps:
-
In the OBRAdministration Console, click Data Source Configuration > BSM/APM/OBM > Management Database.
To discover Profile or Operations database in OBR system, you must copy the
seed.propertiesandencryption.propertiesfiles from APM/OBM server to OBR system. For more information, see Configure Multiple Profile Database topic. -
Click Create New. The Connection Parameters dialog box appears.
-
Based on the topology source, select Data Source as BSM/APM or OBM.
-
Enter appropriate values in the fields of Connection Parameters dialog box:
For Oracle Database:
Field Description -
BSM/APM
- OBM
Select the data source from the options
Database in Oracle RAC Enable this option to select the Database in Oracle RAC. Enable TLS Enable JDBC connection over TLS. This option is displayed when Database type selected is ORACLE. Truststore Path Full path to the
truststorepath. This option is displayed when Enable TLS is selected.It is recommended to have a common trust store file.
Truststore Password The password to access the truststore. This option is displayed when Enable TLS is selected. Host name IP address or FQDN of the Management Database server.
Not displayed when Database in Oracle RAC is selected.
Port Port number to query the Management Database server.
Not displayed when Database in Oracle RAC is selected.
Service name Name of the service. This option appears only if Database in Oracle RAC is selected.
ORA file name The ORA file that contains connection information to the Oracle Real Application Cluster. This option appears only if Database in Oracle RAC is selected. Database type The type of database engine that is used to create the Management Database - Oracle.
Database instance System Identifier (SID) of the Management Database instance.
Not displayed when Database in Oracle RAC is selected.
For information about the database host name, port number, and SID, contact your Business Service Management administrator.
User name Name of the Management Database user, which was specified in the BSM Configuration Wizard when setting up the Management Database.
If the Windows Authentication option is selected, this field is disabled.
Password Password of the Management Database user.
If the Windows Authentication option is selected, this field is disabled.
Collection Station If you installed collectors on remote systems, you can choose either the local collector or a remote collector.
To configure a remote collector with this topology source, select one of the available remote systems in the drop down list.
To use the collector that was installed by default on the OBR system, select local.
For MS SQL Database:
Field Description -
BSM/APM
- OBM
Select the data source from the options
Database in Oracle RAC Clear this option. Host name IP address or FQDN of the Management Database server.
Port Port number to query the Management Database server.
Database type The type of database engine that is used to create the Management Database - MSSQL.
Database instance System Identifier (SID) of the Management Database instance.
For information about the database host name, port number, and SID, contact your Business Service Management administrator.
Windows Authentication If you have selected MSSQL as the database type, you have the option to enable Windows authentication for MSSQL, that is, the user can use the same credentials to access SQL Server as that of the Windows system hosting the database.
This option is not supported if OBR server is installed on Linux Operating System.
Database name Name of the database. This field appears only if MSSQL is selected as the database type. User name Name of the Management Database user, which was specified in the BSM Configuration Wizard when setting up the Management Database.
If the Windows Authentication option is selected, this field is disabled.
Password Password of the Management Database user.
If the Windows Authentication option is selected, this field is disabled.
Collection Station If you installed collectors on remote systems, you can choose either the local collector or a remote collector.
To configure a remote collector with this topology source, select one of the available remote systems in the drop down list.
To use the collector that was installed by default on the OBR system, select local.
For PostgreSQL Database:
Field Description -
BSM/APM
- OBM
Select the data source from the options
Database in Oracle RAC Clear this option. Host name IP address or FQDN of the Management Database server.
Port Port number to query the Management Database server.
Database type The type of database engine that is used to create the Management Database - PostgreSQL.
Database name Name of the database. User name Name of the Management Database user, which was specified in the BSM Configuration Wizard when setting up the Management Database.
If the Windows Authentication option is selected, this field is disabled.
Password Password of the Management Database user.
If the Windows Authentication option is selected, this field is disabled.
Collection Station This option is used for a collector installed on a remote system.
If you installed collectors on remote systems, you can choose either the local collector or a remote collector.
To configure a remote collector with this topology source, select one of the available remote systems in the drop down list.
To use the collector that was installed by default on the OBR system, select local.
-
-
Click OK.
- Click Test Connection to test the connection.
-
Click Discover Database to automatically discover corresponding Profile database(s).
If management database and profile database are on the same system as the BSM system (local database), clicking Discover Database will automatically discover the corresponding Profile database. If the databases are on different systems (remote database), you have to manually configure the Profile database using the Profile Database tab. You have to manually provide configuration details with user name and password for each profile database.
After you configure management database with Database in Oracle RAC option selected and the Test Connection is successful, clicking Discovery Database does not automatically discover the corresponding Profile database(s). You have to manually configure the profile database using the Profile Database tab. You have to manually provide configuration details with user name and password for each profile database.
- Click Save to save the changes. A
Saved Successfullymessage appears in the Information message pane.
To configure a new Profile database, follow these steps:
-
In the Administration Console, click Data Source Configuration > BSM/APM/OBM > Profile Database.
-
Click Create New. The Connection Parameters dialog box appears.
-
Type the following values in the Connection Parameters dialog box:
For Oracle database:
Field Description Database in Oracle RAC Enable this option to select the Database in Oracle RAC. Enable TLS Enable JDBC connection over TLS. Truststore file Full path to the
truststorepath. This option is displayed when Enable TLS is selected.It is recommended to have a common trust store file.
Truststore Password The password to access the truststore. This option is displayed when Enable TLS is selected. Host name IP address or FQDN of the Profile Database server.
Not displayed when Database in Oracle RAC is selected.
Port Port number to query the Profile Database server.
Not displayed when Database in Oracle RAC is selected.
Service name Name of the service. This option appears only if Database in Oracle RAC is selected.
ORA file name The ORA file that contains connection information to the Oracle Real Application Cluster. This option appears only if Database in Oracle RAC is selected. Database type The type of database engine that is used to create the Profile Database - Oracle. Management Database Links Profile Database to the Management Database. If you collect data from only SiteScope, no Management Database needs to be selected. Domains Select the domains for which you want to enable data collection.
You must select the domains from which you want to enable data collection. If you have skipped topology configuration during post-install configuration and installed the content packs, you must return here to select from among the following domains to enable data collection.
- Operations Manager
- OBM
- RUM
- BPM
- Service Health
Database instance System Identifier (SID) of the Profile Database instance.
Not displayed when Database in Oracle RAC is selected.
For information about the database host name, port number, and SID, contact your Business Service Management administrator.
User name Name of the Profile Database user, which was specified in the BSM Configuration Wizard when setting up the Profile Database.
If the Windows Authentication option is selected, this field is disabled.
Password Password of the Profile Database user, which was specified in the BSM Configuration Wizard when setting up the Profile Database.
If the Windows Authentication option is selected, this field is disabled.
Collection Station This option is used for a collector installed on a remote system. For MS SQL Database:
Field Description Database in Oracle RAC Clear this option. Host name IP address or FQDN of the Profile Database server.
Port Port number to query the Profile Database server.
Database type The type of database engine that is used to create the Profile Database - MSSQL. Management Database Links Profile Database to the Management Database. If you collect data from only SiteScope, no Management Database needs to be selected. Domains Select the domains for which you want to enable data collection.
You must select the domains from which you want to enable data collection. If you have skipped topology configuration during post-install configuration and installed the content packs, you must return here to select from among the following domains to enable data collection.
- Operations Manager
- OBM
- RUM
- BPM
- Service Health
Database instance System Identifier (SID) of the Profile Database instance.
For information about the database host name, port number, and SID, contact your Business Service Management administrator.
Windows Authentication If you have selected MSSQL as the database type, you have the option to enable Windows authentication for MSSQL, that is, the user can use the same credentials to access SQL Server as that of the Windows system hosting the database.
This option is not supported if OBR server is installed on Linux Operating System.
Database name Name of the database. This field appears only if MSSQL is selected as the database type. User name Name of the Profile Database user, which was specified in the BSM Configuration Wizard when setting up the Profile Database.
If the Windows Authentication option is selected, this field is disabled.
Password Password of the Profile Database user, which was specified in the BSM Configuration Wizard when setting up the Profile Database.
If the Windows Authentication option is selected, this field is disabled.
Collection Station This option is used for a collector installed on a remote system. -
Click OK.
- Click Test Connection to test the connection.
- Click Save to save the changes made on this page. A
Saved Successfullymessage appears in the Information message pane.
After you save the newly created Management database connection, OBR (local collector or remote collector) retrieves the Profile database information from the Management database data source and lists all the existing Profile database data sources under the Profile Database section of the page.
Data collection for the Profile database data source is enabled by default. In addition, the collection frequency is scheduled for every one hour.
In case of a Remote Collector, the collection station has to be selected from the Database type drop down box provided in the Profile Database section of the page.
Enable KPI Data Collection for Service Health CIs
KPIs are high-level indicators of a CI’s performance and availability. The KPI data pertaining to certain logical Service Health CIs, such as Business Service, Business Application, Business Process, and Host, are logged by default in the Profile database. OBR collects this data from the database for reporting.
However, the KPI data for other CI types are not automatically logged in the Profile database. To enable the logging of the KPI data for these CI types, you must configure the CIs in the BSM. For more information, see the Persistent Data and Historical Data section of the Business Service Management - Using Service Health guide. This document is available for the product, Application Performance Management (BAC), at the Software URL.
After installing OBM Event Content Packs, you must configure OBR to collect required data from various data collectors. The data collectors work internally within the OBR infrastructure to collect the data. Therefore, you cannot directly interface with these collectors. Instead, you can specify the data sources from where the collectors can collect the data through the Administration Console.
In OBM deployment scenario, SiteScope and Operations Agent monitors the physical and virtual nodes. When you configure data source in this scenario, choose Operations Agent and/or SiteScope as the data source.
If you install the OBM Content Pack, you must configure the OBM database connection for data collection. You can configure OBR to collect data from the following OBM data repositories:
-
Events database: The events database stores data obtained from OMi (9.x versions) data source.
-
Operations database: The operations database stores data obtained from OBM 10 (and later versions OBM) data source.
Before you create a new OBM data source connection, make sure that a data source connection for the Management database exists on the Management DB / Profile DB page, see Configuring the Management and Profile Database Data Source topic. This data connection is required to retrieve Assigned User/Group information for OBM, which is stored in the Management database.
If you have one or more OBM setups in your environment, you must configure the OBM data source that belongs to the BSM RTSM that was configured as the topology source.
To configure the OBM data source connections, follow these steps:
-
In the Administration Console, click Data Source Configuration > BSM/APM/OBM > Operations Database.
- Click Create New to create a new OBM data source connection. The Connection Parameters dialog box appears.
-
Specify or type the following values in the Connection Parameters dialog box:
For Oracle database:
Field Description Event
Operations
Select your data source. Database in Oracle RAC Enable this option to select the Database in Oracle RAC. Enable TLS Enable JDBC connection over TLS. This option is displayed when Database type selected is ORACLE. Truststore file Full path to the truststorepath. This option is displayed when Enable TLS is selected.Truststore Password The password to access the truststore. This option is displayed when Enable TLS is selected. Service name Name of the service. This option appears only if Database in Oracle RAC is selected.
ORA file name The ORA file that contains connection information to the Oracle Real Application Cluster. This option appears only if Database in Oracle RAC is selected. Host name IP address or FQDN of the Management Database server.
Not displayed when Database in Oracle RAC is selected.
Port Port number to query the Management Database server.
Not displayed when Database in Oracle RAC is selected.
Database type The type of database engine that is used to create the Management Database - Oracle.
Management Database Links Profile Database to the Management Database. If you collect data from only SiteScope, no Management Database needs to be selected. Database instance System Identifier (SID) of the Management Database instance.
Not displayed when Database in Oracle RAC is selected.
For information about the database host name, port number, and SID, contact your Business Service Management administrator.
User name Name of the OBM Database user, which was specified in the BSM Configuration Wizard when setting up the Profile Database.
If the Windows Authentication option is selected, this field is disabled.
Password Password of the OBM Database user, which was specified in the BSM Configuration Wizard when setting up the Profile Database.
If the Windows Authentication option is selected, this field is disabled.
Collection Station This option is used for a collector installed on a remote system. For MS SQL database:
Field Description Event
Operations
Select your data source. Database in Oracle RAC Clear this option. Host name IP address or FQDN of the Management Database server.
Port Port number to query the Management Database server.
Database type The type of database engine that is used to create the Management Database - MSSQL.
Management Database Links Profile Database to the Management Database. If you collect data from only SiteScope, no Management Database needs to be selected. Database instance System Identifier (SID) of the Management Database instance.
For information about the database host name, port number, and SID, contact your Business Service Management administrator.
Windows Authentication If you have selected MSSQL as the database type, you have the option to enable Windows authentication for MSSQL, that is, the user can use the same credentials to access SQL Server as that of the Windows system hosting the database.
This option is not supported if OBR server is installed on Linux Operating System.
Database name Name of the database. This field appears only if MSSQL is selected as the database type. User name Name of the OBM Database user, which was specified in the BSM Configuration Wizard when setting up the Profile Database.
If the Windows Authentication option is selected, this field is disabled.
Password Password of the OBM Database user, which was specified in the BSM Configuration Wizard when setting up the Profile Database.
If the Windows Authentication option is selected, this field is disabled.
Collection Station This option is used for a collector installed on a remote system. For PostgreSQL database:
Field Description Event
Operations
Select your data source. Database in Oracle RAC Clear this option. Host name IP address or FQDN of the Management Database server.
Port Port number to query the Management Database server.
Database type The type of database engine that is used to create the Management Database . For Operations database - PostgreSQL.
Management Database Links Profile Database to the Management Database. If you collect data from only SiteScope, no Management Database needs to be selected. Database name Name of the database. This field appears only if MSSQL is selected as the database type. User name Name of the OBM Database user, which was specified in the BSM Configuration Wizard when setting up the Profile Database.
If the Windows Authentication option is selected, this field is disabled.
Password Password of the OBM Database user, which was specified in the BSM Configuration Wizard when setting up the Profile Database.
If the Windows Authentication option is selected, this field is disabled.
Collection Station This option is used for a collector installed on a remote system. -
Click OK.
You can create only one OBM data source connection. After the connection is created, the Create New button is disabled by default. Make sure that you type in the correct values.
- Click Test Connection to test the connection.
- Click Save to save the changes. A
Saved Successfullymessage appears in the Information message panel. - To change the OBM data collection schedule for one or more hosts, in the Schedule Frequency column, specify a collection time between 1 and 24 hours in the Hrs box.
- Click Save to save the changes. A
Saved Successfullymessage appears in the Information message panel.
Points to note:
- After upgrading to the OBM 10.x content pack, the K_Event_PropertyChanges and R_Event_propertyChanges tables are retained to store the History of Event Property changes. The Event property change history will be captured within the K_Event_HistoryLine and R_Event_HistoryLine tables in compressed xml format. Based on these tables any custom extensions can be designed.
- For OMi versions till 9.x, the Initiated by ID metric from OMi event database is stored in the InitiatedByID column of K_Event_Ext table. In OMi 10.x and higher versions, the Initiated by ID metric from OBM event database is stored in the Event_temp2 [Event Temporary column2 ] column of K_Event_Ext table.
OBM-Management Packs Integration
This integration helps to generate Enterprise Application Management reports related to enterprise applications like Oracle WebLogic, IBM WebSphere, Microsoft Active Directory, Microsoft Exchange Server, Microsoft SQL Server and Oracle. OBR integrates and collects historical and ongoing performance metrics from the OBM Management Packs.
Complete the following tasks on the OBR server to Integrate OBM and OBR:
To collect data for OBM, follow these steps on the OBR Administration Console:
-
In Data Source Selection, select Operations Bridge Manager (OBM).
-
In Operations Bridge Manager (OBM), select the version of the application deployed in your environment.
-
(Optional). You may select SiteScope for system performance, Operations Agent and VMware vCenter data source for the virtual environment
- Click Next
Based on the data sources selected in OBR Administration Console, the content types will be listed in the Data Source Selection Wizard > Content Type Selection page.
Follow these steps to select the content type according to your data sources:
- In Data Source Selection Wizard > Content Type Selection > Operations Bridge Manager (OBM), select the required Content Type.
-
(Optional).
- If you select SiteScope for system performance, then SiteScope Metric Channel section appears.
- You must select either Profile DB or Direct API as the metric channel for SiteScope.
In the Content Pack Deployment page, components for Direct API are selected automatically if the option is selected in the Configuration Wizard.
If SiteScope is used to monitor system or virtual environment performance in OBM, the metric channel for SiteScope is through Direct API.
The OBR Administration Console Data Source Selection Wizard > OBM Management Packs/OM SPIs Selection tab displays the selection options only when Enterprise application performance is selected in Content Type Selection tab.
Perform the following steps for each of the deployment scenario:
1. In Data Source Selection Wizard > OBM Management Packs/OM SPIs Selection, select Management Pack and/or Smart Plug-In(SPi).
You must make sure that necessary Management Pack and/or Smart Plug-In (SPi) policies are installed.
2. Click Next.
- To configure RTSM topology source, follow these steps on the OBR Administration Console > Data Source Configuration > Topology Source page.
- Click Create New. The Connection Parameter appears.
-
In the Connection Parameter, type the following details:
Field Description Host name
IP address or FQDN of the APM or OBM server. If your OBM installation is distributed, type the name of the gateway server in the field.
In a distributed OBM deployment with multiple gateway servers and load balancer configured, type the virtual IP address of the load balancer in this field.
Port
Port number to query the RTSM web service. The default port number is 80.
Set the port to 443 when RTSM is HTTPS enabled.
If the port number has been changed, contact your OBM administrator for more information.
User name Name of the RTSM web service user. The default user name is admin.
You can use the user with only RTSMOpenApiUser role assigned to it.
Password Password of the RTSM web service user.
Collection station If you installed collectors on remote systems, you can choose either the local collector or a remote collector.
To configure a remote collector to collect data from this RTSM source, select one of the available remote systems in the drop down list.
To use the collector that was installed by default on the OBR system, select local.
- Click OK.
- Click Save to save the information.
-
Click Test Connection. A success message appears in the information message panel.
You can configure additional RTSM data sources by repeating the same steps.
If the Test Connection fails, check the
{PMDB_HOME}/log/remotepoller.logfor more information. - Click Next. The Content Type Selection page appears.
In case of remote collector, follow the same configuration steps on the system where remote collector is installed.
If RTSM is HTTPS enabled, follow these steps:
-
Set the port to 443 when RTSM is HTTPS enabled during topology source configuration.
-
Export the OBM root CA certificate. You can use the
opr-cert-mgmtcommand-line interface to get certificates.For example:
./opr-cert-mgmt.sh ‑export "OBM Webserver CA Certificate" JKS "test" "/tmp/test.jks"For more information about the options that OBM provides to get the certificates, see OBM Documentation.
If FIPS is enabled, export the certificate in PKCS12 format, else export in PEM format.
-
Import the BSM/OBM root CA certificate into OBR server trust store. To import the CA certificates, follow these steps:
-
On Windows
keytool -import -trustcacerts -keystore <Path to store> -file "<filename with path>" -
On Linux
keytool -import -trustcacerts -keystore <Path to store> -file "<filename with path>"where,
<filename with path>is the location and file name of the OBM CA certificates.<
Path to store> is the path to the trust store. You have to mention the same path in the collection service.
-
-
On the collector system chosen in above configuration, add the following fields in
config.prp, located at%PMDB_HOME%\data(on Windows)$PMDB_HOME/data(on Linux):Field
Value
ucmdb.protocolhttpsYou must make sure to add
ucmdb.protocolvalue in{PMDB_HOME}/data/config.prpfile on the OBR server.shr.truststorepathFull path to the keystore file. The path is in the format: C:\HPE-OBR\PMDB\keystore\SHR_CERT_HTTPS.jksNote: You may use the OBR keystore path OR you may create a new keystore.
shr.truststorepasswordPassword of the keystore shr.truststoretypeType of the trust store - JKS or PKCS12 -
Follow these steps to add the entries in collection service scripts:
-
On Windows
- Open the Services window, right-click the HPE_PMDB_Platform_Collection service, and then click Stop.
-
Add
-Djavax.net.ssl.trustStore=<Path to store> -Djavax.net.ssl.trustStorePassword=<password>to JVM_ARGS in%PMDB_HOME%\bin\CollectionServiceCreation.batfile.where, <
Path to store> is the path to the trust store. Example:C:\OBR\PMDB\keystore\SHR_CERT_HTTPS.jksImportant If OBR is upgraded from the 10.2x version to 10.3x version, with HTTPs configured RTSM, make sure to update the <
Path to store> and <password> in the%PMDB_HOME%\bin\CollectionServiceCreation.batfile. -
Recreate the collection service, follow these steps:
-
Open the command line console, run the following commands:
CollectionServiceCreation.bat -remove <OV Install Directory> <Product Install Directory>CollectionServiceCreation.bat -install <OV Install Directory> <Product Install Directory>where,
<OV Install Directory>is%OVInstallDir%<Product Install Directory>is%PMDB_HOME%\..
-
- Open the Services window, right-click the HPE_PMDB_Platform_Collection service, and then click Start.
-
On Linux
-
Go to
/etc/init.ddirectory, and run the following command:On RHEL 6.x/SLES 11.x:
service HPE_PMDB_Platform_Collection stopOn RHEL 7.x/SLES 12.x/OEL:
systemctl stop HPE_PMDB_Platform_Collection.service -
Add
-Djavax.net.ssl.trustStore=<Path to store> -Djavax.net.ssl.trustStorePassword=<password>to JVM_ARGS in$PMDB_HOME/bin/hpbsm_pmdb_collector_start.shfiles.where, <
Path to store> is the path to the trust store.If OBR is upgraded from the 10.2x version to 10.3x version, with HTTPs configured RTSM, make sure to update the <
Path to store> and <password> in the$PMDB_HOME/bin/hpbsm_pmdb_collector_start.shfile. -
Go to
/etc/init.ddirectory, and run the following command:On RHEL 6.x/SLES 11.x:
service HPE_PMDB_Platform_Collection startOn RHEL 7.x/SLES 12.x/OEL:
systemctl start HPE_PMDB_Platform_Collection.service
-
-
-
Stop and start the HPE_PMDB_Platform_Administration service as follows:
On Windows:
- Open the Services window, right-click the HPE_PMDB_Platform_Administration service, and then click Stop.
- Wait for the service to stop.
- Open the Services window, right-click the HPE_PMDB_Platform_Administration service, and then click Start.
On Linux:
-
Go to the
/etc/init.ddirectory, and run the following command:On RHEL 6.x/SLES 11.x:
service HPE_PMDB_Platform_Administration stopOn RHEL 7.x/SLES 12.x/OEL:
systemctl stop HPE_PMDB_Platform_Administration.service -
Wait for the service to stop and then run the following command:
On RHEL 6.x/SLES 11.x:
service HPE_PMDB_Platform_Administration startOn RHEL 7.x/SLES 12.x/OEL:
systemctl start HPE_PMDB_Platform_Administration.service
For installing the required Content Packs, OBR provides the Content Pack Deployment page through the Administration Console. This web-based interface simplifies the process of installation by organizing the Content Packs based on the domain, the data source applications from where you want to collect data, and the specific Content Pack components you want to install to collect the data.
Before you begin installing Content Packs, make sure that:
- Post-installation is complete
- Data source selections are complete
- In a distributed scenario, if OBR is installed on Windows, irrespective of BO installed on Windows or Linux or on the same system or different system, you must configure DSN on OBR system (installed on Windows) to connect to Vertica database. If OBR is installed on Linux then installer automatically handles the DSN configuration and connection to Vertica database. To configure DSN, see Configuring DSN on Windows for Vertica Database topic in OBR Documentation. To install Content Packs on Windows Operating System, make sure that UAC is disabled on the system.
Use the Content Pack Deployment page in the Administration Console to install the Content Pack components.
The Content Packs already selected in the Content Pack Deployment page may be mutually exclusive. For information on Content Packs that are mutually exclusive, see Listing of ETLs topic in OBR Documentation.
To install the Content Packs, follow these steps:
-
To log on to Administration Console, follow these steps:
-
Launch the following URL:
https://<OBR_Server_FQDN>:21412/OBRApp
where,
<OBR_Server_FQDN>is the fully qualified domain name of the system where OBR is installed. -
Type administrator in the Login Name field and password in the Password field. Click Log In to continue. The Home page appears.
If you use any other user account to access the Administration Console, make sure that the user account has administrator privileges.
-
-
On the left pane, click Content Pack Deployment. The Content Pack Deployment page appears.
The Content Pack Deployment displays the Content Pack components that can be installed in the supported deployment scenario. You can modify the selection by clearing the selected content, the data source application, or the Content Pack components from the list.
While you clear the components of the selected Content Pack that you do not want to install, make sure that you clear the dependent components of the Content Pack.
The following table lists the content that is specific to each deployment scenario:
List of Content Packs
Content
OBM
Default
ü
Cross-Domain Operations Events
ü
Health and Key Performance Indicators
ü
IBM WebSphere Application Server
ü
Microsoft Active Directory
ü
Microsoft Exchange Server
ü
Microsoft SQL Server
ü
MSAppCore ü
Network Performance*
ü
Network Component Health ü
Network Interface Health ü
Operations Events
ü
Oracle
ü
Oracle WebLogic Server
ü
Real User Transaction Monitoring
ü
Synthetic Transaction Monitoring
ü
System Performance
ü
Virtual Environment Performance
ü
Make the following selections to generate the reports:
IBM WebSphere
- IBMWebSphere_ETL_WebSphereMP - Use IBMWebSphere_ETL_WebSphereMP to gather data from OBM Management Pack for WebSphere.
- IBMWebSphere_Domain
- IBMWebSphere_Reports
Install the following dependent Content Packs (and their components) along with this Content Pack for it to function:
- Core
- Core_Domain
- Core_Domain_AppServer
- Operations Manager
- OprEvent_Domain_Reports
- System Performance
- SysPerf_Domain
Microsoft Active Directory
-
MicrosoftActiveDirectory_ETL_ADSPI
-
MicrosoftActiveDirectory_Domain
-
MicrosoftActiveDirectory_Reports
Install the following dependent Content Packs (and their components) along with this Content Pack for it to function:
-
Core
-
Core_Domain
-
MSAppCore
Microsoft Exchange
For Microsoft Exchange 2010
- Operations Smart Plug-in for Microsoft Exchange 2010, OBM Management Pack for Microsoft Exchange Server
- MicrosoftExchange_ETL_ExchangeSPI2010
- MicrosoftExchange_Domain
- MicrosoftExchange_Reports
- For Microsoft Exchange 2013
- Operations Smart Plug-in for Microsoft Exchange 2013, OBM Management Pack for Microsoft Exchange Server
- MicrosoftExchange_ETL_ExchangeSPI2013
- MicrosoftExchange_Domain
- MicrosoftExchange_Reports
Install the following dependent Content Packs (and their components) along with this Content Pack for it to function:
- Core
- Core_Domain
- MSAppCore
- System Performance
- SysPerf_Domain
- SysPerf_Reports
Microsoft SQL Server
-
MicrosoftSQLServer_ETL_ADSPI
-
MicrosoftSQLServer_Domain
-
MicrosoftSQLServer_Reports
Install the following dependent Content Packs (and their components) along with this Content Pack for it to function:
-
Core
-
Core_Domain
-
MSAppCore
Oracle
- Oracle_ETL_DBSPI
- Oracle_Domain
- Oracle_Reports
Install the following dependent Content Packs (and their components) along with this Content Pack for it to function:
- Core
- Core_Domain
- Operations Manager
- OprEvent_Domain_Reports
- System Performance
- SysPerf_Domain
Oracle Weblogic
- OracleWebLogic_ETL_WebLogicMP - Use OracleWebLogic_ETL_WebLogic_MP to gather data from OBM Management Pack for WebLogic.
- OracleWebLogic_Domain
- OracleWebLogic_Reports
Install the following dependent Content Packs (and their components) along with this Content Pack for it to function:
- Core
- Core_Domain
Core_Domain_AppServer
- Operations Manager
- OprEvent_Domain_Reports
- System Performance
- SysPerf_Domain
The dependent domain content pack get selected automatically, you have to select only the ETLs based on the topology source.
For more information about the applicable OBM Management Packs, see OBR Documentation.
-
Click Install / Upgrade to install the Content Packs.
An Installation Started status appears in the Status column for Content Pack that is currently being installed. The Content Pack Deployment page automatically refreshes itself to display the updated status. Once the installation completes, an Installation Successful status appears. If the installation fails, an Installation Failed status appears.
The HPE_PMDB_Platform_Orchestration and the Timer service will be stopped automatically during Content Pack(s) install/uninstall operation and will be started once operation is complete.
During install/uninstall process, Content Pack Deployment page does not allow you to interrupt the process. Instead, you must wait till the current process is complete before you can perform any other operations on the Content Pack Deployment page.
After installing Content Packs, you must configure OBR to collect required data from various data collectors. The data collectors work internally within the OBR infrastructure to collect the data. Therefore, you cannot directly interface with these collectors. Instead, you can specify the data sources from where the collectors can collect the data through the Administration Console.
In the RTSM deployment scenario, you do not have to create new Operations Agent data source connections. Because, by default, all the nodes on which Operations Agent is installed are automatically discovered when the topology information is collected. These data sources or nodes are listed in the Operations Agent Data Source page of the Administration Console.
To configure the OBM data source connections, follow these steps:
-
In the Administration Console, click Data Source Configuration > Operations Agent.
-
To view detailed information about the Operations Agent data sources, click the Domain name or the number in the Host collection status summary table. The Hosts : <selected host name> table appears.
-
To change the data collection schedule for one or more hosts, specify a polling time between 1 and 24 hours in the Hrs box in the Collection frequency column.
- Click Save to save the changes. A
Saved Successfullymessage appears in the Information message panel.
Integrating OBM Dashboard with OBR Reports
This section provides information about integrating OBR with other monitoring solutions to simplify and enhance the experience of launching and viewing OBR reports.
You can launch OBR reports in the context of a Configuration Item (CI) or Business View from the OBM Dashboard user interface.
Integrating OBR with OBM Dashboard enriches the component gallery and provides a convenient way to view all the OBM and OBR reports in one place, without launching OBR.
Integrating OBM with OBR
Follow these steps to enable global ID onOBM system:
-
On your OBM system, change the Global ID Generator settings from the JMX Console using the following link:
http://localhost:21212/jmx-console/To access the JMX Console on Linux using the CLI, see OBM Documentation.
-
Click UCMDB:service=Multiple CMDB Instances Services.
The UCMDB:service=Multiple CMDB Instances Services page appears.
Figure 1.1 UCMDB:service=Multiple CMDB Instances Services page
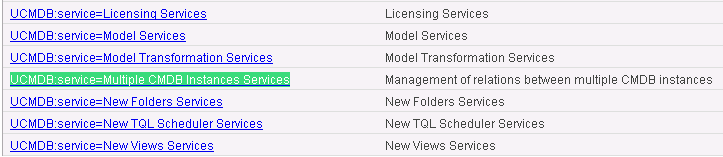
-
Click setAsGlobalIdGenerator.
Figure 1.1 (a) SetAsGlobalIdGenerator
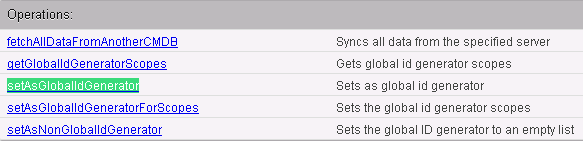
-
Type 1 as the value for customerID and dbTimeout .
Figure 1.1 (b) SetAsGlobalIdGenerator
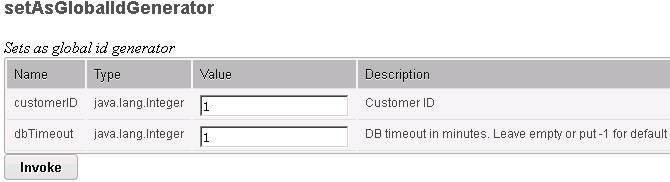
-
Click Invoke.
Figure 1.1 (c) SetAsGlobalIdGenerator
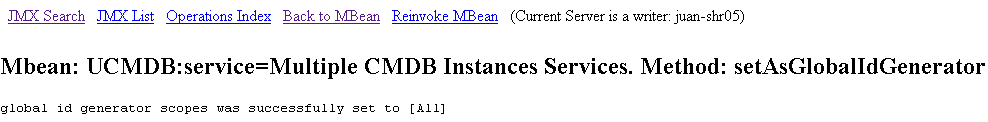
OBM is set as the Global ID Generator.
Create a user account in OBM with permissions to create and view pages in OBM Dashboard . The same OBM user name needs to be created as a user in OBR with permissions to view OBR reports.
In this document, an existing OBM user account admin is used as an example user.
OBR uses SAP BusinessObjects for user management. To create a user in OBR, perform the following steps:
If you are using LDAP user, do not perform the steps 1 to 6, continue from step 7. For more information on LDAP user configurations, see Configure LDAP Authentication for OBR topic in OBR Documentation.
-
Log on to SAP BusinessObjects Central Management Console (CMC) using the following link as an administrator:
http://<System_FQDN>:8443/BOE/CMCwhere
<System_FQDN>is the fully qualified domain name of the system where SAP BusinessObjects is installed.Figure 3.1: Log on screen of SAP BusinessObjects Central Management Console
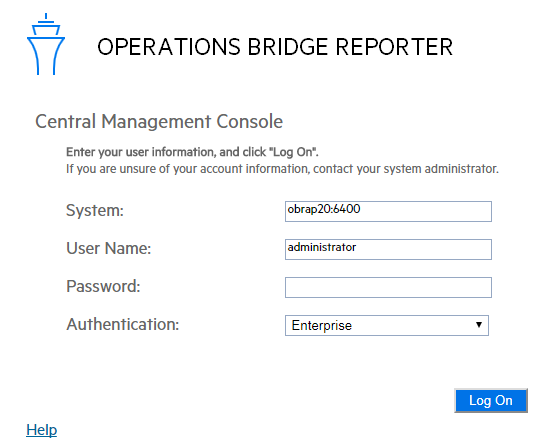
-
Select Users and Groups from the drop-down box.
Figure 3.2: CMC Users and Groups screen
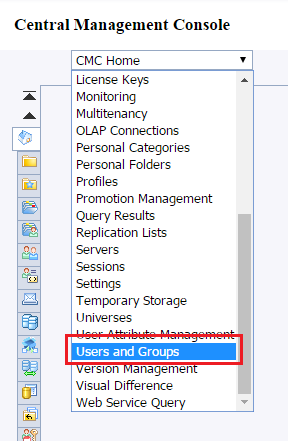
-
Select User List and click Create New User icon as shown in figure 1.3.
Figure 3.3: Creating a new user
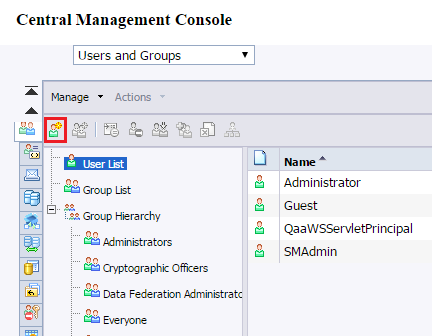
-
Enter the user details in the New User window as shown in figure 1.4 (a).
The SAP BusinessObjects username must be the same as the Account Name in OBM.
- Check Password never expires under Enterprise Password Settings.
-
Click Create & Close.
Figure 3.4(a): Create New User Screen
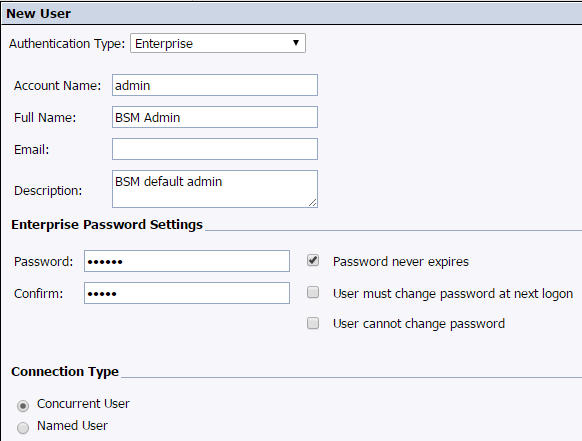
The newly created user appears in the User List as shown in the following figure:
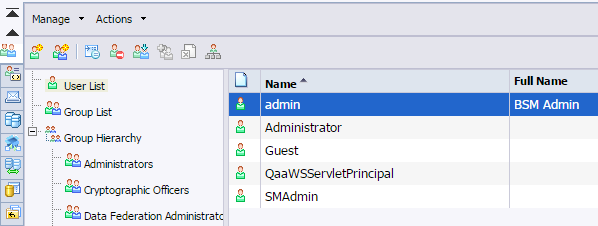
-
To add the OBM user to Administrator group, perform the following steps:
-
Select the user you created and click the Add member to user group icon as shown below.
Figure 3.5(a): Add a member
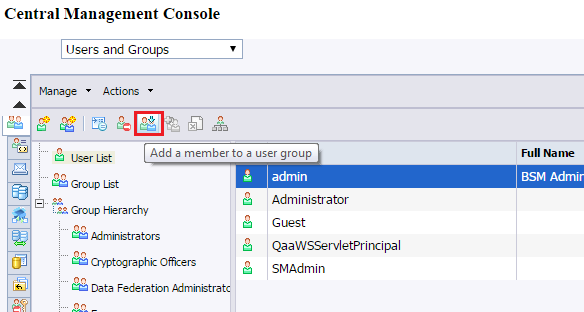
-
Right-click the username and click Join Group.
Figure 3.5(b): Join Group
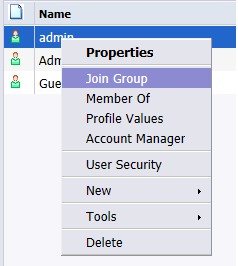
A pop-up window Join Group: <username> appears as shown in figure 2.5 (b).
-
To move Administrators from Available Groups to Destination Group(s), select Administrators, click >, then click OK as shown in figure 2.5 (b).
Figure 3.5(c): Join Group
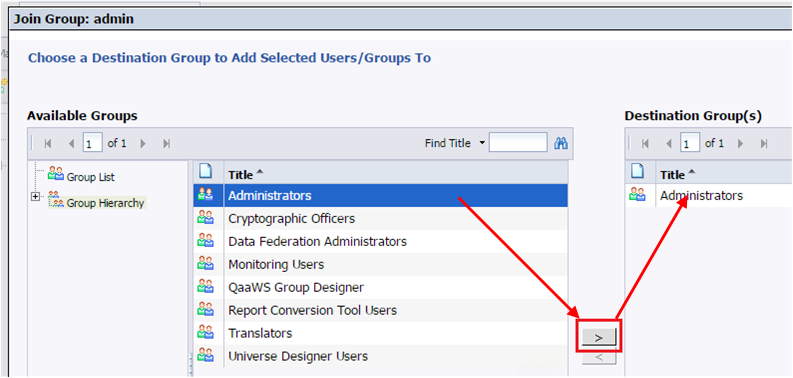
-
-
To verify User and Group configuration, perform the following steps:
- Double-click admin, the user you created from the list of users.
-
Select Member Of and check if Administrators is listed on the right side as shown in figure 2.6.
Figure 3.6: Member of a group
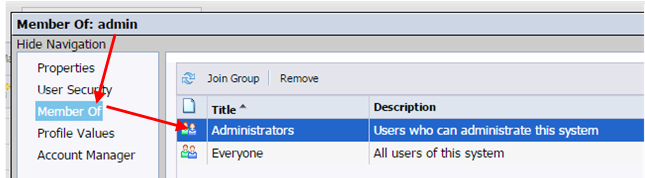
-
To ensure proper functioning of the Drill Up/Drill Down functionality in reports while accessing them from the OBM Dashboard console, you must set the user preferences as follows:
-
Log on to SAP BusinessObjects BI Launch pad with the user credentials created in CMC from the following link:
https://<Host_Name>:8443/BOE/BIwhere
<Host_Name>is the name of the server on which SAP BusinessObjects is installed.While logging on to the SAP BusinessObjects BI Launch pad for the first time, make sure to change the password.
-
Click Preferences in the upper right corner as shown in figure 1.7 (a).
Figure 3.7(a): Preferences
-
In the General tab, ensure that the default preferences are selected.
Figure 3.7(b): Preferences
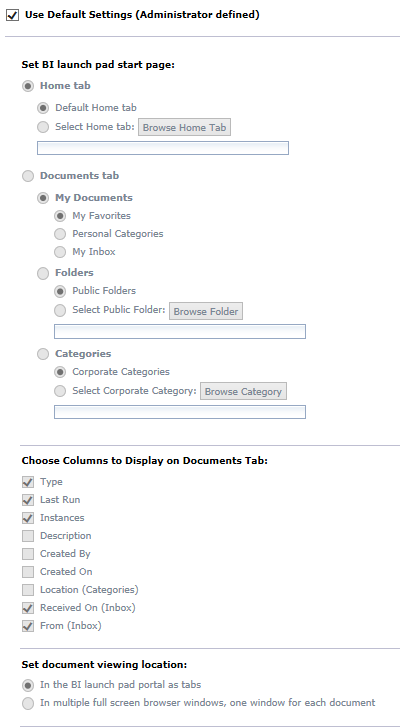
-
Click the Web Intelligence tab, and select the Synchronize drill on report blocks check-box.
Figure 3.7(c): Preferences
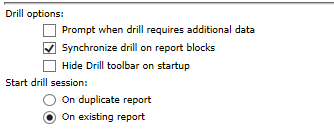
-
Using Lightweight Single Sign-on (LW-SSO), you can enable a OBM Dashboard user to access OBR reports with the same user credentials.
As SAP BusinessObjects is a third-party application, Single Sign-on (SSO) cannot be directly achieved with OBM using LW-SSO.
- For OBM Dashboard , SSO is setup first between the OBM and OBM using LW-SSO as explained in Configure OBR/OBM LW-SSO Authentication steps.
- Then, SSO is setup between the OBM and SAP BusinessObjects using SAP BusinessObjects Trusted Authentication as explained in Configure SAP BusinessObjects Trusted Authentication steps.
Before setting up LW-SSO, ensure that OBR is in Local Intranet zone on all clients accessing OBM and OBR. To do this, open Internet Explorer and go to Internet Options > Security. Click Local Intranet > Sites >Advanced and add OBR to the zone.
To configure LW-SSO, perform the following steps:
-
Copy the LW-SSO token from OBM:
- Log on to the OBM system as Administrator.
-
Navigate to Administration > Users > Authentication Management.
-
Copy the Token Creation Key (InitString) and note it down in a text file and click Configure.
The SSO Configuration Wizard appears.
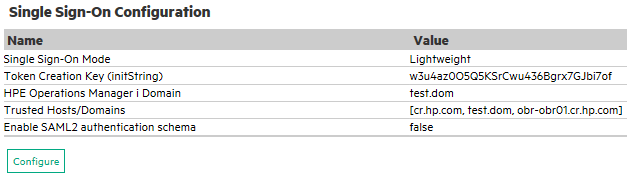
-
Click Single Sign-On.
Figure 3.2
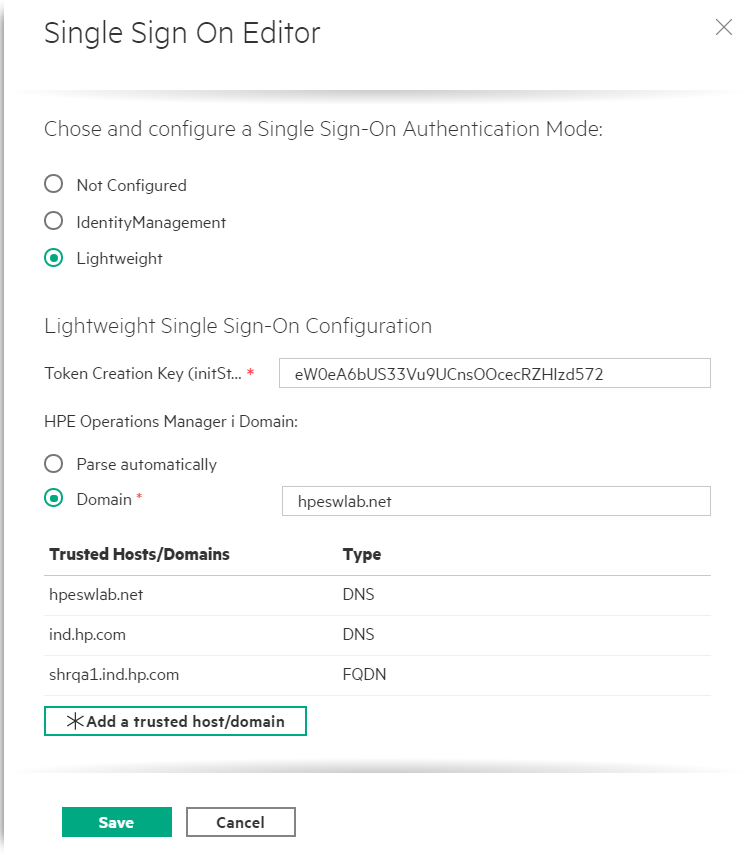
-
Under Trusted Hosts/Domains, add the OBM and OBM domain names.
If OBR and OBM are hosted on the same domain, it is enough to add the domain name once to the Trusted Hosts/Domains list.
- Uncheck the Enable SAML2 authentication schema check-box.
- Click Next, and then click Finish.
- Restart the OBM services for the authentication changes to take effect.
-
To configure LW-SSO in OBR, perform the following steps:
-
Log on to OBR Administration Console from the following link:
http://<OBR_Server_FQDN>:21411/OBRApp/where,
<OBR_Server_FQDN>is the name of the server on which OBR is installed. -
Go to Additional Configurations > Security in the left pane.
-
Click Security and the LW-SSO tab appears.
- Copy the values from the Token Creation Key (InitString) field in OBM (This is the InitString you have copied from OBM to a text file.) and paste them into the Init String field.
- Check the Enabled option.
- In the Domain field, enter the OBR domain.
- In the Expiration Period field, enter the recommended value of 60 minutes for LW-SSO configuration.
-
In the Protected Domains field, add the OBM domain name. Type the multiple protected domain names with comma separated without space.
- Even if OBRand OBM are hosted in the same domain, add the domain name to the Protected Domain field.
- Ensure
<PMDB_HOME>\PMDB\data\config.prp, bo.cmsis set to fully qualified doman name of the OBM system. -
In OBM integration with OBR, if OBM is https enabled, add/edit the following parameters to the
config.prpfile:admin.ssl=truebo.ssl=true
Restart the
HPE_PMDB_Platform_Administratorservice.
-
Click Save to save the configuration.
Figure 3.3
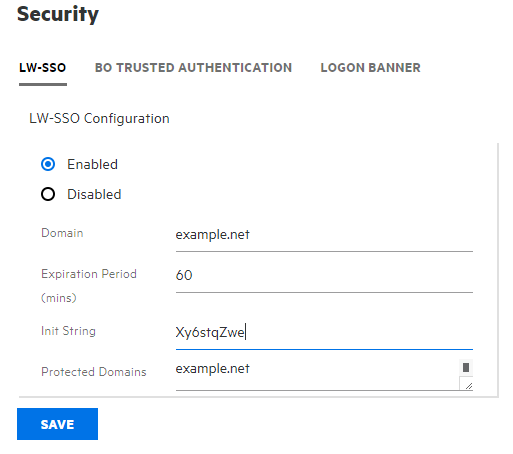
The following confirmation message appears:
LW-SSO Configuration saved successfully. Please restart the HPE_PMDB_Platform_Administrator' service for these changes to take effect
- Restart the HPE_PMDB_Platform_Administrator service from the Windows services list.
-
-
On OBR system, go to the following location:
On Windows:
%PMDB_HOME%\adminServer\webapps\OBRApp\WEB-INF\classesOn Linux:
cd $PMDB_HOME/adminServer/webapps/OBRApp/WEB-INF/classes -
Open
lwssofmconf.xmland add the following entries after</protectedDomains>:Figure 5: Add OBR and OBM FQDNs
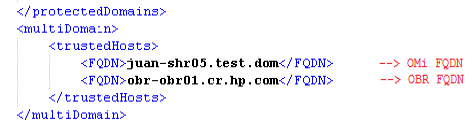
- Save the changes to the file.
- Restart the HPE_PMDB_Platform_Administrator service.
To setup SSO between the OBR Administration Console and SAP BusinessObjects, perform the following steps:
-
On the OBR Administration Console, go to Additional Configurations > Security > BO Trusted Authentication.
Figure 6.1
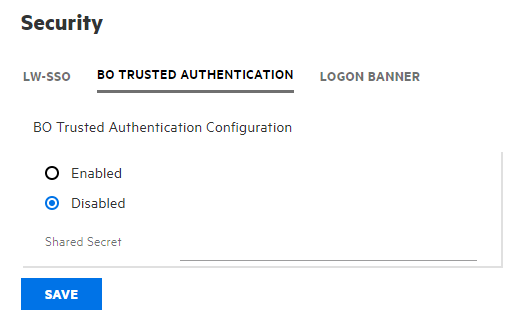
- Check the Enabled option.
-
Enter a string of your choice in the Shared Secret box.
SAP BusinessObjects Trusted Authentication works based on a shared secret mechanism between the OBR Administration Console and SAP BusinessObjects. The string you copied from OBR is the shared secret. This string is the same shared secret across OBM Administration Console and SAP BusinessObjects.
To verify if the same shared secret is also configured in SAP BusinessObjects, log on to SAP BusinessObjects CMC.
- Click Save to save the configuration.
-
Restart the HPE_PMDB_Platform_Administrator service from the Windows services list, to apply the changes made in Configure OMi 10 (OBM)/ LW-SSO Authentication and Configure SAP BusinessObjects Trusted Authentication steps.
On a Linux host, log on as a root user and run the following command:
service HPE_PMDB_Platform_Administrator stop/start
Disable ClickjackFilterSameOrigin on SAP BusinessObjects system
-
On your SAP BusinessObjects system, go to the following directory:
On Linux:
$PMDB_HOME/BOWebServer/webapps/BOE/WEB-INFOn Windows:
%PMDB_HOME%\BOWebServer\webapps\BOE\WEB-INF - Open the web.xml file.
-
Go to ClickjackFilterSameOrigin filter:
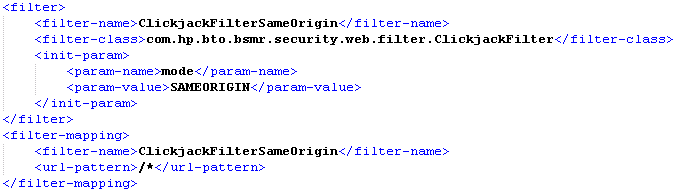
-
Comment the element as shown here:
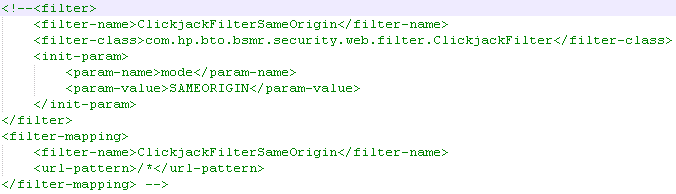
-
Restart the BusinessObjects service.
On Linux: SAPBOBJEnterpriseXI40
On Windows: Business Objects Webserver
- Wait for five minutes.
Generate the component XML file using the ComponentGenerator command on the OBR host and load it to the OBM host through a combination of manual copying and using the JMX Console.
Generate the report component XML file
Perform the following steps to generate the report component XML file:
- Log on to the OBR system.
- Open a command line window (for Windows) or a shell prompt (for Linux) .
-
Run the following commands to see the ComponentGenerator syntax:
For Windows:
%PMDB_HOME%\bin\ComponentGeneratorFor Linux:
$PMDB_HOME/bin/ComponentGeneratorFigure 8.1: (Windows)
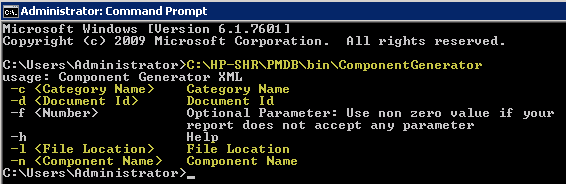
-
Run the following command to generate the XML file:
For Windows:
%PMDB_HOME%\bin\ ComponentGenerator –c <categoryName> -d <documentId > -n <componentName> -l <outputDir> -f <optional Parameter>For Linux:
$PMDB_HOME/bin/ ComponentGenerator.sh –c <categoryName> -d <documentId > -n <componentName> -l <outputDir> -f <optional Parameter>
- Category Name = This is the Category to be created in Component Gallery in OBM Dashboard
- Document Id = This is the report’s unique document ID – see the How to find the Document ID for a Report topic in OBR Documentation for more information.
- File Location = This is the directory where the component XML file will be created
- Component Name = The Component name to be created for the report in OBM Dashboard (note the use of quotes here)
-
Optional Parameter = Use non zero value if the report does not accept view or CIID as parameter.
The above command generates
<Component Category><componentName>.uim.xmlfile in on the Desktop.Example
The following is an example command for System Management Inventory:
%PMDB_HOME%\bin\ComponentGenerator -c OBR -d AfHfjvp01_pHrwWbfzGNaTY -l C:\Users\Administrator\Desktop -n "SM System Inventory"The command displays the following result:
Figure 8.2: SM System Inventory
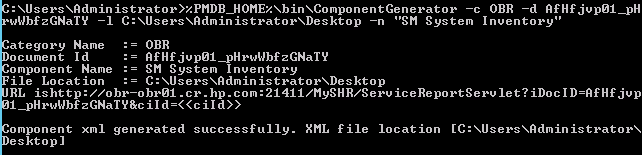
Perform the following steps to load the report component to OBM Dashboard :
-
From OBR system, copy the report component file
*.uim.xmlfile from OBR. -
On the OBM system, paste the component XML file at
%TOPAZ_HOME%\conf\uimashup\import\toload\Components.If OBM is deployed in a distributed environment, the XML file resides in the Gateway Server.
-
Load the XML (
*.uim.xml) file using the JMX Console.-
On the OBM system, log on to the OBM JMX Console using the following link:
http://localhost:29000/mbean?objectname=Foundations%3Aservice%3DUIMDataLoader
- Enter the credentials if prompted for the username and password.
-
Click service=UIMDataLoader link as shown in figure 4.4 (a) and navigate to JMX MBean View screen as per figure 4.4 (b)
Figure 9.1(a): JMX MBean View
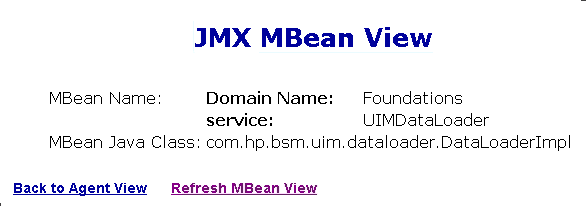
-
Go to the method named boolean loadComponentsGallery ()
Figure 9.1(b): Load Components Gallery
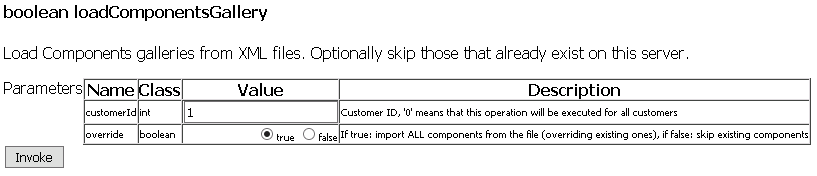
- Enter 1 as input value in the text field and select true.
-
Click Invoke to load the
*.uim.xmlfile.Figure 9.1(c): Load Components Gallery
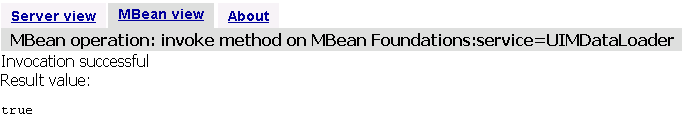
The component is visible on OBM system in the following location:
C:\HPBSM\conf\uimashup\import\toload\ComponentsAfter successful upload, the component is visible in the following location:
C:\HPBSM\conf\uimashup\import\loaded\Components -
-
To verify the availability of the component in OBM Dashboard console:
- Log on to the OBM user interface.
-
Click Workspaces > My Workspace > Component Gallery.
Figure 9.2: Components Gallery
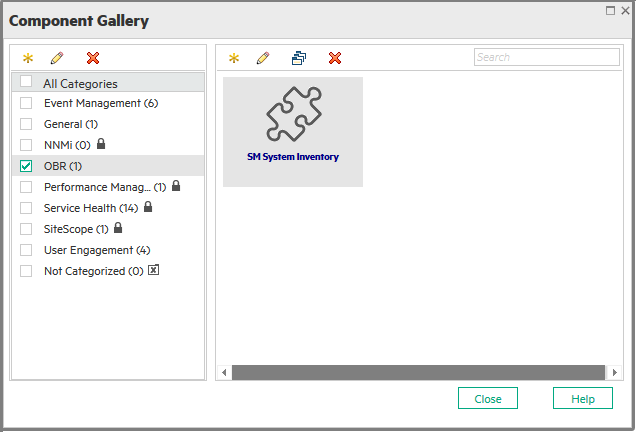
The component must be available within the category.
-
To verify the wiring, Click Wiring as shown in Figure 4.9.
By default, all reports are wired on CIChange and ViewChange event. If the report does not support any events, clear the check-box to disable the wiring.
Figure 9.3: Edit Component
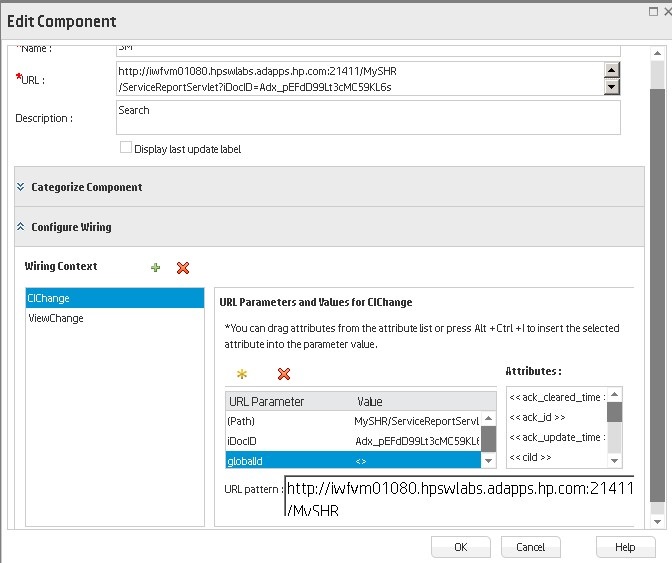
You must create a OBM Dashboard page and add the OBM report as a component in the page.
To create a OBM Dashboard page, perform the following steps:
-
On the OBM user interface, click New page.
Figure 10.1

-
Split the page as per the requirement.
Figure 10.2
- Click Components and drag-drop the components, such as View Explorer, to trigger the events.
-
Drag and drop the required OBR components.
The OBM report can be viewed in the OBM Dashboard page.
- Save the page to view it from the OBM Dashboard user interface.
If you get a certificate error as shown in the following image, import the certificate from your browser, and re-launch the browser.
In Internet Explorer, if your browser does not provide a save option for the import certificate settings, import the certificate every time you close or re-launch your browser.

Overview
Operations Orchestration (OO) provides a simple way for customers to run scripts for automated actions. The integration with OBM uses the OO capabilities for building investigation tools or service remediation scripts, providing the operations with a simple way to validate a problem, investigate it, or automatically correct it. A run book can be executed manually.
OO run books can be launched from the Service Health and Event Browser OBM components.
The integration of OBM and OO provides the capability of mapping CI types to OO run books.
After you create such mappings, you can run the mapped OO run books:
- On CIs, by using the Invoke Run Books context menu option. The OO run book parameters are populated by using the map to the CI attributes defined in the Run Book Mapping Configuration wizard. For detailed information about the wizard, see the OBM Administration Guide.
-
At the event level. OBM receives an event. The event must match the specified event filter and the event's related CI's CI type must be mapped to the run book.The OO run book parameters are populated by using the map to the CI or event attributes defined in the Run Book Mapping Configuration wizard. For detailed information about the wizard, see the OBM Administration Guide.
You can also manually execute a run book by selecting the option for a selected event in the Event Browser's event context panel.
In OO, the Restart a Node run book is associated with a Node CI Type. The parameters of the run book are mapped to the relevant CI attributes of the Node CI.
In Service Health, the operator detects that a host has a system problem. The operator right-clicks the CI to get a list of the run books relevant to the CI. One of the run books is Restart a Node. The run book can execute automatically because the values of the parameters such as the host name or the IP address are automatically populated by data taken from the CI context.
In the OBM Event Browser, the operator is going through the assigned events. The operator detects an event related to a lack of disk space that causes a database performance issue. From the event context, the operator can get a list of relevant run books. The operator can launch the appropriate run book manually. The run book continues running without further input from the operator as all run book parameters are extracted from the event or related CI.
Integration
Complete the following workflow to integrate OBM and OO.
-
Prerequisites
Before you configure the integration, the OO administrator needs to perform the following:
-
Enable user authentication and set up users as follows:
- Automatic run book execution: Create an internal user and assign the Administrator role.
-
Manual run book execution and run book mappings: Manually create internal users with the same user name in OO and OBM. The user name must have all lowercase letters. Assign the role required for running the flow in OO. Alternatively, configure LDAP. The configured LDAP system must be the same as in OBM and must be set as default. The role with the permissions required for running the flow in OO must be mapped to the LDAP group of the user.
-
Deploy the following OO Content Packs (CPs) on the OO server: Base, Middleware, and Operating Systems. For OO version 10.50 and higher, also deploy the Third-party content pack.
First deploy the Base CP, and then the other CPs.
For details on how to deploy CPs in OO, see the OO documentation.
Note If you have upgraded to a newer OO version, check if new OO CPs are available on ITOM Marketplace. If new CPs are available, download and deploy them.
-
If you want to configure run book automation in an OO setup up with a load balancer and a firewall, ensure that port 8443 is open. If port 8443 is not open, the automatic run book execution will fail. The Automatic Run Book execution is triggered from the data processing server.
-
-
Configure the link between OO and OBM
To configure the integration between OBM and OO, do the following:
-
In OBM, open the infrastructure settings:
Administration > Setup > Infrastructure Settings.
-
Select Foundations.
-
Select Integrations with other applications.
-
In the Operations Orchestration table, locate Operations Orchestration application server version. Make sure the Operations Orchestration application server version is set to OO 10.
-
Locate the Operations Orchestration application URL and specify the connection URL of OO using the following format:
<protocol>://<FQDN>:<portNumber>(for example,http://oo.example.com:8080). The port is8080forHTTP, or8443forHTTPS. -
To enable run books to be invoked automatically, enter the User Name and Password of the OO internal user you created as part of the prerequisites. For automatic run book execution, you must define the user as internal in OO and assign the Administrator role.
- To be able to invoke run books automatically, the user must be internal.
-
-
Configure LW-SSO authentication
You must configure LW-SSO in both OBM and OO. Do the following:
-
Make sure Single Sign-On for OBM is enabled (it is disabled by default). In OBM, open Authentication Management:
Administration > Users > Authentication Management
In the Single Sign-On Configuration section, click Edit to open the Single Sign on Editor panel. Select LightweightHPEIdentityManagement.
Copy the Token Creation Key (initString) to OO, and replace, in OO, all the initStrings in the lwssofmconf.xml file located in the <OO installation directory>\Program Files\Hewlett-Packard\Operations Orchestration\Central\conf\ directory.
-
In OO, in the web.xml and applicationContext.xml files located in the
<OO installation directory>\Program Files\Hewlett-Packard\
Operations Orchestration\Central\WEB-INF\ directory, enable all filters and mappings between LWSSO_SECTION_BEGIN and LWSSO_SECTION_END. -
If OO and OBM are in different domains in the Windows operating system, you must make sure that the Trusted Hosts/Domains parameter is the same in OO and OBM. To set the parameter in OBM, open Authentication Management:
Administration > Users > Authentication Management
In the Single Sign-On Configuration section, click Edit to open the Single Sign On Editor panel. Select Lightweight.
Configure the Trusted Hosts/Domains parameter in the field available when you select Domain
-
Restart the following OO services:
-
RSCentral
-
RSJRAS
-
RSScheduler
-
Note If you need to enable logging for debugging LW-SSO: In OO, in the <OO installation directory>\jetty\resources\log4j.properties file, uncomment the line that appears under the LW-SSO comment.
-
Make sure Single Sign-On for OBM is enabled (it is disabled by default). In OBM, open Authentication Management:
Administration > Users > Authentication Management
In the Single Sign-On Configuration section, click Edit to open the Single Sign on Editor panel. Select LightweightHPEIdentityManagement.
Copy the Token Creation Key (initString). Add the domain where your OBM and OO systems are located to the Trusted Hosts/Domains section. Click Save.
-
In OBM, open Authentication Management:
Administration > IdM Administration > System Settings
In the Single Sign-On Configuration section, copy the Token Creation Key (initString).
-
In OO, go to:
System Configuration > Security > SSO
System Workspace > Security > SSO
Administration > System Configuration > Authentication
-
Replace the value of the LW SSO passphrase or the InitString parameter with the Token Creation Key you copied from step b. (This must have the same value on all OBM instances that are integrated by using LW-SSO.)
-
Define domain-related parameters in the LW SSO Settings area:
- Domain. The domain of the OO server.
-
Protected Domains. List of comma-separated domains used by the OBM instances that employ LW-SSO.
Note If OO and OBM are in different domains in the Windows operating system, make sure that the Trusted Hosts/Domains (Protected Domains in OO) parameter is the same in OO and OBM.
In OBM, open Authentication Management:
Administration > Users > Authentication Management
In the Single Sign-On Configuration section, click Edit to open Single Sign On Editor panel. In the Single Sign On Editor panel, select Lightweight.
If OO and OBM are in the same DNS domain, no extra step is required. If OO and OBM are in different domains, add OO's DNS domain to OBM's Trusted Hosts/Domains, and add OBM's DNS domain to OO's Protected Domains.
Note Limitation with OO versions 10.22 and later and OBM
The OBM integration with the OO versions 10.22 and later is only supported if OO and OBM are in the same domain. If they are in different domains, the integration fails.
For more details on configuring LW-SSO in OO, see the OO documentation.
-
-
Export CA certificates from OO
If the OO server certificate was issued by a CA other than the OBM server CA, then obtain the CA root certificate, and any intermediate CA certificate from that certificate authority. If the OO server is using a self-signed certificate, then export the CA certificate from OO, and import it into OBM. Use the keytool utility, which is included in JRE.
-
On the OO server, enter:
-
Windows:
[<OO install folder>\java\bin\keytool.exe -keystore "<OO install folder>\central\var\security\key.store" -export -alias tomcat -file "<path>\<Operations Orchestration fully qualified host name>.cer"
-
Linux:
keytool -keystore "$ICONCLUDE_HOME/central/var/security/key.store" -export -alias tomcat -file "<path>/<Operations Orchestration fully qualified host name>.cer"
-
-
When prompted for a password, enter changeit.
-
-
Import CA certificate(s) to OBM
Import the server certificate(s) from the OO server to the OBM servers so that the two systems can communicate with each other securely.
You have to execute the following steps on all of your gateway servers, then on all of your data processing servers.
-
Import the CA Certificate(s) to OBM. To import the CA certificate(s) to the OBM trusted certificate store, execute the following command on one of the OBM servers (gateway or data processing server):
Enter the following commands:
<OBM_HOME>\bin\opr-cert-mgmt.[bat|sh] -import <alias> <path>
Note
You can use any string as long as it is not used as an alias. Do this for the Root CA, and all intermediate CAs (if any). For more information on the opr-cert-mgmt tool, see the OBM Develop.
-
Restart all OBM servers so that the trust is loaded in the truststore.
-
To prevent a certificate error, make sure that this certificate is imported as a trusted root certification authority on any browser that will be accessing OBM.
The procedure for importing the certificate may vary slightly depending on the type of browser that you are using. For example, if you are using Internet Explorer, follow these steps:
-
Click Tools > Internet Options > Content > Certificates.
-
In the Trusted Root Certification Authorities tab, click the Import... button.
- Click Next to start the Certificate Import Wizard.
- Specify the file you want to import, and then click Next.
-
Select the Place all certificates in the following store radio button, and then click Browse.
-
Select Trusted Root Certification Authorities, and then click Next.
-
Click Finish.
-
-
-
Import OO server certificates to OBM container
Import the server certificate from the OO server to the OBM container so that the two systems can communicate with each other securely.
-
Copy the OO server certificate to one of the master or worker nodes of Operations Bridge Suite using a file transfer tool.
-
Log on to that master or worker node of the Operations Bridge Suite.
-
Copy the OO server certificate to the OBM container:
kubectl cp <path to certificate>/<OO fully qualified domain name.cer> opsbridge1/omi-0:/tmp/<OO fully qualified domain name.cer> -c omiNote If you have OBM in an HA configuration, then execute this command in one OBM container only.
-
Import the OO server certificate to the OBM container key store:
kubectl exec omi-0 -ti bash -c omi -n opsbridge1su omiusercd /tmp/opt/HP/BSM/bin/opr-cert-mgmt.sh -import tomcat /tmp/<OO fully qualified domain name>.cerTo verify the import is successful, run the following command:
omiuser@omi-0:/> /opt/HP/BSM/bin/opr-cert-mgmt.sh -list
Restart OBM after importing the certificate:
To restart OBM:
kubectl -n <namespace> delete pod omi-0If you have a high availability setup, also delete the pod omi-1:
kubectl -n <namespace> delete pod omi-1Replace <namespace> with your suite deployment's namespace. The default is
opsbridge1Note If you have OBM in an HA configuration, then execute the commands in both containers.
-
-
Grant permissions
Grant permissions so that users can create, view, and modify the mapping between OBM CI types and OO run books, and can manually invoke run books from OBM. OBM uses the currently logged-in user for the configuration of run book mappings and automatic run book execution rules, and for manually executing run books.
In OBM, go to Administration > Users > Users, Groups, and Roles and configure users and permissions.
Assign the following permissions based on the user roles:
-
Manually executing OO run books within the context of an OBM event or CI:
Operations Console > Run Book Execution
-
Creating, viewing, and modifying the mapping between OBM CI types and OO run books:
Operations Console > Run Book Mappings
-
Configuring automatic run book execution rules:
Operations Console > Run Book Mappings
Event Processing > Automation > Automatice Run Book Execution
Additionally, assign the following Advanced RTSM permissions to each user role:
- Advanced RTSM Permissions > Resources (tab) > Resource Type > Queries permission
- Advanced RTSM Permissions > Resources (tab) > Resource Type > Views permission
- Advanced RTSM Permissions > General Actions (tab) > CI Related Actions permission
- Advanced RTSM Permissions > General Actions (tab) > Data Retrieval Actions permission
Note To execute run books automatically, no OBM user is required. It is sufficient to set up an internal OO user with the Administer role and then specify this user and the password in the OBM infrastructure settings. See the "Prerequisites" section for details.
When using LDAP in both OBM and OO:
- The configured LDAP system must be the same as in OO.
- The LDAP users must be set up in OBM (created either manually or automatically).
-
-
Map run books to CI Types
You can map OO run book parameters to:
-
CI type attributes. For details on the user interface, see the OBM Administration Guide.
The child CIs of a CI, for which you configure a run book, are also assigned to that run book.
Note To be able to map run books to CI types, either create a run book flow in OO, or import a content pack in OO with the Content Workspace.
-
The event attributes are predefined in OBM.
For details, see the OBM Administration Guide.
-
-
Use OO functionality from OBM
You can trigger a run book:
-
From Service Health by using the Invoke Run Books context menu option.
-
From the Event Browser by using the context menu or from the Action Panel.
-
Troubleshooting
Use the following information to troubleshoot problems with your OBM-OO integration.
The oo_integration.log file enables you to perform basic troubleshooting of problems with OO integration and run book execution.
For automatic run book execution, the oo_integration.log file is available on the data processing server:
<OBM_HOME>/log/opr-backend/oo_integration.log
Log configuration can be performed in:
<OBM_HOME>/conf/core/Tools/log4j/opr-backend/OOIntegration.properties
For setting up and configuring the OO integration, as well as manual run book execution, the log file is available on the gateway server:
<OBM_HOME>/log/jboss/oo_integration.log
Log configuration can be performed here:
<OBM_HOME>/conf/core/Tools/log4j/jboss/OOIntegration.properties
If you receive a remote connection error in the Run Book Mappings page, and no actions are available for new or existing run books, check the oo_integration.log file on your gateway system. Look for the following text:
Failure: User was not authenticated.
If you find this text, do the following:
- Check that the LWSSO integration is correctly configured between OBM and OO.
- Make sure that the logged in user exists in OO and has the correct permissions.
- Check that the configured integration user can authenticate against the OO system and has the correct permissions.
If you receive a connection error when you select run books in the Available Run Books pane (Library > Operations), change the run.book.timeout and service.center.ws.timeout settings from 10000 to 60000 (1 minute):
-
Open a JMX console on the OBM server:
https://localhost:29000 -
Select Foundations > service=Infrastructure Settings Manager.
-
To set the values, use setSettingValuePerCustomerId() with contextName: integrations and settingName: settings.pm.settings.run.book.timeout or settings.pm.settings.service.center.ws.timeout. Change to newValue: 60000.
Note Restarting OBM is not required.
If OBM and OO are in different domains, and you are using Internet Explorer as your browser, you may need to add the domains to the list of allowed domains in the Privacy tab (Internet Options > Privacy > Sites).
Overview
Important In the following sections, we will refer to the product as BSM, and to the integration of BSM 9.25 and later, and APM 9.309.409.50, with OBM as the APM Integration.
The Application Performance Management (APM) integration of BSM with OBM enables you to:
-
Integrate user interface components from separately deployed APM systems directly into the OBM's MyWorkspace pages. In this way, relevant information is shown directly within the OBM user interface, although this data comes from the BSM system.
-
Use the OBM embedded graphing component to show performance data stored within the Profile database of the BSM system.
-
Create a MyWorkspace page in OBM to drill down to detailed information about business transactions, business transaction flows, or location-based monitoring within BSM. For this purpose, OBM provides drill-down operations that allow to launch the BSM user interface in the context of a specific CI or event.
For information on supported versions, see the Integrations Catalog.
Each instance of the APM Integration is represented in OBM as a connected server. If you are integrating multiple BSMs, each one will be a separate connected server.
When you integrate BSM with OBM, there are a number of steps that occur behind the scenes:
-
Topology Synchronization. The first step of the integration involves pulling the topology of CIs from BSM into OBM. This can take some time, and in very large environments can take several hours.
The topology of domain-specific CIs such as Business Transactions (BTs) and Business Transaction Flows (BTFs) are not synchronized by default. Instead, we synchronize the Business Application CI which reflects any status changes to these CIs and any BT/BTF CIs that are related to it in BSM.
Note that the following procedure describes how to integrate BSM into OBM by using the default integration TQLs. If you have any topologies not covered by the out-of-the-box TQLs, create a custom integration TQL. The TQL needs to be defined on the BSM side. For information on how to create an integration TQL, see the Modeling Guide.
-
BSM Status Change Alert Creation. After the BSM topology is integrated into OBM, BSM status change alerts are created within BSM to generate events upon HI or KPI status change. Forwarding rules then define that these alerts will be sent to OBM. As a result, when a CI's status changes in BSM, an event is sent to OMi to update the CI's status.
-
Initial Status Synchronization. When setting up the APM-OBM integration, there is an initial status synchronization so that each CI in OBM receives the status it has in BSM. After the initial synchronization, whenever a CI's status changes in BSM, OBM receives a status change event. This event changes the CI's status in OBM, but the event is not displayed in the Event Console.
In general, when a KPI's status changes in BSM, the KPI changes status in OBM. In addition, if an HI's status changes on one of the CIs that we synchronized from BSM into OBM, this status change is reflected directly in OBM.
-
Downtime Synchronization. After the above steps are complete, you can synchronize downtimes, so that any downtimes defined in OBM will also apply to BSM. This includes the downtime CI, the CIs connected to the downtime, and the scheduling and action configurations (such as stopping monitoring, sending alerts and emails, and so on). In addition, OBM serves as the central downtime management location, so you can enable one time initial synchronization of BSM downtime to OBM, in order to help start managing all downtimes on the OBM side.
Integration
To integrate a BSM 9.25 (or later) deployment that has been upgraded from a running BSM 9.24 (or earlier), you must complete the following steps first.
If you integrate remotely, copy all the content packs to your computer and then point to the local location to deploy the package.
-
On your BSM server, check if uCMDB content pack 11.13.859 is installed. Access the JMX console on your primary DPS at the following location:
http://<DPS_FQDN>:21212/jmx-console/HtmlAdaptor?action=inspectMBean&name=UCMDB:service=Content Pack Services#displayCurrentContentPackVersionIf the console displays the current version of the installed content pack, continue with the next step. Otherwise, install the content pack by using the Package Manager as follows:
-
Navigate to Admin > RTSM Administration > Administration > Package Manager to open the RTSM Package Manager.
- Click
 Install Content Pack to open the Install Content Pack window.
 - Select
11*from Version and click Install to install the content pack version 11. Note that you will only see content packs that are available but not yet installed. Those that are installed, you will not see here.
-
-
On the BSM data processing server, import all the packages listed below. Note that you must import these .zip files, even if these files are already present on the BSM server:
BLE.zip
Business.zip
Diagnostics_New.zip
OMi_Integration.zip
Sitescope.zip
To get the TQLs from each zip file:
-
Navigate to Admin > RTSM Administration > Administration > Package Manager to open the RTSM Package Manager.
-
Click
to open the Deploy Packages to Server window and click  .
. -
Navigate to
<BSM_HOME>/odb/conf/factory_packages. -
Open the zip file, then click
<zip_name>.zipto see the list of resources. -
Click Deploy to deploy your resource and click OK in the box Resources have been deployed successfully.
To validate that these packages containing individual TQLs have been loaded correctly, you can look them up in the Modeling Studio. Navigate to:
-
Admin > RTSM Administration > Modeling > Modeling Studio
-
Select Resource Type: Queries. In the list, expand Root and scroll down to verify that
CIs_For_CIStatusChange_in_OMiis present. Next, expand Root > Integration > OMi_Integration to verify that the following packages are present:OMi_Sync_Biz
OMi_Sync_BPI
OMi_Sync_Diag_TV
OMi_Sync_SiS
OMi_Sync_SiS_EMS
-
-
On your BSM or APM deployment, proceed as follows to check whether OBM is configured for single sign-on configuration. First, read out the values from the JMX console to determine whether further steps are required:
-
For BSM version 9.25, open the JMX console on your BSM gateway server by typing in a web browser:
http://localhost:8080/jmx-console/HtmlAdaptor?action=inspectMBean&name=Foundations%3Aservice%3DInfrastructure+Settings+Manager -
For BSM 9.26APM 9.30APM 9.40APM 9.50, open the JMX console on your BSM gateway server by typing in a web browser:
http://localhost:29000Navigate to Foundations > Foundations: service=Infrastructure Settings Manager
-
Find the method java.lang.String getGlobalSettingValue().
-
Change contextName to
SingleSignOn. -
Change settingName to
lw.sso.configuration.xml. -
Click Invoke.
In the resulting output, search for the string
omi. If the stringomiis present twice, your deployment is configured correctly and no further steps are required. -
-
If the resulting output does not contain the string
omi, BSM is not yet correctly configured for integrating with OBM. In this case, you must append the necessary data:-
On your BSM Gateway Server, copy and paste the entire result output in a text editor and append the following URLs between the
<restURLs>and the</restURLs>tags:<url>.*/topaz.*/omi.*/integration.*</url>
<url>.*/topaz.*/acweb.*</url>
<url>.*/topaz.*/personalization.*</url>
<url>.*/topaz.*/bsmLight.*</url>
<url>.*/topaz.*/ldapContext.*</url>
<url>.*/topaz.*/bsmLight.*/BPM.*</url> -
Also append the following between the
<inbound>and</inbound>tag:<service service-pattern=".*/topaz.*/omi.*/integration.*" service-type="rest">
<in-lwsso refid="ID000001"/>
<in-custom classname="com.mercury.topaz.reportsExt.login.BsmLwSsoBasicAuthHandler"/>
<in-lwssoAutoCreate refid="ID000002"/>
</service> -
Copy the entire content from the two steps above.
-
Open the JMX console on your BSM gateway server by typing in a web browser, preferably Firefox:
http://localhost:290008080/jmx-console/HtmlAdaptor?action=inspectMBean&name=Foundations%3Aservice%3DInfrastructure+Settings+Manager -
Find the method void setGlobalSettingValue().
-
Change the contextName to SingleSignOn.
-
Change the settingName to lw.sso.configuration.xml.
-
Paste the new content into the Value field.
-
Click Invoke.
-
Restart the Mercury AS process.
Note In a distributed environment, you must manually establish a trust relationship between your BSM and OBM systems. Run the following command on the BSM data processing server:
<OBM_HOME>/opr/bin/BBCTrustServer.[bat|sh] <FQDN of OBM data processing server> -
-
Install the UCMDB Data Flow Probe
The UCMDB Data Flow Probe pulls data from BSM to OBM. To install the UCMDB Data Flow Probe for OBM:
-
Get the UCMDB Data Flow Probe installation bits from the OBM media kit. The UCMDB Data Flow Probe must be of the same version as the RTSM that OBM uses. The UCMDB Data Flow Probe can be installed on either the OBM gateway server or data processing server. For more details on the installation of the Data Flow Probe, see the Data Flow Probe ReadMe on the media kit.
-
Install the UCMDB Data Flow Probe according to the instructions in the UCMDB Data Flow Probe Installation Guide. Make sure:
-
HP BSM is selected as the application server.
-
The OBM gateway server or virtual server name is specified.
-
-
Set credentials so that the domain name appears in a drop-down list during configuration of the connected server:
-
Navigate to:
Administration > RTSM Administration > Data Flow Management > Data Flow Probe Setup
-
Select DefaultDomain(Default) and expand Credentials to go to Generic Protocol.
-
Click
New in the Generic Protocol pane to open the Generic Protocol Parameters wizard. -
Leave the default values in the General section.
-
Enter the user name and password of one of the following in the Generic section:
- BSM user who has SDK permission and is allowed to perform synchronizations
- BSM administrator
- Integration user
-
-
Set up TLS and root certificates
If you have hardened your OBM server, you must configure TLS in the Data Flow Probe and establish trust between the Data Flow Probe server and the OBM server.
-
Enable TLS in the DFP to connect to OBM:
-
Open
<DFP_HOME>/conf/DataFlowProbe.properties. -
Change the property
appilog.agent.probe.protocolfrom HTTP to HTTPS. -
Change the property
serverPortHttpsfrom 8443 to 443.
-
-
Establish trust between the DFP server and the OBM server:
-
Import the OBM server certificate into JRE’s trust store:
<UCMDB_HOME>/UCMDB/DataFlowProbe/bin/jre/bin/keytool -import -trustcacerts -file <CA cert>.pem -alias <ca cert alias> -keystore<UCMDB_HOME>/UCMDB/DataFlowProbe/bin/jre/lib/security/cacerts -
Import the BSM server certificate into JRE’s trust store:
<UCMDB_HOME>/UCMDB/DataFlowProbe/bin/jre/bin/keytool -import -trustcacerts -file <CA cert>.pem -alias <ca cert alias> -keystore<UCMDB_HOME>/UCMDB/DataFlowProbe/bin/jre/lib/security/cacerts
-
You must import the root certificate from your certification authority to the OBM and the BSM data processing servers and gateway servers.
-
On the OBM gateway and data processing servers, run the following command:
<OBM_HOME>/bin/opr-cert-mgmt.[bat|sh] -import <alias> <path> -
On the BSM gateway and data processing servers, run the following command:
<BSM_HOME>/JRE/bin/keytool -import -trustcacerts -file <Root Certificate of your Certificate Authority> -alias <any name> -keystore <BSM_HOME>/JRE/lib/security/cacerts -
Restart the OBM and BSM gateway and data processing servers.
-
-
Start the Data Flow Probe before integrating BSM, by using
<INSTALL_DIR>/UCMDB/DataFlowProbe/bin/gateway.bat|sh start.To see whether the UCMDB Data Flow Probe started successfully, check the following log file :
<INSTALL_DIR>/UCMDB/DataFlowProbe/runtime/log/WrapperProbeGw.logAllow approximately 10 minutes for this process to finish as the Data Flow Probe is uploading a large number of files from the RTSM.
-
Increase the RTSM timeout in these two places if network latency is likely:
Note The JMX Console can only be used remotely when its use is configured in BSM or OBM respectively. For information on how to configure your JMX Console remotely, see the OBM Administration Guide.
To log in the JMX Console, use the user name
sysadminand the passwordadmin.-
On your OBM deployment, open the RTSM JMX console in a web browser:
http://localhost:21212/jmx-console/.Click UCMDB:service=Settings Services.
Click setSettingValue.
For customerID, enter value 1.
For name, enter
task.DataAccess.Manager.getAdapterClassesConfig.timeOut.For value, enter the increased RTSM timeout in milliseconds (default is 20000).
-
Also, in the RTSM JMX console
http://localhost:21212/jmx-console/HtmlAdaptor,Click UCMDB:service=Settings Services.
Click setSettingValue.
For customerID, enter value 1.
For name, enter
configuration.remote.action.timeout.For value, enter the increased RTSM timeout in milliseconds (default is 35000).
-
-
-
Prepare the topology synchronization
Task 1: Create Integration Point in UCMDB for BSM
Create an integration point in the UCMDB for BSM:
-
In the UCMDB, go to:
Managers > Data Flow Management > Integration Studio
-
Click New Integration Point or Edit, enter a name and description of your choice, and select the adapter: UCMDB 10.x
-
Enter the following information for the adapter:
- Hostname/IP: <gateway server hostname>
- Port: < 80 or 443 depending on your protocol>
- Protocol: <communication protocol>
- Remote Machine State: Actual
- Push Back Ids For Population: Enabled
- CMDB State (Data Push): Actual
- Data Flow Probe: <DFP name>
- Specify the credentials for the user accessing the BSM system, and click Test Connection to see if you entered the correct information.
-
Click OK, then click the Save button above the list of the integration points.
Task 2: Create Integration Job to pull CIs from BSM
Next, create an integration job that will pull the CIs from BSM based on the TQLs specified:
-
Select the Integration Point you created in Step 1. Click the Population tab on the right pane, and click Create New.
-
Click
Add and go to Root > Integration > OMi_integration. -
Choose the following five TQLs (running order does not matter for this integration):
-
OMi_Sync_Biz -
OMi_Sync_BPI -
OMi_Sync_Diag_TV -
OMi_Sync_SiS -
OMi_Sync_SiS_EMS
-
- Select the check box Allow Integration Job to delete removed data.
- In the Scheduler Definition section, define the job schedule.
Task 3: Create Integration Point in UCMDB for OBM
Create an integration point in the UCMDB for OBM:
-
In the UCMDB, go to:
Managers > Data Flow Management > Integration Studio
-
Click New Integration Point or Edit, enter a name and description of your choice, and select the adapter: UCMDB 10.x
-
Enter the following information for the adapter:
- Hostname/IP: <gateway/LB server hostname>
- Port: < 80 or 443 depending on your protocol>
- Protocol: <communication protocol>
- Remote Machine State: Actual
- Push Back Ids for Population: Enabled
- Push Back Ids for Push: Disabled
- CMDB State (Data Push): Actual
- Data Flow Probe: CMDB
- Specify the credentials for the user accessing the OBM system.
-
Click OK, then click the Save button above the list of the integration points.
Task 4: Create Integration Job to Push CIs to OBM
Next, create an integration job that will push the CIs from the UCMDB to OBM based on the TQLs specified:
-
Select the Integration Point you created in Step 3. Click the Data Push tab on the right pane, and click Create New.
-
Based on the CIs you would like to push from the UCMDB to OBM, use an appropriate TQL. As a starting point, you can use
RTSMtoCMSSync.If you use the
RTSMtoCMSSyncTQL as a starting point, you must make sure that the correct attributes for your integration are synchronized. Right click any node and select Properties to bring up the Query Node Properties window. On the Element Layout tab, select Select attributes for layout. In the Conditions section, adjust the conditions in order to include the attributes you need. If you would like to include all attributes, set Attributes condition to All.
Task 5: Verify the Topology Synchronization
Run the integration jobs and verify the integration results in the UCMDB Manager.
-
-
Set up TLS and root certificates
If you have hardened your OBM server, you must configure TLS in the Data Flow Probe and establish trust between the Data Flow Probe server and the OBM server.
-
Enable TLS in the DFP to connect to OBM:
-
Open
<DFP_HOME>/conf/DataFlowProbe.properties. -
Change the property
appilog.agent.probe.protocolfrom HTTP to HTTPS. -
Change the property
serverPortHttpsfrom 8443 to 443.
-
-
Establish trust between the DFP server and the OBM server:
-
Import the OBM server certificate into JRE’s trust store:
<UCMDB_HOME>/UCMDB/DataFlowProbe/bin/jre/bin/keytool -import -trustcacerts -file <CA cert>.pem -alias <ca cert alias> -keystore<UCMDB_HOME>/UCMDB/DataFlowProbe/bin/jre/lib/security/cacerts -
Import the BSM server certificate into JRE’s trust store:
<UCMDB_HOME>/UCMDB/DataFlowProbe/bin/jre/bin/keytool -import -trustcacerts -file <CA cert>.pem -alias <ca cert alias> -keystore<UCMDB_HOME>/UCMDB/DataFlowProbe/bin/jre/lib/security/cacerts
-
-
Restart the DFP.
You must import the root certificate from your certification authority to the OBM and the BSM data processing servers and gateway servers.
-
On the OBM gateway and data processing servers, run the following command:
<OBM_HOME>/bin/opr-cert-mgmt.[bat|sh] -import <alias> <path> -
On the BSM gateway and data processing servers, run the following command:
<BSM_HOME>/JRE/bin/keytool -import -trustcacerts -file <Root Certificate of your Certificate Authority> -alias <any name> -keystore <BSM_HOME>/JRE/lib/security/cacerts -
Restart the OBM and BSM gateway and data processing servers.
-
-
Configure Lightweight Single Sign-On
Note If you use IDM SSO, you must temporarily switch to Lightweight Single Sign-On and restart OBM for the change to take effect, before proceeding with the integration. Once the integration is up and running, you can switch back to IDM SSO.
A limitation after switching back to IDM SSO:
- Once established, the data flow probe will store credentials in its cache and does not need LW SSO. However, if you want to change the credentials used by the data flow probe to connect to APM, or if the data flow probe cache is cleared, you must temporarily switch back to LW SSO and configure the data flow probe.
Aligning Lightweight Single Sign-On on both deployments enables you to view BSM components in the OBM user interface.
Set up Lightweight Single Sign-On (LW-SSO) and align
initStringon both systems. It is good practice that the product added to the existing environment gets the same key as the already existing deployments. For example, if OBM is added last, the key needs to be changed in OBM. If more than one BSM server is connected to the same OBM server, change the initString parameter on the BSM side.Note: LW-SSO will not work if TLS is enabled for one product but not the other. Make sure that the TLS setup is consistent between products before trying to configure LW-SSO.-
In OBM:
-
Navigate to Authentication Management:
Administration > Users > Authentication Management
-
In the Single Sign-On Configuration section, click
 Edit to open Single Sign On Editor panel.
 -
In the Single Sign On Editor panel, select Lightweight.
-
Copy the Token Creation Key (initString) value.
-
Click Save to save your configuration.
For details on configuring LW-SSO, see the OBM Administration Guide.
Note If you are using OBM 2018.05 and this is the first time you integrate the system with APM, you must disable useHTTPonly for the LWSSO cookie by running the following command on the gateway server:
Windows:
<OBM_Home>\opr\support>opr-jmxClient.bat -r -s localhost:4447 -b "Topaz:service=LW-SSO Configuration" -m setUseHTTPOnly -a falseLinux:
<OBM_Home>/opr/support>opr-jmxClient.sh -r -s localhost:4447 -b "Topaz:service=LW-SSO Configuration" -m setUseHTTPOnly -a falseThis is not required if you upgraded to OBM 2018.05 from a previous version and already had set up an integration with APM.
-
-
Perform the following in your BSMAPM deployment:
-
Navigate to the gateway server and open via browser http://localhost:29000/
-
Insert your credentials which you configured in the Configuration Server Wizard.
-
Search for Topaz:service=LW-SSO Configuration.
-
Paste the Token Creation Key (initString) value that you copied from OBM in the previous instructions.
-
Click Set to save your changes.
-
-
Optional.Create the integration user
In this step you will begin by creating your integration user in the BSM JMX console, and then configure the user by using the BSM user interface.
Note that an LDAP user must be used unless mixed mode is enabled. If mixed mode is enabled, local accounts can be used.
-
In your BSM deployment (DPS), go to the jmx console:
http://localhost:21212/jmx-console -
Select UCMDB:service=Security Services.
-
Go to createIntegrationUser() and create your integration user using the following values:
customerID: 1userName: <integration user name>password: <pwd>dataStoreOrigin: <any value> -
Click Invoke.
-
Invoke the getUsersList MBean with customerID=1 to check if the user is shown in the list of integration users.
-
In your BSM deployment go to Admin > Platform > User and Permissions > User Management.
-
Select Create New Users with the same user name and password as the integration user created previously.
-
Click the icon of the user you have just created.
-
Go to the tab Permissions tab.
-
Grant the Administrator role to your integration user.
-
Click Apply Permissions to finish.
Note You must wait at least ten minutes for the changes to take effect. You can define this in the following setting:
Navigate to: Admin > Platform > Setup and Maintenance > Infrastructure Settings
Select the context: Applications - Operations Management
Scroll to Operations Management - Topaz Authorization Service Settings
Click the edit button in the line Refresh Interval and enter 10 in the field Value in the Edit Setting dialog box.
Note Do not perform this step if you upgraded from BSM 9.2x and already created an integration user. It will be created automatically as part of the upgrade.
You can, optionally, create a dedicated user for integrations between other products (including OBM) and APM. This user enables a product that uses the APM client SDK to be authenticated in the server SDK and execute the APIs. Applications written with this API set must log on with integration user credentials.
-
In your APM deployment, open the RTSM JMX console in a web browser:
http://localhost:21212/jmx-console/ - Under
UCMDB, click service=UCMDB Authorization Services -
Locate the createUser operation. This method accepts the following parameters:
- customerId. The customer ID.
- username. The integration user's name.
- userDisplayName. The integration user's display name.
- userLoginName. The integration user's login name.
-
password. The integration user's password.
The password policy requires the password to include at least one one upper case, one lower case, one numeric, and one special character (
,/\:._?&%=+-[]()|).
Click Invoke.
-
In a single-tenant environment, locate the setRolesForUser method and enter the following parameters:
- userName. The integration user's name.
- roles. SuperAdmin.
Click Invoke.
-
Locate the setUserServerAdministratorValue method and enter the following parameters:
- customerID. The customer ID.
- userLoginName. The integration user's login name.
- serverAdministratorValue. Select True.
Click Invoke.
-
In a multi-tenant environment, locate the grantRolesToUserForAllTenants method and enter the following parameters to assign the role in connection with all tenants:
- userName. The integration user's name.
- roles. SuperAdmin.
Click Invoke.
Alternatively, to assign the role in connection with specific tenants, invoke the grantRolesToUserForTenants method, using the same user name and roles parameter values. For the tenantNames parameter, enter the required tenants.
-
Either create more users, or close the JMX console.
-
Log on to APM as an administrator.
-
Click Admin > RTSM Administration.
-
From the Administration tab, run Package Manager.
-
Click New.
-
Enter a name for the new package, and click Next.
-
In the Resource Selection tab, under Administration, click Users.
-
Select a user or users that you created by using the JMX console.
-
Click Next and then Finish. Your new package appears in the Package Name list in Package Manager.
The integration user is defined per customer. To create a stronger integration user for cross-customer usage, use a systemUser with the isSuperIntegrationUser flag set to true. Use the systemUser methods (createSystemUser, removeSystemUser, showAllSystemUsers, changeSystemUserPassword, canSuperIntegrationUserAuthenticate, and so on).
There are two out-of-the-box system users; we recommend to change their passwords after the installation by using the changeSystemUserPassword method.
- sysadmin/sysadmin
- UISysadmin/UISysadmin (this user is also the Super Integration User SuperIntegrationUser)
If you change the UISysadmin password by using changeSystemUserPassword, you must execute the following method: in the JMX console, locate the UCMDB-UI:name=UCMDB Integration service. Run setCMDBSuperIntegrationUser with the user name and new password of the integration user.
-
-
Set up an APM connected server in OBM and complete the integration
In the previous steps, you set up your environment to enable the APM Integration. In the following section, you will perform the integration. In this step, you enable the following:
-
Initiate event, status, and UI integration.
-
Initiate status and downtime synchronization.
To integrate the configuration items (CIs) that exist in BSM to OBM, perform the following steps:
-
Make sure port 383 is open in BSM.
-
On your OBM deployment, navigate to:
Administration > Setup and Maintenance > Connected Servers
-
In the central Connected Servers pane, click New and select APM. Alternatively, you can click New in the Application Performance Management (APM) area in the right pane.
The Create APM Server panel opens.
-
In the General section, enter a display label, an identifier (a unique internal name if you want to replace the automatically generated one), and, optionally, a description of the connection being specified.
-
In the Server Properties section, complete the following information:
-
Enter the fully qualified domain name of the Application User URL setting. To find this FQDN, follow these steps:
-
On your BSM deployment, navigate to Admin > Platform > Setup and Maintenance > Infrastructure Settings.
- Select Foundations and use the list to set the administration context to Platform Administration.
- Go to the Platform Administration - Host Configuration section.
- Copy the FQDN part of the URL in the Value field of the Default Virtual Gateway Server for Application Users URL entry. The FQDN part of the URL is the URL without
https://and<port number>. - Paste this FQDN part into the Fully qualified domain name field.
-
-
Enter the user name and password of your integration user.
-
Optional. If the URL path has changed, you must add the new URL, otherwise leave this field empty.
-
Enter the port number of the APM server. The default port value is automatically inserted and can be restored by clicking Set default port.
- Make sure the Use secure HTTP check box is selected if you are using secure communication (default).
-
Clear the Enable sending event updates to the APM server check box if you have BSM 9.2x without OBM being enabled, or APM 9.309.409.50.
-
-
In the Synchronization section, complete the following information:
Click the box on the left of Step 1: Topology:
-
If the Use OMi as Global ID Generator option is editable, select your desired global ID generator. Do not use OBM as Global ID Generator. If the Use OMi as Global ID Generator option is grayed out, a global ID generator already exists in your environment. In this case, proceed with selecting your Data Flow Probe.
-
Select the name of your Data Flow Probe from the drop-down list. Then specify the domain name that was used during the Data Flow Probe installation.
-
In Test Connection, click Run Test to see if the connected server was correctly set up.
-
Make sure that the Activate after save check box is selected if you want to enable the server connection immediately.
-
Click Create to start the topology synchronization and to create the APM integration point.
-
If you integrate BSM/APM CIs directly into the UCMDB, or integrate OBM with UCMDB, add
APM:<name_of_connected_server_in_OBM>:<dns_name_of_APM_server>to the monitored_by attribute of the CIs. This is required for Performance Dashboard to graph EUM data from BSM 9.2x. To modify the monitored_by attribute, integrate topology directly between BSMAPM and OBM.Note that Run Test fails because OBM tries to test a connection to port 383, which is not used in APM 9.30, 9.40, and 9.50 integrations. Ignore this error.
Verify the Integration
The previous procedure involves pulling the topology of the CIs from BSM into OBM. This can take some time, and in very large environments can take several hours.
The following section describes how to verify that the synchronization is complete, in order to continue with the integration setup.
-
On the OBM server, navigate to:
Administration > Setup and Maintenance > Connected Servers
-
Check the status of the last executed job in the pane to the right of your connected server. Wait until one integration job runs successfully before continuing. To update the status, click Refresh.
-
Additionally, you can check the status of the integration jobs in the RTSM Integration Studio.
-
Navigate to:
Administration > RTSM Administration > Data Flow Management > Integration Studio
On the left-hand side of the Integration Studio, you see a list of all integration points.
-
Select the APM2OMi integration point. You see two integration jobs:
sync_continuous
sync_initial
Wait until at least one of these completes before continuing.
You can start manually either integration job by clicking the full synchronization icon or the delta synchronization icon.
-
Continue the Setup of BSM in OBM and Start the Integration
In this section, you configure event, status, and UI integration.
-
On the OBM server, navigate to:
Administration > Setup and Maintenance > Connected Servers
- Double-click your APM connected server to open the Edit APM Server panel. Alternatively, you can select it and click Edit.
-
Go to the Synchronization section, and perform the following:
- Clear the Step 1: Topology check box.
- Select the check box next to Step 2: OMi to APM Setup. This step integrates UI mash-up components and communication certificates and configures OBM server settings in APM.
-
Click Save to complete this step.
-
Go back to Administration > Setup and Maintenance > Connected Servers.
- Refresh to check if the status of the server connection is Running.
- Double-click your APM connected server to open the Edit APM Server panel. Alternatively, you can select it and click Edit.
-
Go to the Synchronization section, and perform the following:
- Clear the Step 2: OMi to APM Setup check box.
- Select the check box next to Step 3: Synchronization. CIs in OBM are updated with KPI status from the corresponding CIs in APM and downtime definitions are copied from APM to OBM.
- Optional. Select the Synchronize downtime check box to allow one time initial synchronization of BSM downtime to OBM, in order to help start managing all downtimes on the OBM side.
- Click Save.
-
In the Test Connection section, click Run Test to check that the specified connection attributes are correct. If an error message is displayed, correct the connection information, and retest the connection.
-
-
Enable Alert and Status Forwarding
In order to enable alert and status forwarding, you must manually deploy the OprEvent template on the OBM side.
-
On your OBM deployment, navigate to:
Administration > Monitoring > Policy Templates.
-
Expand the following:
Templates grouped by type > Events > Event from REST web service
- Click OprEvent template.
- Click Assign and Deploy Template.
- Select all OBM gateway systems.
- Click Next.
- Click Next.
- Click Finish.
-
-
Create OBM authentication user name and password
As part of the new integration between APM and OBM, embedded OBM under APM no longer exists, and the integration relies on connecting to OBM via REST.
APM users need to set an OBM user name and password for sending events from APM to OBM.
-
Run the following command on the agent to which the policy was deployed in the previous step. This sets the user name/password for the web service that APM is using (you must set the same username and password on APM):
<OBM_Home>/opr/bin/opr-rest-ws-policy-configuration.[bat|sh] -enable_auth -credentials -username <username> [-password <password>] -
Stop and restart the agent in order to save this change:
ovc -stop
ovc -status - In APM, select Admin > Platform > Setup and Maintenance > Infrastructure Settings.
- Select Foundations.
- Select OMi Integration.
-
In the OMi Integration - General Settings table:
- Locate Login and enter the user name you used in step 1 to create your OBMauthorization user name.
-
Locate Password and enter the password you used in step 1 to create your OBMauthorization password.
Use the user name and password that you created above.
- Save your changes.
-
-
Importing APM Certificate into OBM
To import the APM certificate into OBM:
-
On one of the APM gateway servers, get the list of certificates by running the command in command prompt:
keytool -list -v -keystore %topaz_home%\JRE\lib\security\cacecerts
-
Export the certificate/s by using the following command:
keytool -export -alias <alias name> -file <trusted certificate name> -keystore %topaz_home%\JRE\lib\security\cacecerts -
Import the certificate by running the following command from the
<OBM_Home>/JRE/binfolder on the OBM gateway and data processing servers:keytool -import -trustcacerts -keystore ../lib/security/cacerts -storepass changeit -alias <CA ALIAS> -file <location of file>
-
-
Importing Certificates for REST Service
Note The default communication method is HTTPS. This step is only required if a secured connection is required. If a secure connection is not required, complete the procedure in Using unsecured HTTP REST access.
To import the certificates:
-
On one of the OBM gateway servers where the policy was deployed, list the OBM certificates for the REST service, by entering ovcert -list in a command prompt.
-
Export the certificate by using the following command:
ovcert -exporttrusted -file <location of file> -alias <trusted certificate name>
For example:
ovcert -exporttrusted -file c:\trust.pem -alias CA_c37b8bd5-5b9b-4626-be18-c78ef76040e5_2048
where
c:\trust.pem is the location for the file which will be exported
CA_<UUID>_2048 is the CA certificate of OBM (where <UUID> is the ID retrieved when using the ovcoreid -ovrg server command).
-
Import the certificate by running the following command from the <APM_Home>/JRE64/bin folder on the APM gateway and data processing servers:
keytool -import -trustcacerts -keystore ../lib/security/cacerts -storepass changeit -alias ANYCERTID -file <location of file>
-
Restart the APM server on both the gateway and data processing server.
-
-
Using unsecured HTTP REST access
The default communication method is HTTPS. In order to use HTTP instead, perform the steps described in the Troubleshooting and Maintenance section.
-
KPI Assignments in OBM
BSM sends KPI status information for certain CI types to OBM. Per default, this is done for Business Application CIs, but BSM can also send KPI status changes for other CI Types. Such a KPI status change is sent to OBM in the form of a special event with a Health Indicator (HI) that contains the KPI name and the new status. These KPI change events are processed separately from other events and are not stored in the event database.
When a KPI change event arrives in OBM, the following is triggered:
-
Assuming an “Application Availability KPI change event” arrives, a corresponding Health Indicator “Application Availability” is created automatically (for the corresponding CI type).
-
If the CI Type does not yet have a KPI assignment for that specific KPI, then a new KPI assignment is created automatically that uses the HI “Application Availability” to set the KPI “Application Availability” and no further steps are necessary. The KPI status of the “Application Availability” KPI will be synchronized automatically.
-
If the CI Type already has a KPI assignment, then the KPI assignment needs to be adjusted manually.
Because OBM already has an out-of-the-box KPI assignment for Business Application CIs, you must perform the following manual steps.
-
In OBM, navigate to Administration > Service Health > CI Status Calculation > KPI Assignments.
- Select the CI Types ConfigurationItem > BusinessElement > BusinessApplication.
- Pause the assignments for BPM and RUM. These are predefined KPI assignments, which are not suitable for an OBM system.
-
-
Optional. Additional APM-OBM Integration Configurations
Integrating BSM with a new, second instance of OBM
To integrate BSM with a new instance of OBM, after disconnecting the original OBM system from BSM, perform the following:
Note It is not possible to simultaneously connect two OBM systems to one BSM system. The original OBM system must first be disconnected before connecting a new OBM instance to BSM.
- Connect BSM to OBM and execute the topology synchronization following the steps in Set up an APM connected server in OBM and complete the integration.
- After the topology synchronization, go to the OBM Integration Studio and select the Integration Point with the name "
APM2OMi <name of connected server>". - On the right side, select one of the two
sync_*jobs. - On the toolbar, click Clear caches.... After completion, click Full synchronization.
- The global IDs generated by the new OBM instance are now properly pushed to BSM.
Display BSM data in OBM
BSM user interface components can be directly integrated into the OBM Workspaces to view and drill down to detailed BSM information.
Note All APM systems connected to OBM must be the same version and/or provide the same features.
- On the OBM server, navigate to Workspaces > My Workspace
-
Create a new page:
- Click the New Page icon on the toolbar.
- Click Add Component to open the Component Gallery.
-
Select APM from the list on the left of the Component Gallery to display the BSM components.
-
Double-click the desired BSM.
It is not possible to apply a filter to the user interface components from the BSMs that are displayed in OBM. The following BSM use cases are supported:
-
Selecting BSM components from the OBM components gallery and opening them in a frame inside the OBM components dashboard.
-
Wiring in case of a CI change. For example, a CI 1 is selected and its associated data is displayed. If now a different CI, CI 2, is selected, the data displayed changes to data associated with CI 2.
The following components are currently available in OBM:
-
Platform components
Top View
Hierarchy
Application Health
APM Based Impact
-
BPM components
Application Summary
BPM Performance Matrix
BPM Performance Status
BPM Error Summary Distribution by Category/Type
Application Health Business Summary
BPM Error Summary Distribution by Location/BPM Custom Attributes
BPM Error Summary Distribution by Transaction
Metrics Over Time
-
RUM components
Application Health Performance
Application Health Availability
RUM Event Count By classification
-
SiteScope components
Cross Performance Reports
SiteScope Multi View
-
Service Level Management components
SLA Summary
Current Status Snapshot
Historic Status Snapshot
Other configurations
There are several OBM Integration Infrastructure setting that will enable you to customize your BSM-OBM Integration.
To customize the BSM-OBM integration:
- In the BSM application, select Admin > Platform > Setup and Maintenance > Infrastructure Settings.
- Select Foundations > OMi Integration.
-
Configure the OBM Integration settings as follows:
- HI Statuses Sync - CITs configuration file. Define which CI types to include in the HI status synchronization. The following CI types are included by default: node, running_software, business_application. You can add additional CI types or remove existing ones. The CI type name is the internal name (not the display name, for example, the display name is business_application, not Business Application). You can view the CI type name under RTSM > CIT manager.
- KPIs list per CI type (Business Application). Define which KPI to use for synchronizing the KPI status change. The following CI type is included by default: Application Availability and Application Performance for CI type business_application. You can add additional KPIs and CI types or remove existing ones. Keep in mind that the TQL integration for topology synchronization jobs must be modified to cover the same CI type. If the CIs and the GID are missing from OM, no status change will be reflected.
- Events chunk size. Size of chunk of events sent during initial KPI/HI synchronization. You can enter a number between 1 and 500.
- Interval between session. Interval between events chunks sending sessions (seconds). You can enter a number between 1 and 10.
- Event forwarding CI Alert name if status improved. Enter the event description that is generated when status changes and becomes better.
- Event forwarding CI Alert name if status worsened. Enter the event description that is generated when status changes and becomes worse.
In addition, you can use the tql - CIs_For_CIStatusChange_in_OMi to define which CIs to use to synchronize KPI status changes.
-
Optional. Create and forward EUM alerts to OBM
It is best practice to forward End User Management (EUM) related information to OBM. With EUM alerts, you can:
- Configure conditions and event based triggers or time based triggers. For example, you can send an alert when a transaction fail or exceeds a specified amount of time.
- Filter the alert by transaction, location, or mobile device
- Configure the notification frequency
By creating EUM alerts, you can pass critical events for EUM applications that are not part of the integration to OBM. When you create EUM alerts you should tailor them according to your specific requirements. In the Actions tab, be sure to select Generate Event. Events that are created in this manner are automatically forwarded to OBM.
For information about creating and managing EUM alerts, see the BSM Application Administration Guide.
Troubleshooting and Maintenance
The following topics describe how to troubleshoot and maintain your OBM-APM integration.
To adjust and troubleshoot KPI assignments in OBM, do the following:
- In BSM, create a KPI assignment with the Application Availability KPI type, and any of the available HIs.
-
Send an event on OBM by using the
sendEvent.bat|shtool. The event should contain a severity with the new state of the KPI, a category KpiStatusChange, an ETI Hint containing only the name of the affected KPI, and a RelatedCiHint with a valid hint for the CI resolver.Example: In this example,
Application Performancehas been chosen as the assignment in step 1.<OBM_HOME>/opr/support/sendEvent.[bat|sh] -t example -c KpiStatusChange -s Normal -rch GUCMDB:<GlobalCi_Of_BusinessApplication_CI> -eh "Application Performance" - In OBM, navigate to Administration > Service Health > KPI Assignments.
- In the left pane, select ConfigurationItem > BusinessElement > BusinessApplication.
- In the central pane, select the assignment that contains Application Availability, Availability Performance, and click Edit to edit the KPI assignment.
- In the Edit KPI Assignment panel, navigate to the KPI Configurations section.
- Select the Application Availability KPI, and click Edit.
-
In the Related HIs field, add the Application Availability HI to the list of selected HIs.
Note: If you do not see any HIs in the Related HIs drop-down menu, wait until CI status changes are from BSM to OBM. The forwarding of CI status changes is triggered by the first change of a CI status of any CI that is present in BSM and has been synchronized to OBM. These adjustments can only be done when a corresponding CI status event has been received in OBM. Otherwise, you will not see the Application Performance or Application Availability HIs. - Click Save.
- Perform steps 7 to 10 for the Application Performance HI and KPI.
- Click Apply all rules for the assignment to take effect on existing CIs.
When you change the integration user's password on the BSM system, the password must be updated in BSM User Management and in the OBM connected server. To change the integration user's password, perform the following steps:
-
In your BSM deployment (DPS), go to the jmx console:
http://localhost:21212/jmx-console -
Select UCMDB Service:Security Services.
-
Go to changeIntegrationUserPassword() and use the following values:
customerID: 1userName: <integration user name>password: <new pwd>
-
Click Invoke.
-
In your BSM deployment, go to Admin > Platform > User and Permissions > User Management.
-
Select your integration user in the Groups/Users list.
-
On the General tab, enter the new password in the Password and Confirm Password fields. Click Apply.
-
In your OBM deployment, navigate to Administration > Setup and Maintenance > Connected Servers.
-
Edit the APM connected server. In the Server Properties section, enter the new password in the Password and Verify password fields and save.
- In the Synchronization section, re-trigger steps 1-3 to avoid any inconsistencies after the password change.
Note This step is only required if you are using unsecured HTTP access.
The default communication method is HTTPS. In order to use HTTP, perform the following:
-
Access APM JMX, for example:
http://<localhost>:29000/mbean?objectname=OMi-Integration%3Aservice%3DSettings
-
Enter the URL to connect to OBM by using setOmiUrl method, for example:
http://<OBM GW>:30005
- To view the settings, use the method getOmiUrl.
If you integrate SiteScope with BSM 9.26 for OMi features (topology and events) and upgrade BSM 9.26 to OMi 10.11, the integration between OMi and SiteScope does not behave as it used. You will not see the new topology and events from your existing SiteScope in the new upgraded OMi.
Workaround: Reset the BSM integration in SiteScope and delete the integration in OMi 10.11's Connected server and re-integrate SiteScope from OMi 10.11.
To reset the BSM integration in SiteScope:
1. Log in to SiteScope with your user ID and password.
2. Go to Preferences > Integration Preferences.
3. Edit the existing BSM integration.
4. Click the BSM Preferences Available Operations tab and click Reset.
5. Click OK. The BSM integration is deleted.
If LDAP was configured on the APM system, it's possible that the integration user's password was not correctly saved in the RTSM database, which will cause the topology integration to fail. To manually update the integration user's password in the RTSM, do the following:
- Log in to APM as an administrative user.
- In the same browser in a different tab, connect to the RTSM with
http://<APM>:21212, and select User Management. - Find the integration user and select Change Password.
- Fill in the new password (you can leave the old password blank).
- Save the new password and trigger the topology synchronization again.
If you are running the OBM-APM integration and BSM is using IIS and the OBM-APM integration fails with a Trust for event synchronization failed error, perform the following on all BSM gateways running on IIS.
- From the Start menu, click Administrative Tools > Internet Information Services (IIS) Manager.
- In the Connections pane, click Default Web Site.
- In the right pane, double-click Request Filtering.
- Click the HTTP Verbs tab.
- In the right pane, right-click and select Allow Verb.
- In the Allow Verb dialog box, enter PUT and click OK.
- Click the File Name Extensions tab.
- In the right pane, right-click and select Allow File Name Extension.
- In the Allow File Name Extension dialog box, enter group and click OK.
- Reset IIS.
Overview
SiteScope is an agentless monitoring solution that enables you to remotely monitor the availability and performance of your IT infrastructure (for example, servers, operating systems, network devices, network services, applications, and application components). The SiteScope integration with OBM has multiple parts, which can be enabled individually or in combination with one another. The parts of the integration are:
- Event integration: SiteScope can forward events to OBM.
- Topology integration: SiteScope can forward topology information to OBM.
- Drilldown integration: When SiteScope monitors are used to set the status of a configuration item (CI), you can drill down from the CI in OBM to a SiteScope monitor that contributes to the HI's status.
- Configuring and deploying SiteScope monitors from OBM: OBM provides a script that enables you to import templates from a SiteScope server so that you can include them in aspects, thus allowing you to manage the configuration and deployment of SiteScope monitors from within OBM.
Integration
Complete the following workflow to configure and use the SiteScope integration:
-
Prerequisites
- See the Integration Catalog to review the official support matrix for the integration between OBM and SiteScope.
-
The minimum requirements are:
- Have OBM latest version and patch installed.
-
Have SiteScope latest version and patch installed.
For more information on the supported OBM and SiteScope versions for the integration, see Software Integration Catalog.
-
If you want to integrate OMi 10.63 and SiteScope 11.40, install SiteScope 11.40 IP2 and apply the hotfix for QCCR1I129992.
-
If you want to integrate OBM 2018.05 with SiteScope 11.50, apply the workaround for QCCR8D103923.
-
In SiteScope, go to Preferences > Infrastructure Preferences > Server Settings and set Host name override to the FQDN of the SiteScope server. Alternatively, modify
SiteScope/Groups/master.configby setting_sishostnameoverride=<SiS server FQDN>.By doing this, you avoid getting duplicate SiteScope node CIs in OBM.
-
Install and configure the Operations Agent
-
Install the Operations Agent on the SiteScope system.
Install Operations Agent from the SiteScope installer package, or download it from the Micro Focus Software Support (in the Search box, type "Operations Agent", select the relevant version, under Document Type, select Patches, and locate the installation file).
On Windows:
- Log in to the node with administrator privileges.
- Go to the directory where you extracted the contents of the ISO file.
- Run the following command to install the agent:
cscript oainstall.vbs -i -a
On Linux:
- Log on to the node with root privileges.
- Go to the directory where you extracted the contents of the ISO file.
- Run the following command to start the installation:
./oainstall.sh -i -a
For more detailed installation instructions, see the Operations Agent Installation Guide, available from the Documentation Portal.
Note
Use the
-includeupdatesinstallation to install Operations Agent with prepackaged hotfixes. For details, see the Operations Agent Installation Guide. -
Configure the Operations Agent.
This task registers the sisconfig subagent process (used for Monitoring Automation to deploy monitoring to SiteScope), and installs the policy signing tool (used by SiteScope to install policies locally).
-
Run the SiteScope Configuration Tool on the SiteScope server:
-
On Windows: Select Start > All Programs > SiteScope > Configuration Tool.
-
On Linux (graphic mode): Run
<SiteScope install Directory>/bin/config_tool.sh -
On Linux (console mode): Run
<SiteScope install Directory>/bin/config_tool.sh -i console.
For more details on using the SiteScope Configuration Tool, see the SiteScope Help.
-
-
In the Configure Operations Agent installed separately option (Operations Agent option in console mode), select Configure Operations Agent to complete the installation of the Operations Agent.
-
Restart SiteScope.
-
After installing the Operations Agent, check the installation status in the log files as follows:
-
In the SiteScope log, check if the installation completed successfully by searching for the results of
installOATask.Log file name:
SiteScope_config_tool.logLog file location on Windows platforms: win- %tmp%
Log file location on UNIX/Linux platforms: /temp or /var/temp
-
In the Operations Agent log files:
Log file name: oainstall.log, oapatch.log
Log file location on Windows platform:
%ovdatadir%\logLog file location on UNIX/Linux platforms:
/var/opt/OV/log
-
-
-
-
Configure and deploy SiteScope monitors from OBM
To set up the OBM-SiteScope integration so that you can configure and deploy SiteScope monitors from within OBM, follow these steps:
Note To enable this integration for TLS, perform the steps in Connect to a SiteScope server that requires TLS and Set up TLS between sisconfig and SiteScope runtime.
Note If you want to graph SiteScope metrics on the Performance Dashboard, do not use the character "/" in the SiteScope monitor names. Performance dashboard does not support this character. Hence classes for the CI on which the monitor is created will not be listed.
-
Set up the SiteScope system as a connected server on the OBM server. For more information on setting up a SiteScope connected server and on selecting the target SiteScope server for deployment, see the OBM Administration Guide.
In order to create a connected server, a valid SiteScope admin user with user name and password must be set up. The user credentials are not created by default when you install SiteScope. For details on how to set up a user name and password, see the SiteScope User Help > Preferences > User Management Preferences.
- Configure templates in SiteScope and import them using the
opr-config-exchange-sistool in OBM. For information on importing templates from a SiteScope server and assigning SiteScope policy templates to remote servers, as well as for troubleshooting information, see the OBM Administration Guide.
Guidelines for using multiple SiteScope monitors of same monitor type
When creating a chart in a performance dashboard, you select the SiteScope data source followed by the monitor type (class name), metric name, and instance name. This is the instance name format:
<SiteScope_ServerName>/<SiteScope_Group_Name>/<Monitor_Name>When you want to use the same performance dashboard to display the same metrics for a different monitored CI, Performance Dashboard (PD) uses the
<Monitor_Name>to find a matching instance. If the exact name does not exist, which is typically the case, it finds the first available instance. If that CI has just one monitor of that type, then it is selected. However, you may choose to have more than one monitor of the same type for a monitored CI. This can happen if you want to have two or more UNIX Resources monitors per monitored CI. In this case, to ensure PD selects the correct instance for the metrics in your chart, your monitor names must be in this format:<Prefix name> on <hostname>For a SiteScope template, it would be
<Prefix name> on %%host%%PD selects the instance with the same
<Prefix name>.For example, when monitoring a server named
sample.domain.comwith separate UNIX Resource monitors for file system usage metrics and network usage metrics, name the two monitors as follows:File_system_usage on sample.domain.comandNetwork_usage on sample.domain.com -
-
Configure the event integration
-
Log in to SiteScope, and navigate to Preferences > Integration Preferences.
-
Click New Integration, and in the resulting window select Operations Manager Integration.
-
Enter the FQDN of the OBM gateway server or load balancer.
-
Check the following boxes:
-
Enable sending events
-
Connect directly to APM
-
Prefer events over metric in APM Service Health (global preference)
Note Do not send metrics to the Operations Agent on the SiteScope server. This capability has been deprecated. OBM and other components of Operations Bridge access SiteScope metric data via SiteScope's native logs.
-
-
Clear the Enable exporting templates to Operations Manager box.
-
Click Connect to activate the agent.
Note If you have not configured certificate auto-granting, you must manually grant the certificate request in OBM:
-
Navigate to Administration > Setup and Maintenance > Certificate Requests
-
Select the certificate request.
-
Click the Grant icon.
-
- Click Install Polices, then click Analyze to verify the configuration.
- In the Test Integration section, enter a test message, and click Send Test Message. Then click Send Test Event. Click OK to close the window, then click OK in the following Disable Policy Result window. Verify that both events are in the OBM Event Browser.
-
Configure all pre-existing monitors to set Service Health based on events.
Now that you have integrated SiteScope with OBM, any pre-existing monitors have been updated with an Integrations Settings section. In this section, the APM Service Health Preferences show Service Health is affected by Metrics. This setting must be changed to Events, so that events carry indicators to set Service Health. To change the APM Service Health Preferences from Metrics to Events:
-
In the monitor tree, right-click the SiteScope container and select Global Search and Replace.
-
In the wizard, select all monitors and then select Replace in the Replace Mode tab. In the Choose Changes tab, check the APM Service Health affected by box and set the associated drop down list to Events.
-
-
-
Connect to a SiteScope server that requires TLS
To connect to a SiteScope server that requires TLS, OBM must trust the root certificate that was used to sign the SiteScope certificate. This is done by adding the root certificate to the CA keystore of all of the OBM gateway and data processing servers and to the CA keystore of the SiteScope server. It is important to load the certificates into all DPS and GW servers as the servers reach out to the SiteScope server to run REST APIs required to determine licensing and load:
- Deployment jobs for SiteScope templates based on manual deployments are executed on a GW server.
- Deployment jobs for SiteScope templates when using automatic assignment rules are executed on the DPS.
After loading certificates only into the gateway servers, note that the Connected Server user interface will return a false positive when clicking Run Test because the test does not check the DPS certificates.
Caution Clients can no longer connect to SiteScope 11.33 (and later versions) by using an HTTPS URL starting with
https://localhost. Instead, the host name of the SiteScope system must be used. You can set the host name in SiteScope by running the following command:$ ovconfchg -ns opr.sisconfig -set sis_host <SiS_hostname>Complete one of the following procedures depending on the type of certificate that was used to sign the SiteScope certificate:
Note If the OBM or SiteScope server runs a Linux operating system, replace the paths in the following procedures with their Linux equivalents.
-
Certificate from a certificate authority. If the SiteScope certificate was signed with a certificate from a certificate authority, import the certificate to the SiteScope CA keystore and to the CA keystore of the OBM server. Alternatively, you can also import OBM certificate into SiteScope.
To import SiteScope CA certificate into OBM, follow these steps:
-
Obtain the root certificate (and any other intermediate certificate) from the certificate authority.
-
On the SiteScope server to which you want to deploy policies, import the root certificate (and any other intermediate certificate) to the SiteScope CA keystore. Type:
C:\SiteScope\java\bin\keytool -importcert -alias <yourCA> -file <CAcertificateFile> -keystore C:\SiteScope\java\lib\security\cacertsWhen prompted for the password, type the keystore password. (The default password is
changeit.) -
On the OBM server to which you want to export SiteScope templates, import the root certificate (and any other intermediate certificate) to the OBM CA keystore. Type:
<OBM_HOME>\bin\opr-cert-mgmt.[bat|sh] -import <alias> <path>When prompted for the password, type the keystore password. (The default password is
changeit.) - Restart SiteScope, so that the newly imported certificate will be recognized and used by the integration.
To import OBM CA certificate into SiteScope, follow these steps:
- On the SiteScope server, go to Preferences > Certificate Management. Click New. The Import Certificates page is displayed.
- Enter the IP address of the OBM server and specify the port.
- Click Select to browse and upload the certificate.
- Click Import to import the OBM CA certificate into SiteScope.
-
Restart the SiteScope service.
-
-
SiteScope self-signed certificate. If the SiteScope certificate is a self-signed certificate (for example, a certificate that was created and configured with the SiteScope tool ssl_util), export the self-signed certificate from SiteScope and import it to the CA keystores of the OBM server and SiteScope:
-
On the SiteScope server, export the self-signed certificate, type:
C:\SiteScope\java\bin\keytool -exportcert -keystore C:\SiteScope\groups\serverKeystore -alias sitescope -file <certificateFile>When prompted for the keystore password, type the password that was specified when using the ssl_util tool.
-
On the SiteScope server, import the self-signed certificate to the SiteScope CA keystore. Type:
C:\SiteScope\java\bin\keytool -importcert -file <certificateFile> -keystore C:\SiteScope\java\lib\security\cacertsWhen prompted for the password, type the keystore password. (The default password is
changeit.) -
Copy the certificate to the OBM server to which you want to export SiteScope templates.
-
On the OBM server, import the self-signed certificate to the OBM CA keystore. Type:
<OBM_HOME>\bin\opr-cert-mgmt.[bat|sh] -import <alias> <path>Note For more information on the
opr-cert-mgmttool, see OBM Developer Guide.When prompted for the password, type the keystore password (the default password is
changeit). - Restart SiteScope, so that the newly imported certificate will be recognized and used by the integration.
-
-
Configure the topology integration
Note By default, OBM uses HTTPS for the internal communication with UCMDB 10.30 and later versions. If you want to run OBM in an HTTP-only environment instead, run the following script on all gateway servers:
<OBM_Home>/opr/support/enableOdbInternalSSL.sh|batRestart OBM after the script execution.
-
If not already done so in an earlier step, create a connected server in OBM for the SiteScope server. For information on creating a connected server, see OBM Administration Guide.
-
Applies to SiteScope versions 11.33 (IP1 to IP5)and 11.40. Redeploy the SiteScope packages by doing the following:
- Log on to the OBM server.
- Copy the
sitescope.zipfile from theSiteScopePackagesfolder which is delivered with the SiteScope installation files. Save the copy to a temporary location. - Go to Administration > RTSM Administration > Administration > Package Manager.
- Right-click SiteScope and click Undeploy.
- Click Deploy packages to server (from local disk).
- Click Add and select the new
sitescope.zippackage. - Click Deploy.
- Restart SiteScope to have the new scripts available in SiteScope.
Alternatively, you can redeploy the packages by using the JMX console. For details, see the ReadMe file that is delivered together with the SiteScope installation files.
-
Verify that the integration has been configured automatically in SiteScope:
-
In SiteScope, navigate to Preferences > Integration Preferences.
-
You will see a new APM integration configured as a result of creating the connected server in OBM.
-
-
Verify that the topology has been created in the RTSM.
-
In OBM, navigate to Administration > RTSM Administration > Modeling > IT Universe Manager.
-
Search for all node CIs. You should now see one or more new CIs created by SiteScope.
-
Troubleshooting: If topology is not appearing in the RTSM, you can check for errors in the SiteScope logs.
If you see an error in
<SiteScope>\logs\bac_integration\discovery.log, clear the topology cache on SiteScope:- Stop the SiteScope service.
- Delete the 4 files in
<SiteScope>\discovery\hsqldb directory - Start the SiteScope service.
- Re-synchronize the topology. Log in to SiteScope and navigate to Preferences > Integration Preferences. Edit APM Integration, and in the resulting window click Re-Synchronize under APM Preferences Available Operations.
-
-
-
Drill Down to SiteScope
When SiteScope monitors are used to set the status of a configuration item (CI), you can drill down from the CI (or from a health indicator (HI) on the CI) to a SiteScope monitor that contributes to the HI's status.
-
Prerequisite. Configure LW-SSO between SiteScope and OBM. Otherwise, you must log into SiteScope manually whenever you drill down to SiteScope.
To configure LW-SSO, do the following:
-
In a OBM server, log on to OBM and go to Administration > Users > Authentication Management. Click Edit for the Single Sign-On Mode, select Lightweight and copy the Token Creation Key (initString).
In a OBM container, copy the initString from the IdM portal as follows:
- Log on to the Management Portal, go to Administration > IdM Administration.
- Click Operations Bridge, then System Settings and Initial String. Select Show Value, you can see the initString.
- Copy the initString.
- Log on to SiteScope and go to Preferences > General Preferences >LW SSO Settings. Enter the initString you copied from OBM and save.
- Restart SiteScope.
-
-
Access menu commands from a CI or HI in a My Workspace page or component, for example 360° View, Top View, View Explorer, Health Indicator, or the SiteScope Multi-View component. Select Go to >SiteScope. The SiteScope UI opens directly to the parent group of the relevant monitor.
If monitors from multiple groups contribute to the CI's or HI's status, the Drilldown to SiteScope dialog box opens. Select the monitor to which you want to drill down and open it in SiteScope.
The Drilldown to SiteScope dialog box displays the following hierarchy:
-
The root level shows health indicators.
If you open the dialog box for a CI, one or more HIs that contribute to the CIs status are listed. If you open the dialog box for an HI, this HI appears as the root.
-
The level below the root shows the SiteScope systems (connected server name) that have monitors contributing to the HI.
- The lowest level shows the SiteScope monitors that contribute to the HI.
Note In the System Monitors view, if you select Go to > SiteScope from a monitored CI, SiteScope opens the monitor's parent group. If you select this from a group CI, SiteScope opens directly to the group.
-
-
Select a SiteScope monitor, and click Drilldown.
For details on working with SiteScope, see SiteScope Help.
-
-
Set up TLS between sisconfig and SiteScope runtime
The sisconfig component is the adapter between the Operations Agent and the SiteScope runtime. If you are performing the integration to enable configuration and deployment of SiS monitors from OBM, and you want TLS to be enabled, follow these steps:
-
Set up TLS for SiteScope:
-
If SiteScope was not yet configured to run with HTTPS, set up a self-signed certificate:
<SiteScopeDir>/java/bin/keytool -genkey -dname "CN=www.example.net, OU=myOffice, O=myCompany, L=myLocation, ST=myState, C=myCountry" -alias myAlias -keypass mykeypass -keystore<SiteScopeDir>/groups/serverKeystore -storepass mykeypass -kelalg "RSA" -validity 742 -
Modify tomcat:
In
<SiteScopeDir>/Tomcat/conf/server.xmlcomment theport="8080"and add the following:<Connector port="8443" maxThreads="150" minSpareThreads="25" maxSpareThreads="75" enableLookups="false" disableUploadTimeout="true" acceptCount="100" debug="0" scheme="https" secure="true" clientAuth="false" sslProtocol="TLS" keystoreFile="<SitescopeDir>/groups/serverKeystore" keystorePass="passphrase" />Restart tomcat.
-
-
Set up TLS for sisconfig:
-
Import the SiteScope root certificate to the Java keystore so that siconfig can find it:
<SitescopeDir>\java\bin\keytool -import -keystore SitescopeDir>\java\lib\security\cacerts -storepass mykeypass -trustcacerts -file "<SitescopeDir>\groups\serverKeystore" -
Set
https_enabled=trueand check that the port is 8443:<OvBinDir>\ovconfchg –ns opr.sisconfig –set https_enabled true<OvBinDir>\ovconfchg –ns opr.sisconfig –set sis_port 8443 -
Restart sisconfig:
<OvBinDir>\ovc –restart sisconfig
-
-
Best Practices
Follow these best practices when setting up your OBM-SiS integration.
These are the best practices for SiteScope monitor settings. You can set these settings in the Integration Settings section which is part of every SiteScope monitor:
-
Do not send metrics data.
At the top of the Integration Settings section, select Enable reporting monitor status (no metrics).
Since OBM does not process metrics and will just ignore them, and to avoid unnecessary network traffic, it is better not to send those metrics in the first place. -
Examine the topology section and set it up properly.
Topology is required if you want to graph SiteScope metrics in the OBM Performance Dashboard. It also enables additional functionality, for example service health and downtime management. Topology is also important for OBR reports. For more guidance on SiteScope topology, see the blog post Three faces of SiteScope monitors in the Wild West.
Note If you force monitoring to report at the Node level where the monitor defaults to a Running Software CI type, then the related out-of-the-box TBEC rules will not be used.
-
Send events.
The best practice approach for sending events to OBM is to click the Send events checkbox in the Integration Settings section.
-
APM Service Health settings.
Under the APM Service Health Preferences section make sure that the APM Service Health affected by setting is set to Events.
For the event integration, the best practice is to click the Send events checkbox in the Operations Manager Integration Settings of all monitors. This generates an event in OBM for each metric threshold status change. The event automatically includes the Event Type Indicator (ETI) applicable for that CI type, and the metric / threshold combination based on the Indicator Settings in the Integrations Settings section of the monitor.
Event rules
If you do not want an event to be generated immediately on a status change, configure Event Rule Settings in the monitor. Events generated by the Send events configuration can be held back based on time and/or the number of monitor executions for which a condition that generated an event is continuously active. For example, send an event only if the monitor fails twice in row.
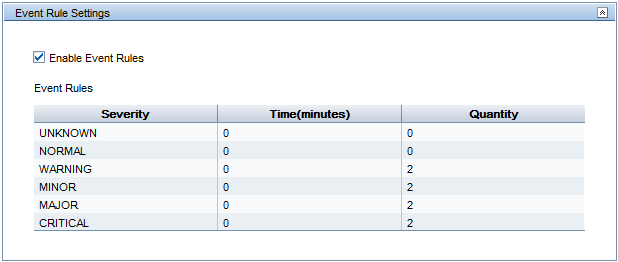
Using Alert Actions to generate events
If even more flexibility is required for generating events than what you can achieve with Event Rules or by controlling them in OBM, then you could define SiteScope Alert Actions.
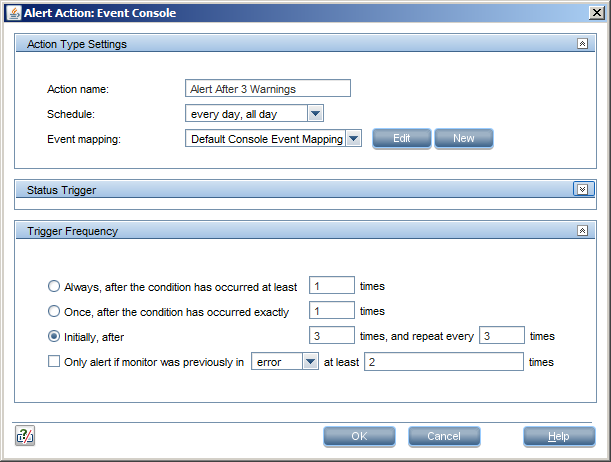
Be aware that the ETI is not set automatically if you use the Alert Action method. You need to set the ETI at the alert action level as shown below.
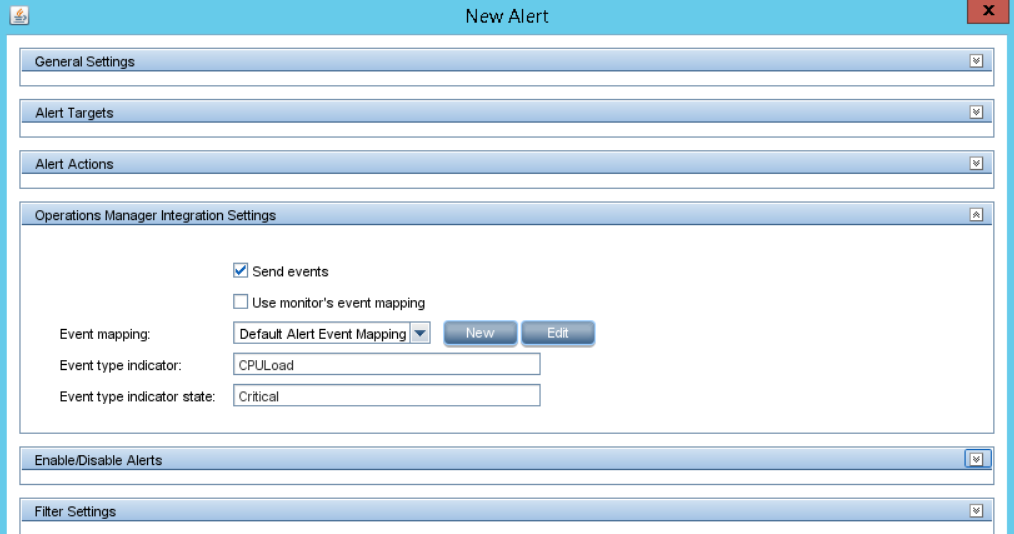
Alert Action Type
When creating an alert to generate an event, you can choose either the Event Console or Trigger Action Type. The Trigger action in SiteScope Alert actions incurs less overhead than Event Console.
The Event Console action keeps a log of actions for SiteScope’s internal event dashboard. When integrating SiteScope with OBM, there is typically no need to use an event console in SiteScope as well. Thus, the best practice is to use a Trigger action instead of Event Console.
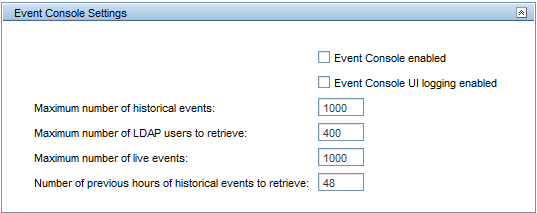
Custom Common Event Mappings (CEMs) are often created for monitors in a SiteScope template in order to customize the event attributes such as the title, description, ETI, and custom attributes for the events they generate.
When using OBM Monitoring Automation with a group of SiteScope servers, these CEMs must exist on the SiteScope server before deploying a policy from OBM to the server that uses the CEM.
There is no “dedicated” export/import capability specifically for CEMs. The procedure outlined here uses the SiteScope Persistency Viewer tool to export a CEM from the SiteScope server where you develop your OBM SiteScope templates.
Updating CEMs
Apply these best practices to update CEMs:
-
Decide on a naming convention for your CEMs. Add a version number and update it every time you change a CEM. This will allow you to apply updated versions by using the Export/Import procedure.
For example, if you have a CEM for a HeartBeat monitor, you may want to call the first version of the CEM “HeartBeat –V1”. When you change your monitoring template that you wish to use with OBM/MA and it requires a new version, you would use the new name of “HeartBeat–V2”.
-
Before you upload a new SiteScope template to OBM that uses a new CEM version, follow the Export /Import procedure outlined below to first export the CEM to a file and then import it to every SiteScope server that might receive a deployment of this SiteScope template from OBM.
-
Once the CEM has been replicated to all relevant SiteScope servers, you can upload your new or updated SiteScope template to OBM.
-
When you eventually deploy the OBM template or aspect to a SiteScope server, you are now guaranteed that the required CEM is available.
Export/import procedure for CEMs
Use the SiteScope Persistency Viewer tool to export the CEM from the SiteScope server on which you develop your templates.
Caution Improper use of the SiteScope Persistency Viewer tool can cause irreparable damage to your SiteScope server. Do not use any capabilities other than those documented in this procedure.
-
Launch the SiteScope Persistency Viewer on your development SiteScope server. You can do this with your SiteScope server running. The tool is located at:
Windows:
<SiteScope_Home>\bin\PersistencyViewer.bat
UNIX:/opt/HP/SiteScope/bin/XPersistencyViewer.sh -
Click Continue to move through the warning message. Then click Select Persistency Path...
-
Select the SiteScope
persistencyfolder and click Open. This folder is located at the top level in your SiteScope installation directory. -
In the Filter by Type drop-down list, select the entry (near the bottom of the list) with the name
com.mercury.sitescope.platform.configmanager.preferences.PreferencesConfig -
Select the new Common Event Mappings that you want to copy to the destination SiteScope server(s) and click Export.
You cannot import a CEM into a SiteScope system that already has a CEM with the same name. It will simply be skipped/ignored and the original version will remain. That is why you need to have a naming convention that has a version number and only import new items.
-
Provide a file name, for example
cem-updates. Then click Open to save the CEMs to a file. -
Copy the exported file to a destination production SiteScope server.
-
Make a copy of the file and paste it into the
<SiteScope_Home>/persistency/importfolder. Do not move your only copy of the original file as it will eventually be deleted. Within a couple of minutes, the file will be processed and then deleted. -
Your new CEMs on the destination SiteScope server should now be available. You can verify this in your SiteScope UI as shown below.
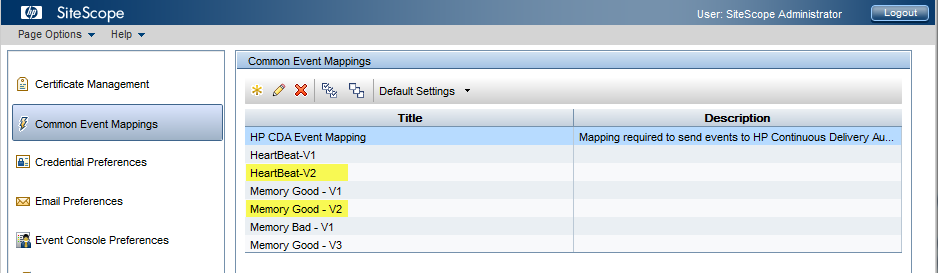
-
You are now able to deploy a template (which references these new CEMs) to this production SiteScope server by using OBM.
Note If you have a very large SiteScope deployment, the out-of-the-box persistency viewer Java command line may not be configured with enough memory for the tool to run. It will crash with an Out of Memory error at startup time. In this case, do the following to increase the memory:
-
In Windows, edit
<SiteScope_Home>/conf/ems/tools/set_env.batand add more heap memory to the-Xmxcommand line option.For example, change
set JAVA_EXEC=%SS_HOME%\java\bin\java.exe -Xmx512m
toset JAVA_EXEC=%SS_HOME%\java\bin\java.exe -Xmx2000m -
In Unix, add an
-Xmxoption to the Java command line in/opt/HP/SiteScope/bin/XPersistencyView.sh.For example, change
java/bin/java -Dtopaz.home=../conf/ems/tools …
tojava/bin/java -Xmx2000m -Dtopaz.home=../conf/ems/tools …
These best practices leverage the capabilities of OBM Monitoring Automation in order to:
-
Reduce the number of monitoring templates that need to be developed and maintained at the SiteScope level.
- Eliminate the need for manual steps to duplicate credentials across multiple SiteScope servers.
- Keep all credentials in one place (OBM).
- Leverage centralized parameter customization (for example threshold tuning).
- Eliminate “race” conditions where monitors are deployed that depend on each other. For example between Remote Server creation and the Heartbeat monitor, or a Heartbeat monitor and core OS monitors.
Create a single template for core OS monitoring
It is best practice that the remote server creation step as well as any monitors defined as dependencies (for example heartbeat or reachability check monitors) and the core OS monitors be deployed as a single SiteScope template.
There is no problem having the core OS monitors depend on a heartbeat monitor that is defined within the same SiteScope template.
Deploying the core OS monitor as “all in one” also eliminates race conditions. For example, a core OS monitor could be deployed before the remote server is created (causing the core OS monitor to fail).
Manage credentials in OBM
When you use SiteScope Credential Preferences to manage OS credentials inside a SiteScope template, you must create multiple copies of a SiteScope template and synchronize them with OBM. Multiple OBM aspects are then required at the OBM level as well as multiple automatic assignment rules.
You would require additional effort when making simple changes to update a SiteScope template, as those changes must be made in multiple places. These can easily get out of sync due to the manual nature of this task.
As a best practice, parameterize all credentials in SiteScope templates so that a SiteScope template can be reused and customized at the OBM level. Credentials should be set in an OBM aspect or when applying an automatic assignment rule against a view in OBM.
Fully parameterize all SiteScope templates
SiteScope templates should be parameterized as much as possible to allow for maximum reuse. This includes:
- OS and resource/application credentials
- Metric thresholds
- Application name or other monitor specific details (server, port, URL or whatever the monitor requires)
Parameterization reduces the number of required templates. OBM allows the customization of template parameters in the following situations:
-
A SiteScope template is included in an aspect.
There could be, for example, one aspect created with a “Gold” level of thresholds and another with a “Silver” level of thresholds based on a single SiteScope template. If metric thresholds are parameterized, then only one SiteScope template needs to be maintained. Threshold values can be overridden when it is included in an OBM aspect or during an assignment.
-
An aspect is deployed against a view (using automatic assignment rules).
For example, one set of Windows servers (view #1) could need credential set #1 and the same aspect could be used for a different set of Windows servers (view #2) but with credential set #2 applied. If credentials are parameterized, there could be one aspect that has the OS credentials specified differently in two automatic assignment rules when the different views are assigned to the same aspect.
-
An aspect is tuned for a specific deployment (settings can be overridden).
For example, an application team could desire some custom threshold outside of existing packaged aspects or automatic assignment rules offered by the monitoring team. Parameters can be overridden for a single server deployment if required.
In a large agentless monitoring deployment, usually multiple SiteScope servers are required. One SiteScope server can monitor around 24,000 monitors and most successful deployments run fewer than this.
There might be a requirement whereby a set of nodes must be monitored by a specific SiteScope server. This means that not all SiteScope servers would have access to the complete set of managed nodes. In this case, you must be sure that monitors will be deployed to a SiteScope server that can actually reach the managed nodes in question.
Monitors are typically deployed to a pool of SiteScope servers. OBM supplies a “callout” to a SiteScope selection script that can be configured in Administration > Infrastructure Settings > Monitoring Automation > Proxy Deployment Scripts > SiteScope server selection script.
This script must be customized to take data, sometimes from the RTSM, to make a decision about which SiteScope server is appropriate for a deployment. By default, decisions to deploy monitors to a SiteScope server can be based on the following inputs to the SiteScope selection script:
- Name
- DNSName
- DomainName
- IPAddress
In addition, the decision can be based on these attributes of the SiteScope server:
- Deployed Monitors
- TotalPoints
- UsedPoints
- MonitorsPerMinute
- OsInstanceUsedPoints
- OsInstanceTotalPoints
- URLMonitorUsedPoints
- URLMonitorTotalPoints
- TransactionMonitorUsedPoints
- TransactionMonitorTotalPoints
Note The SiteScope server data does not include any pending deployment jobs in the monitor counts.
Deploying multiple templates can result in additional OSI licenses
When OBM deploys additional templates against the same node, there is no guarantee that the deployment job will be deployed to the SiteScope server that is already consuming an OSI license for that node. This could result in an OSI license to be consumed for the same node on multiple SiteScope servers.
Note Updating an existing SiteScope template that is already deployed for a node will cause the template to be deployed to the same SiteScope server (as of OMi 10.12 IP2). No new license will be consumed.
OBM supports a downtime feature where you can put one or more business applications (and their nodes), CI collections (and their nodes), running software and any individual node(s) that you select into a downtime state. This is useful during periods of maintenance or a planned outage to stop both the monitoring and alerting.
To access this feature in OBM, go to Administration > Service Health > Downtime Management and create your downtime with the wizard or use the opr-downtime CLI or equivalent REST API. To stop monitoring in SiteScope for the affected CIs, use the option BSM/APM integration only. Additionally enforce downtime in BSM/APM reports and stop active BPM & SiteScope monitoring.
Note If you continue monitoring during the downtime and a status changes, the event is still generated in OBM, but it is immediately closed.
How OBM downtime works with SiteScope
The BSMDowntime_topology TQL in OBM controls downtime CIs. The TQL should always be inspected and can be adjusted to match your application modeling style.
To see this TQL, make hidden queries visible in the Modeling Studio: go to Modeling Studio > User Preferences > General Section > Enable Hidden Queries and set it to true.
The out-of-the-box TQL can be too restrictive in some cases. For example, it requires that business services be related to the business applications, but not all organizations follow this practice. Also, in OBM 10.62 and earlier, the TQL is missing a relationship between business application and SiteScope monitor, and between business application and node. The following TQL contains all these changes. When moving to production the existing TQL should be removed from the system and replaced with the TQL embedded below (import it from a file).
BSMDowntime_topology_fixed_.xml
By default, every 15 minutes (and at SiteScope start up), SiteScope runs the query to see if any more downtime periods should be created. Because of this you should avoid creating downtimes very close to the time you expect them to begin.
The interval between SiteScope queries to OBM for downtime requests can be changed in SiteScope in Preferences > Infrastructure Preferences > General Settings > APM downtime retrieval frequency (minutes).
SiteScope logging data during downtime or when monitors are disabled
By default, when a SiteScope monitor is disabled it still writes data to the log files. This causes issues in graphing data in OBM Performance Dashboard where the last known value logged will be erroneously delivered as a sample value.
The best practice is to turn this feature off. In SiteScope, go to Preferences > Infrastructure Preferences > General Settings and select Log enabled monitors only. Click Save.
OBM does not include any performance dashboards for SiteScope metrics. However, you can create your own performance dashboards and share them with other users.
Note If you are monitoring a CI with SiteScope and subsequently deploy additional monitors, Performance Dashboard (PD) might not show the new metric names in the UI drop-downs. OMi 10.12 with a hotfix (QCCR8D98471) or OMi 10.63 provide a Reset Data Source option for non-admin users that causes PD to reach out to SiteScope to collect updated metric meta-data to update the UI drop-downs for the selected CI. This is in contrast to the admin user’s Clear Cache option that does this for all CIs.
Multiple monitors of the same type for a monitored CI
When creating a chart in a performance dashboard, you select the SiteScope data source followed by the monitor type (class name), metric name, and instance name. This is the instance name format:
<SiteScope_ServerName>/<SiteScope_Group_Name>/<Monitor_Name>
When you want to use the same performance dashboard to display the same metrics for a different monitored CI, Performance Dashboard (PD) uses the <Monitor_Name> to find a matching instance. If the exact name does not exist, which is typically the case, it finds the first available instance. If that CI has just one monitor of that type, then it is selected. However, you may choose to have more than one monitor of the same type for a monitored CI. This can happen if you want to have two or more UNIX Resources monitors per monitored CI. In this case, to ensure PD selects the correct instance for the metrics in your chart, your monitor names must be in this format:
<Prefix name> on <hostname>
For a SiteScope template, it would be <Prefix name> on %%host%%
PD selects the instance with the same <Prefix name>.
For example, when monitoring a server named sample.domain.com with separate UNIX Resource monitors for file system usage metrics and network usage metrics, name the two monitors as follows:
File_system_usage on sample.domain.com and Network_usage on sample.domain.com
Response times when using Performance Dashboard to graph SiteScope metrics
PD retrieves data from the daily SiteScope metric log files. A busy SiteScope server can take a long time to respond with metric data since it may have to read through gigabytes of daily log files. Generally, asking metrics for a 1 to 4 hour period is very quick even on a loaded system since SiteScope can do a binary search on the log files to find out where it must sequentially read to deliver the results. On the other hand, asking SiteScope for one week of CPU metric data for a specific server will cause SiteScope to read 7 days of log files from beginning to end to extract the required metrics.
The PD response time depends on how many monitors and metrics you are collecting on your SiteScope server. You need to test your system and recommend to your end users the maximum time period that will result in a reasonable performance.
For reporting long term data for SiteScope, we recommend using the OBR Generic SiteScope Content that is available on the ITOM Marketplace.
You can create an OBM MyWorkspace page consisting of a View Explorer and an OBR graph component that will allow your end users to graph metrics over a long period of time (days, weeks, months, years). This mash-up includes the ability to drill down, drill up, and include any of the node or business application related metrics.
Enable different performance dashboards for different UNIX versions
With Operations Agents, most core OS metrics are “normalized” to a standard naming convention. As a result, performance dashboards like “System Overview Stats” can be used across a variety of OS types including Windows, UNIX, and Linux.
With SiteScope monitoring, the Windows and UNIX Resources Monitors are at the mercy of the target OS type and version for the supported metrics and the names of the metrics. Different OS types require different monitoring templates. This extends to the OBM Performance Perspective where different OS types may require different dashboards.
This presents a challenge for graphing metrics for CI instances based on the UNIX CI type. There can be only one default performance dashboard for each CI type. The problem is that it is difficult to know in advance what the proper dashboard should be. Also, the CI class model does not have a unique CI type for each UNIX variant. There are multiple possible solutions:
- You could look at the CI properties to determine the OS type and then select the most appropriate graph, but this is not a tenable solution.
- You could create a different CI subtype for each UNIX OS type (like AIX, Linux, SunOS, HP-UX, and so on). This would solve the problem but it is not a recommended solution as it would be difficult to maintain and would have ripple effects to any UCMDB integration.
The solution to this problem is to use the OBM conditional dashboard feature. A conditional dashboard allows you to specify which dashboard is the default for a given CI based on a CI attribute. Prior to OMi 10.62, only CI properties of the boolean type were supported for creating conditional dashboards. However, with OMi 10.62, you can create a conditional dashboard based on any CI property. For example OSFamily=Solaris.
The configuration steps involved are covered in detail below.
-
Create new CI attributes for the UNIX CI type (OBM 10.61 or earlier).
Go to Administration > RTSM Administration > Modeling > CI Type Manager. In the CI Type Manager, add as many new boolean attributes as required to create different dashboards. The example below shows what was done for AIX, Linux, and SunOS. Three new boolean attributes were created: isAIX, isLinux, and isSunOS. Set the default to
falseand make them both visible and editable.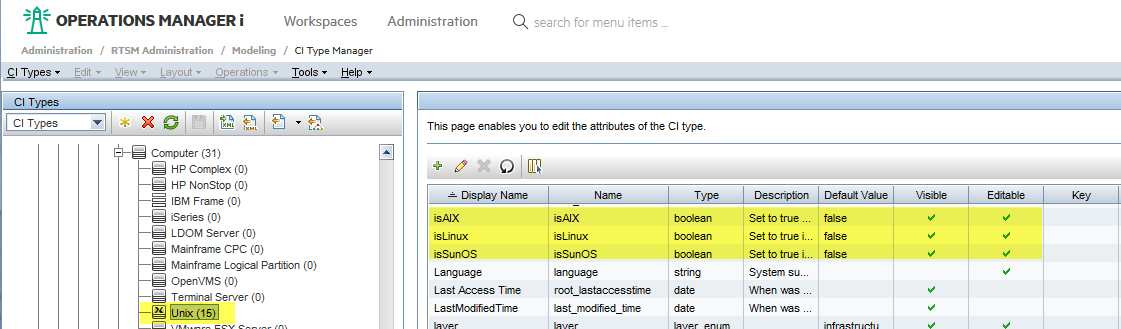
-
Create enrichment rules to set values (OBM 10.61 or earlier).
Create an RTSM enrichment rule to set the value of these new attributes. The enrichment rule conditionally sets an attribute to
truebased on some other attribute of the CI like OSFamily, OSVersion, or OSDescription.
For the detailed steps, please consult your local UCMDB/RTSM expert for assistance. -
Create your required performance dashboards.
For each of the different UNIX types, create a different performance dashboard with the metrics you require.
-
Configure the recommended and default dashboards.
Go to Administration > Operations Console > Performance Dashboard Mappings. Select the UNIX CI type on the left panel and click Edit Mappings.
Select the Recommended Dashboards option and add any dashboards you have created that should be available to the end users. It is recommended to also set a default – which is indicated by the star next to the graph below.
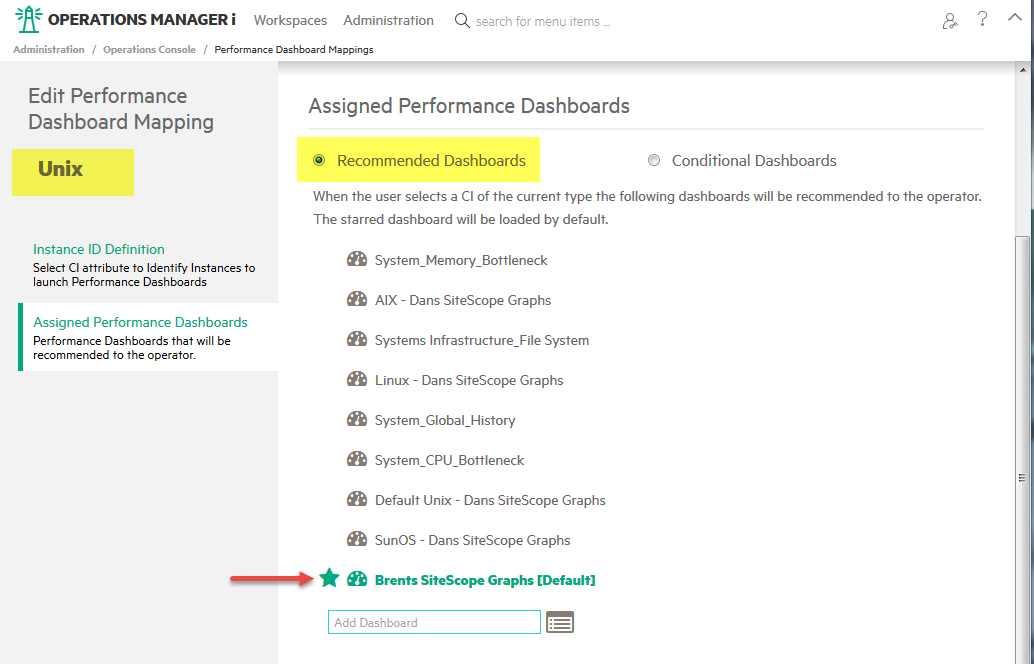
-
Configure the conditional dashboard rules.
Add a conditional dashboard rule for each of the boolean attributes you created for the UNIX CI type (OMi 10.61 or earlier) or for each OS based on an existing CI attribute (OMi 10.62 or higher). For each rule, select a dashboard as a default, even if you have only one dashboard (indicated by the red arrow below). Below are screenshots of the first rule that was created and the final settings for this example.
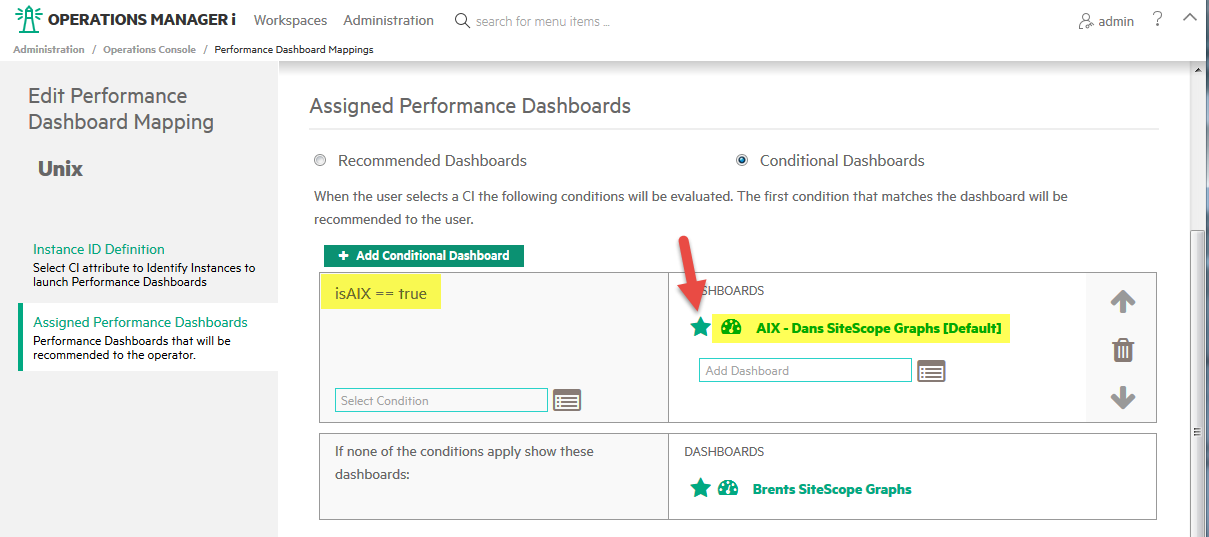
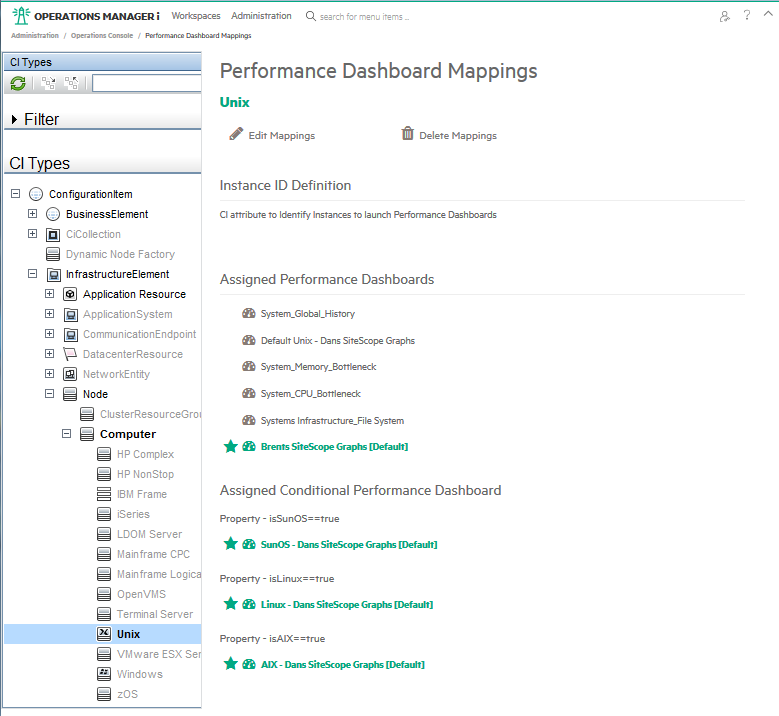
-
Demonstrate the results.
Note The example in this step is based on OBM 10.61 or earlier.
To show the end results in this example, the new boolean values are set manually for the UNIX instances.
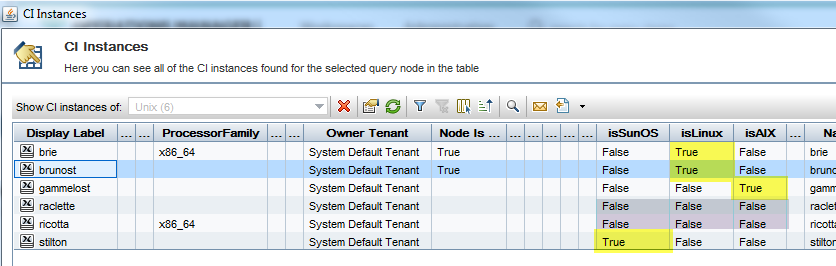
The node "stilton" draws the SunOS-specific dashboard.
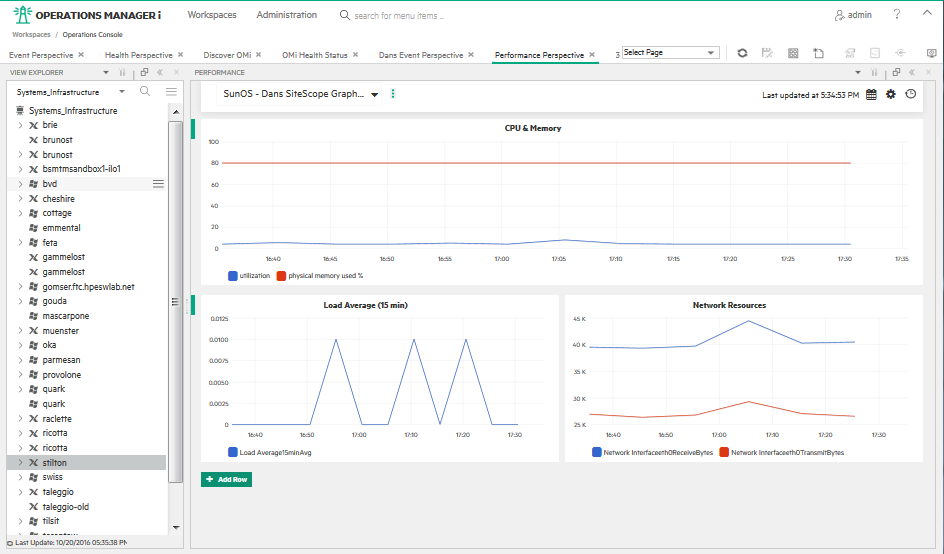
The node "gammelost" draws the AIX-specific dashboard.
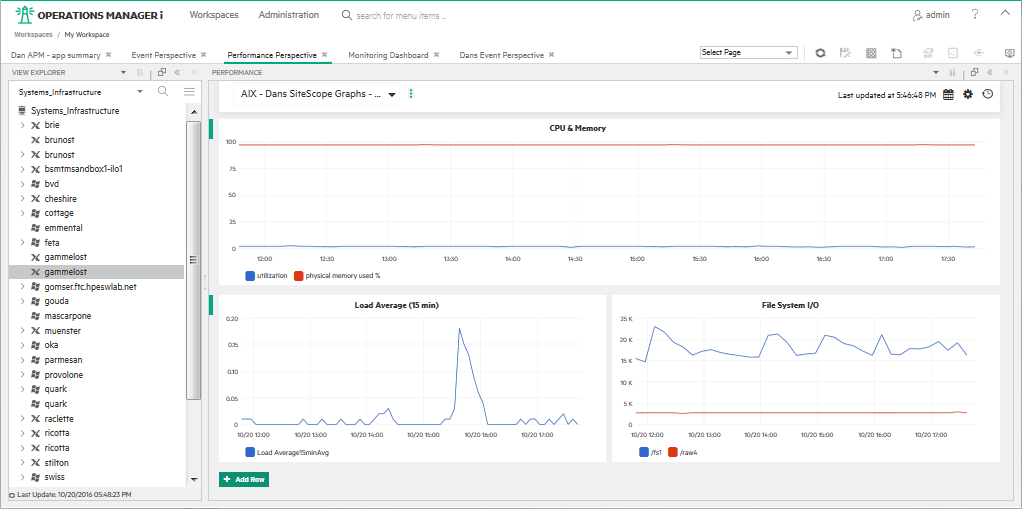
The node "ricotta" did not match any of the conditional dashboard settings and shows the default configured dashboard.
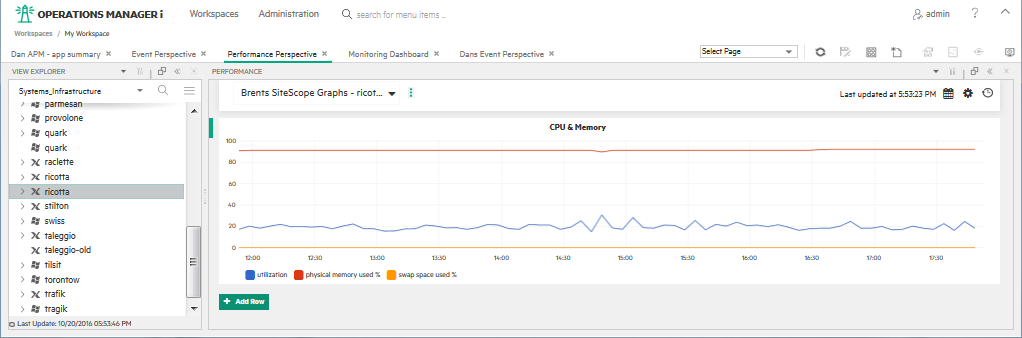
There are three ways to visualize the metrics collected by SiteScope monitors:
- OBM Performance Dashboard
- Out-of-the-box SiteScope reports provided by OBR
- Community-supported OBR Generic SiteScope Content, available on the ITOM Marketplace
The following tables compares the three different options:
| Category | OBM Performance Dashboard | Out-of-the-box OBR reports | OBR Generic SiteScope content |
|---|---|---|---|
| Support | Micro Focus supported | Micro Focus supported | Community supported |
| Data retention | < 40 days | Years, depending on space | Years, depending on space |
| Responsiveness | Responsive for short time ranges (for example a few hours). Data is retrieved from files on the SiteScope servers. | Designed to aggregate and report on large data sets. Data is stored in the OBR Vertica database. | Designed to aggregate and report on large data sets. Data is stored in the OBR Vertica database. |
| Monitor coverage |
Complete OMi 10.62 added support for graphing SiteScope Measurement type with Dynamic Monitors (e.g., Dynamic Disk Monitor, VMware) |
Small CPU, Memory, Dynamic Disk Space, Microsoft Windows Resources, Unix Resources, VMware Performance See the OBR Configuration Guide for the list of SiteScope monitors, objects, and counters. |
Large To report on URL monitors, they must be configured with a topology set to a Business Application CI. |
| Report list | None provided out-of-the-box, but dashboards are easy to create. |
Reports in the System Management content pack and VMware virtualization reporting content pack. See the OBR Configuration Guide for the list of reports. |
SiteScope Metrics by Application SiteScope Metrics by Business Service SiteScope Metrics by Server SiteScope Metrics by Monitor Instance SiteScope Metrics by Monitor Type SiteScope Metrics by CI Collection SiteScope Metrics by CI |
In OBM, create a Connected Server for the primary SiteScope server. Do not create a Connected Server for the failover SiteScope server. When a failover occurs, APM integration is automatically created on the failover server, in Preferences > Integration Preferences, with the registration details of the primary. When you switch back to the primary, the APM integration is deleted from the failover.
Note Re-Sync and Hard Re-Sync are not available at any time on the failover sever. If you try them, you get the message "Operation is not supported on Failover".
Topology integration
There is one SiteScope profile and it is known by the name of the primary. If you create monitors on the failover server during a failover, the topology synchronizes to the RTSM. When you switch back to the primary, the new monitors and their data are added as per your failover preferences.
Event integration
Regardless of whether the event comes from the primary or the failover server, the CI resolution result is the same.
If a monitor’s metric status changes when on the primary server and later this status changes again when on the failover server, the event generated on the failover will close the corresponding event that was generated on the primary based on the resolved ETI which is a Health Indicator.
If the event does not resolve to a Health Indicator, it relies on message keys which will fail to correlate by default since the SiteScope FQDN is part of the key (QCCR1I90537). The recommended workaround is to ensure that all SiteScope monitors are configured with a topology and HIs. Another option is to edit the default (or your custom) Common Event Mappings to replace the <<siteScopeHost>> part of the Key and Close Key Pattern fields with a fixed name. For example, change these:
<<siteScopeHost>>:<<monitorUUID>>:<<metric>>:<<etiValue>>:<<severity>>
<<siteScopeHost>>:<<monitorUUID>>:<<metric>>
To these:
SiS_CA:<<monitorUUID>>:<<metric>>:<<etiValue>>:<<severity>>
SiS_CA:<<monitorUUID>>:<<metric>>
SiS_CA is a string to indicate the primary/failover server pair in California.
Changes to the Common Event Mappings are synchronized between the primary and the failover server. The SiteScope Drilldown URL in the event points to the SiteScope server that sent the event.
Context menu integration
Launching the context menu Go To > Go To SiteScope on the monitored CI or the monitor CI’s HI (HI panel) is successful when the primary is active, but fails when the failover is the active SiteScope server.
SiteScope Multi-View
The SiteScope Multi-View component works with the primary SiteScope server only.
Performance dashboards
You cannot graph SiteScope performance data when the primary server is down (meaning that the failover is active). The charts display a “No data found” error.
When the primary is the active SiteScope server, the monitor data logged on the failover is synchronized back to the primary, so the performance dashboards show all the metric data from monitors running on the primary and the failover.
Monitoring Automation
OBM Monitoring Automation always selects the SiteScope server defined as the Connected Server — meaning the primary — as the node on which to deploy SiteScope monitors.
If you switch from the primary to the failover server, MA deployment jobs will fail if the agent is down or unreachable and you get an event in the browser to that effect. When the primary is available again, you can restart the deployment job.
If you switch from the primary to the failover server, MA deployment jobs will appear to be successful in the UI if the agent remains running and reachable on the primary. However, although the policy is installed and enabled on the agent, the sisconfig process on the agent fails to import the template to SiteScope. The %OvDataDir%log\system.0.en_US log file shows an error similar to the following:
Feb 10, 2017 3:37:06 PM;4;11;com.hp.ov.xpl.log.OvLogger;logMessage;com.hp.ov.opr.sisconfig;SEVERE;java.lang.Exception: Failed to import template importTemplateWithOverride(). Path: 'Deployed from HP Monitoring Automation/obm.example.com/MSSQLServer_ResponseTime (:MSSQLServer_ResponseTime)'., java.net.ConnectException: Connection refused: connect
Feb 10, 2017 3:37:06 PM;5;11;com.hp.opr.sis.config.connector.PolicyWorker;run;com.hp.ov.opr.sisconfig;SEVERE;Error during policy operation. , java.lang.Exception: Failed to import template importTemplateWithOverride(). Path: Deployed from HP Monitoring Automation/obm.example.com/MSSQLServer_ResponseTime (:MSSQLServer_ResponseTime).
This message shows that the failure occurs when importing the template which is the precursor to deploying the template to the monitored CI(s); so it does not actually show which monitored CIs are impacted. This makes it more challenging to determine what to redeploy.
Due to this, we recommend to do the following:
- Avoid deploying monitoring to SiteScope when the primary server is not running.
- Create a policy to monitor
%OvDataDir%log\system.0.en_USand generate an event for import failures.
By default, two types of daily log files are generated: v1 (legacy) and v2. If you are not using the SiteScope baselining feature, we recommend to disable the legacy daily log (v1) by setting the property _shouldLogToLegacyDailyLog=false in the <SiteScope root>\groups\master.config file.
By default, SiteScope retains daily logs for 40 days. Unless you need this for SiteScope’s own reports or to use OBM Performance Dashboard to graph a short time frame up to 40 days ago, you can reduce this to save disk space, and rely on OBR for longer term reporting.
For example, to keep 15 days of data, update the line property _dailyLogKeepDays=15 in the <SiteScope root>\groups\master.config file.
Troubleshooting
Use the following information to troubleshoot problems with your OBM-SiS integration.
The non-HTTPS SiteScope tries to communicate with HTTPS OBM via SSLv3, which is not allowed due to OBM's TLS configuration. Due to this, Apache aborts the connection attempts. If possible, switch SiteScope to HTTPS and retry the integration. If this is not possible, make sure that SiteScope and OBM exclude the same protocols and cyphers.
If you have duplicate SiteScope node CIs in the RTSM, you have to merge the CIs as follows:
-
Go to Administration > RTSM Administration > Modeling > IT Universe Manager.
-
Search for the SiteScope node CIs.
-
Select the duplicate CIs, right-click and select Merge CIs from the context menu. As the merge target, select the CI that has the FQDN as primary domain name.
Overview
Tip The following is a high-level overview of the Operations Bridge Manager - Network Node Manager i (NNMi) integration. You can find comprehensive details on NNMi integrations in the Network Node Manager i Software—Business Service Management/Universal CMDB Topology Integration Guide.
You can integrate NNMi with OBM to provide the following capabilities:
- NNMi topology > OBM RTSM topology. The topology integration populates the OBM RTSM with the NNMi network topology. OBM stores each device, interface, IP address, and a few other artifacts in the NNMi network topology as a CI and includes it in the relevant views.
-
NNMi events > OBM events. NNMi events are displayed in the Event Browser in OBM. You can also access the NNMi console from the OBM Event Browser. The NNMi events are sent to OBM by using the Operations Connector. NNMi events are automatically closed when OBM events are closed.
This integration has item ID 344 in the Integrations Catalog at the following location:
-
NNMi events > OBM health indicators. After you have set up the integration, if the NNMi events have corresponding health indicators defined, these health indicators affect the status of relevant CIs in OBM applications, such as Service Health.
-
OBM > NNMi drill down. In OBM, you can configure a link to the NNMi management server that enables you to drill down from My Workspace and other locations to NNMi, to view trace route information between the client and the destination machine. You can also use URL tools to launch a browser that enables you to connect to the NNMi management server and further analyze incoming events in NNMi.
In addition, certain NNMi user interface components (network maps, items, detailed information dialogs, and so on) can be displayed directly in Workspaces > My Workspace.
Caution In order to load NNMi components in the OBM user interface, OBM and NNMi must be hardened similarly — if OBM is set up to use HTTPS, then NNMi must also use HTTPS.
Integration
Complete the following workflow to configure and use the NNMi integration:
-
Complete prerequisites for OBM-NNMi integration
-
In NNMi, open the following file:
Windows:
C:\ProgramData\HP\HP BTO Software\nmsas\NNM\server.propertiesLinux:
/var/opt/OV/nmsas/NNM/server.propertiesChange the value of the following property to false:
nmsas.server.enable.xframeoptions.ui-web=false - Restart NNMi.
-
-
Perform the integration in NNMi
Perform the steps needed to integrate NNMi with OBM in the NNMi application.
For details, see the Network Node Manager i Software—Business Service Management/Universal CMDB Topology Integration Guide.
-
Configure LW-SSO in both OBM and NNMi
To be able to seamlessly switch between NNMi and OBM, it is recommended to use LW-SSO. Make sure that LW-SSO is configured in both OBM and NNMi with the same initString. For details on how to configure the initString in OBM, see the OBM Administration Guide. For details on how to configure the initString in NNMi, see the NNMi Deployment Reference.
It is also possible to integrate NNMi with OBM without using LW-SSO. In this case, you are prompted for a password every time you switch to an NNMi component.
-
Connect NNMi to more than one OBM instance
After connecting the first OBM instance to NNMi, NNMi stores in its own database the CI IDs gained from the topology synchronization of the OBM's RTSM. When another OBM instance is connected, another topology synchronization is carried out. As the OBM instances might contain some of the same CI IDs, the IDs need to be reconciled in the NNMi database. This reconciliation works only partially and the NNMi log files still include several reconciliation errors that are caused by the non-existing RTSM IDs. To fix the problem, perform the following steps:
-
Change the integration to the new OBM system.
-
Log on to the NNMi JMX console http://<NNMi_fqdn_and_port>/jmx-console using the system account and password.
-
Go to mbean NnmBsmModule.
-
Run java.lang.String resetNnmBsmIds().
-
Disable and enable the topology integration to get the CIs into RTSM.
You should see a list of devices from which the RTSM ID was removed.
-
-
Configure OBM to display NNMi data
To display NNMi data in OBM and to access the NNMi components in Workspaces > My Workspace:
-
Open Infrastructure Settings:
Administration > Setup and Maintenance > Infrastructure Settings
-
Select Foundations.
-
Select Integrations with other applications.
-
In the Integrations with other applications - NNM table, locate and modify the following parameters:
-
NNM Integration URL. The NNMi host and port number (protocol://host:port/nnm).
-
NNM UI drilldown use global CI ID. Set to
trueif the NNMi topology integration is synchronized to a different RTSM or UCMDB.
Users are authenticated by LW-SSO, but an internal user is required.
-
-
Results
You can view NNMi data in Workspaces > My Workspace, as follows:
Note Make sure you have a View Explorer component configured in addition to the new NNMi component. The View Explorer component pulls the node information needed by the NNMi component. For more information on the View Explorer component, see the OBM User Guide.
- Click the New Page icon.
- Click Add Component. The Component Gallery window opens.
- In All Categories, select the NNMi check box.
To access the NNMi components, you must have the appropriate licenses installed. NNMi components are only displayed if you configured a connection to an NNMi server in Infrastructure Settings:
Administration > Setup and Maintenance > Infrastructure Settings
Select Foundations > Integrations with other applications > NNM
Component Name
Description
All Open Key Incidents Shows the incidents that are most important to network operators and that often require more immediate action.
Layer 2 Neighbor View Shows a map view of a selected device and its connector devices within a specified number of hops from the selected device. This view is useful for understanding the switch connectivity between devices.
Layer 3 Neighbor View Shows a map view of a selected device and its connector devices within a specified number of hops from the selected device. This view is useful for understanding the router connectivity between devices.
MPLS VPN Inventory This is an enterprise customer view of how their sites are connected via service provided MPLS networks.
Overall Network Health Shows the overall network health. Overall Network Health (Node Group Overview) Displays a map containing all (top-level) Node Groups that do not have parent Node Groups.
Path View Displays a path view map that traverses undiscovered regions of your network. A Path View map is useful when you have two or more areas of your network which are separated by undiscovered devices, such as service provider nodes. Router Redundancy Groups Inventory Shows the available Router Redundancy Groups created by the NNMi administrator. Each Router Redundancy Group is a set of two or more routers that use one or more virtual IP addresses to help ensure that information packets reach their intended destination.
Overview
Operations Manager (OM) can be integrated into your OBM environment to become a data source for OBM. OM for Windows, OM for UNIX (HP-UX and Solaris), and OM for Linux are supported.
After you install both OBM and OM, follow the described procedures to connect OBM and OM. This connection enables bidirectional synchronization of events between the two systems, tool execution, and instruction text retrieval. The connection configuration requires you to establish a trust relationship between the OBM and OM systems, as well as to configure a message forwarding policy.
The integration between OBM and OM provides you with the following capabilities:
-
OM events > OBM. Events from OM are displayed in the OBM Event Browser.
-
OM events > OBM health indicators. After you set up the integration, if the OM events have corresponding health indicators defined, these health indicators automatically affect the status of the relevant Configuration Items (CIs) in OBM applications such as Service Health. For an introduction to health indicators, see the OBM User Guide.
-
OBM Actions, Tools, and Instructions. You can specify tools, for example, to ping a system. These tools are launched from events or the Actions panel and run on the associated CI. The tools are designed to help users solve common problems quickly and efficiently. All available tools are launched in the context of a CI. The selection of tools a particular user sees in context menus depends on the tools that are available for the CI affected by a particular event.
Events received in the OBM Event Browser may contain event-related actions configured in OM. If event-related actions exist, you can run these actions from the OBM console. OM actions can be either operator-initiated, or can run automatically when an event occurs. For a complete overview of available actions and how to run them, see OBM Help.
Operators working with the OM message browser can see additional instructions for the selected message. It is equally helpful for OBM operators to be able to access this information when using OM servers to forward events to OBM. This information is displayed in the Instructions tab of the Event Browser. For details, see the OBM User Guide.
-
OM topology > RTSM topology. The OM topology can synchronize with the OBMRTSM topology. Using topology synchronization, the OM services are synchronized with OBM, and by using corresponding mapping rules, they are transformed into CIs stored in the RTSM. For details, see the OBM Administration Guide.
Note If the OM topology is not synchronized with the RTSM topology by using the OBM topology synchronization mechanism, the Monitored by property of the OBM CIs corresponding to the OM services may be empty. As a consequence, these CIs are not displayed in the System Monitors only Perspective, System Hardware Monitoring, and System Software Monitoring views.
Integration
Complete the following workflow to configure and use the OM integration:
-
Set up OBM in an environment managed by OM
To set up OBM in an environment managed by OM, follow these steps:
-
Before installing OBM, run the following command on all data processing servers and gateway servers:
ovconfchg -ns sec.cm.client -set CERTIFICATE_SERVER <FQDN of primary DPS> -
Install and configure OBM according to the OBM Installation and Upgrade Guide.
-
Integrate OM as described in the following steps.
Optional. Set up forwarding targets for OM agent node creation
To ensure that events are assigned to the correct CIs, the nodes in the OBM RTSM or UCMDB need to be synchronized with the OM node bank(s). You can use the OM Agent Node Creation Forwarding Targets infrastructure setting to forward topology data from operations agents monitored by OBM to a specified OM for LinuxWindows server(s). After the topology information is forwarded from OBM, a node is created in the OM for LinuxWindows server. The platform of the synchronized node is displayed as
otherin OM for Linuxn/ain OM for Windows.To set up a forwarding target for the creation of an agent node, edit the OM Agent Node Creation Forwarding Targets infrastructure setting:
-
In OBM, navigate to
Administration > Setup and Maintenance > Infrastructure Settings
-
Select Applications and use the list to select the Operations Management context. Scroll down to Operations Management - HPEOM Topology Synchronization Settings.
-
Next to the OM Agent Node Creation Forwarding Targets setting, click Edit.
-
Enter your target server in the Value field.
If you want to enter more than one target server, separate them with a semi-colon.
-
Click OK to save.
-
-
Establish a trust relationship for a server connection
For connection and communication between OBM and OM hosts, you must establish a trust relationship between the systems.
In OM server pooling, the virtual server must have a certificate that is trusted by all OM hosts in the server pool and by all OM hosts.
Note The trust relationship must be set up on all nodes (data processing servers, gateway servers, manager-of-manager configurations, load balancers, and reverse proxies). However, some load balancer technologies include a by-pass or pass-through functionality for incoming encrypted messages to its pool members. When using such technologies, the trust relationship on the load balancer node is not required if you are load balancing on the recommended OSI layer 2 or 4.
To establish a trust relationship between the data processing servers and external server systems, do the following:
-
On the OBM data processing server, execute the following command:
<OBM_HOME>/opr/bin/BBCTrustServer[.bat|sh] <external_server>Replace
<external_server>with the FQDN of the external system (for example,ommgmtsv).Note The value of
<external_server>should be the virtual name if the OM server is part of a server pool or runs in a high-availability (HA) cluster.When asked to add a certificate to the trust store, enter y.
If the trusted certificate already exists, the tool asks you if you want to overwrite the existing certificate. To replace the existing certificate with a new one, enter y.
-
OM servers only:
Note If you have the appropriate OM patch or version, you can skip this step.
- OM for Windows: Starting with patches OMW_00121 (32-bit) and OMW_00122 (64-bit), the
BBCTrustServertool is already installed in the%OvInstallDir%\contrib\OVOWfolder. - OM for UNIX or Linux: Starting with OM server version 9.10.220, the
BBCTrustServertool is already installed in the/opt/OV/bindirectory.
-
Locate the following files on the OBM data processing server:
<OBM_HOME>/opr/lib/cli/opr-cli.jar<OBM_HOME>/opr/bin/BBCTrustServer.bat<OBM_HOME>/opr/bin/BBCTrustServer.sh -
Copy the files to the machine that is running the OM for Windows management server.
Copy
opr-cli.jarto%OvInstallDir%\java\opr-cli.jar.Copy
BBCTrustServer.batto%OvBinDir%\BBCTrustServer.bat. -
OM for UNIX and Linux only: Copy the files to the machine that is running the OM for UNIX or Linux management server.
Copy
opr-cli.jarto/opt/OV/java/opr-cli.jar.Copy
BBCTrustServer.shto/opt/OV/bin/BBCTrustServer.sh.Change the permissions of the
BBCTrustServertool by entering the following command:chmod 555 /opt/OV/bin/BBCTrustServer.sh
- OM for Windows: Starting with patches OMW_00121 (32-bit) and OMW_00122 (64-bit), the
-
If you do not have a load balancer or a reverse proxy, or your load balancer is configured to work on OSI layers 2 or 4 (recommended), execute the following command on the external system:
BBCTrustServer.[bat|sh] <load_balancer_or_single_gateway_server_or_RP_or_Server_Pool_Virtual_Interface>
When asked to add a certificate to the trust store, enter y.
If the trusted certificate already exists, the tool asks you if you want to overwrite the existing certificate. To replace the existing certificate with a new one, enter y.
-
If you are using a reverse proxy or your load balancer is configured to work on OSI layer 7, you must exchange the certificates manually:
-
On the OBM data processing server, execute the following command:
ovcert -exporttrusted -file <obm.cer>
-
On the external system, execute the following command:
ovcert -exporttrusted -file <other.cer>
-
Copy
<other.cer>from the external system to the OBM data processing server. -
Copy
<obm.cer>from the OBM data processing server to the external system. -
On the OBM data processing server, execute the following commands:
ovcert -importtrusted -file <other.cer>
ovcert -importtrusted -file <other.cer> -ovrg server
-
On the external system, execute the following commands:
ovcert -importtrusted -file <obm.cer>
ovcert -importtrusted -file <obm.cer> -ovrg server
-
-
If you are using a load balancer or a reverse proxy, where your data sources are not communicating directly with the OBM gateway servers, make sure that port 383 is routed through the load balancer to the OBM gateway servers.
If the load balancer or the reverse proxy is configured to pass through traffic directly (OSI layers 2 or 4), skip to the next step. If configured to work on OSI layer 7, perform as follows:
-
The certificate on the load balancer must be installed for port 383 (or the port that you configured for secure communication).
-
Communication between the load balancer and the gateway server systems must be secured.
-
The load balancer must possess a server certificate for authentication so that the external systems can connect successfully. The load balancer must also validate client certificates presented by external clients (for example, OM servers).
-
The load balancer must possess a client certificate for authentication with OBM.
-
Issue a certificate for the load balancer from the OBM data processing server:
ovcm -issue -file <certificate file> -name <Fully Qualified Domain Name of Virtual Interface or Reverse Proxy> [ -pass <passphrase>]
-
Import this certificate as a server and client certificate into your load balancer.
For details on the required format, see your load balancer documentation. You can use
opensslto convert the certificates into the required format.
-
-
-
Verify the trusted relationship
After establishing a trust relationship between the OBM data processing server and external systems, check the connection between the two systems. You can do this wile setting up your connected server by clicking Run Test or by using the command line interface.
To check the connection between the OBM server environment and an external system by using the command line interface, do the following:
-
From the external host, verify that communication to the OBM installation is possible (the return value should be
eServiceOk) by executing the following command on the external server system:bbcutil -ping https://<load_balancer_or_single_gateway_server_or_RP_or_Server_Pool_Virtual_Interface>
When done between management servers, add the -ovrg server option to esure the server certificate is used instead of the node certificate, as follows:
bbcutil -ovrg server -ping https://<load_balancer_or_single_gateway_server_or_RP_or_Server_Pool_Virtual_Interface>
Example of the command result:
https://<OBM servername>: status=eServiceOK
coreID=7c66bf42-d06b-752e-0e93-e82d1644cef8 bbcV=06.10.105
appN=ovbbccb appV=11.03.031 conn=1 time=1094 ms -
From all OBM gateway server hosts, verify that communication with the external server host is possible (the return value should be
eServiceOk) by executing the following command:bbcutil -ping https://<external server hostname>
When done between management servers, add the -ovrg server option to esure the server certificate is used instead of the node certificate, as follows:
bbcutil -ovrg server -ping https://<external server hostname>
Example of the command result:
https://<external_host_server_name>: status=eServiceOK
coreID=0c43c032-5c94-7535-064a-f7654a86f2d3 bbcV=06.10.070
appN=ovbbccb appV=11.03.031 conn=7 time=140 msNote
If the
bbcutil –pingcommand executes but does not returneServiceOk, you may need to restart theovcprocesses on the system that is not responding by running the following command on the OM side:/opt/OV/bin/ovc –killand/opt/OV/bin/ovc –start-
ovc –killandovc –start
-
-
Create a connection to an OM server
OBM can run actions and tools on the OM server, and retrieve instructions from the OM server. Credentials for the OM web service are required for this processing.
-
In OBM, navigate to Administration > Setup and Maintenance > Connected Servers, click New and select Operations Manager for UNIXOperations Manager for Windows. Alternatively, you can click New in the Operations Manager for UNIXOperations Manager for Windows area in the right pane.
The Create Operations Manager for UNIX ServerCreate Operations Manager for Windows Server panel opens.
-
In the General section, enter a display label, an identifier (a unique internal name if you want to replace the automatically generated one), and, optionally, a description of the connection being specified.
-
In the Server Properties section, complete the following information:
-
Enter the fully qualified domain name of the host system of the OM server.
Note If the host system is a high-availability cluster, enter the fully qualified domain name of the cluster package where the OM server is installed. If OM is installed in a server pooling environment, add the virtual interface as the first OM server. Add all physical pool servers separately as connected servers.
-
Enter the name of the integration user that is used to log in to the OM server.
For OM for Windows servers, specify both the domain to which the host system belongs and the user name:
<DOMAIN>\<user name>. If the host system is not part of a domain, replace<DOMAIN>with the host name of the system.Micro Focus recommends to use a dedicated user so that it is clear which events are owned by and being worked on in OBM.
Note All messages forwarded from OM systems are treated as allowing read and write. Any changes made to these events result in back synchronization to the originating OM server.
- For OM for Windows, the selected user must have at least PowerUser rights and must be a member of the HP-OVE-Admins group and the local administrators group (for example, HP-OVE-User).
- For OM for UNIX or Linux, only the Integration User (opc_adm) has the necessary OM administrator rights to be able to synchronize topology and execute tools.
- If you want to specify a user name that is different from opc_admin for synchronizing events, you can create two connected servers, one for the web services that handle actions, tools and instructions as the opc_adm user, and another that references the connected server with another user name.
-
Select the Enable sending event updates to the Operations Manager for UNIX serverEnable sending event updates to the Operations Manager for Windows server check box if you want to forward enable synchronization of event changes from OBM to OM. For example, if OM forwards a message to OBM and OBM changes it, then the changes are synchronized back to OM.
-
Optional. Customize the way events and change notifications are delivered to this server by using Advanced Delivery Options:
(missing or bad snippet) -
Select the Forward dynamic topology check box if you want to forward dynamic topology information from the OBM instance to which you are logged in, to the OM instance that you are currently configuring.
(missing or bad snippet)Important In most cases, you should leave the Forward dynamic topology check box clear. Otherwise, OBM will resend the topology data received from one OM server to the rest of the OM servers. This may lead to unexpected consequences on OM servers (for example, a deleted node on an OM server may reappear after some time, or new nodes may appear on an OM server after you add a node by using a data collector, such as SiteScope).
-
-
In the Outgoing Connection section, complete the following information:
Note If you are editing outgoing connection properties, you must restart the MercuryAS process for the changes to take effect.
-
Select Use this server if you are using this server for receiving instructions, and executing tools and actions on external nodes, and then follow these steps:
-
Enter the password for the integration user.
- Enter the port required to access the server for receiving instructions, and executing tools and actions. The default port value is automatically inserted and can be restored by clicking Set default port.
-
Optional. If you are using secure communication (default), make sure that the Use secure HTTP check box is selected, and then apply a certificate by clicking import the certificate and using one of the following methods:
-
Connect and Import from Server: Retrieves a certificate from the host system specified in this server connection.
-
Import from File: Opens the file browser and enables you to navigate to and specify a Base64 Encoded X.509 certificate file for the server connection.
Note In a clustered OM for Windows environment, the IIS web server on all cluster nodes must have the same certificate. If different, valid certificates are used, problems such as tools execution may be experienced after switching to a node with a different certificate. For more details, see the article available at https://softwaresupport.hpe.com/km/KM01211399.
-
-
-
Select Use other server if you are using an alternative server for providing instructions, and executing actions and tools, and then select a server from the list. For the physical servers in a server pooling environment, select the virtual interface connected server.
Note Avoid selecting an alternative action execution server that creates a loop and results in specifying the connected server as the action execution server.
-
-
In the Test Connections section, click Run Tests to check that the specified connection attributes are correct. If an error message is displayed, correct the connection information, and retest the connection. Check
<OBM_HOME>/log/jboss/opr-webapp.logon the gateway server for more information if the test fails. -
Make sure that the Activate after save check box is selected if you want to enable the server connection immediately.
-
Click Create.
-
-
Configure topology synchronization
After ensuring that the OM server is added to OBM as a connected server, configure the forwarding of topology (node and service) data on the OM server.
Configure topology synchronization on OM for Windows systems
This section describes how to configure topology synchronization on OM for Windows management servers. For further details, see the OM for Windows documentation.
To forward topology data to OBM, complete the following steps on the OM for Windows management server from which you want to receive topology information:
-
Prerequisite. Make sure that the minimum patch level for the OM for Windows management server is installed:
-
Version 8.16: Patch OMW_00121 or superseding patch
-
Version 9.00: Patch OMW_00122 or superseding patch
-
-
Prerequisite. Configure trusted certificates for multiple servers.
If you plan to forward topology to multiple destinations, each target (or destination) server must have trust configured with the OM server.
-
In the console tree, right-click Operations Manager, and then click Configure > Server.... The Server Configuration dialog box opens.
-
Click Namespaces, and then click Discovery Server. A list of values appears.
-
Add the hostname of the gateway server or load balancer to List of target servers to forward discovery data. If there is more than one target server, separate the hostnames with semicolons, for example:
server1.example.com;server2.example.comIf the target server uses a port other than port 383, append the port number to the hostname, for example:
server1.example.com:65530;server2.example.com:65531 -
Make sure that the value of Enable discovery WMI listener is true. This is the default value.
-
Click OK to save your changes and close the Server Configuration dialog box.
-
Restart the
OvAutoDiscovery Serverservice for your changes to take effect:net stop "OvAutoDiscovery Server"net start "OvAutoDiscovery Server" -
Start the initial synchronization of topology data:
-
In the console tree, select Tools > HP Operations Manager Tools.
-
Right-click Synchronize Topology and select All Tasks > Launch Tool....
The
startInitialSync.battool is started and begins to send all the topology data to the configured target management servers.
-
Migrate from scheduled synchronization on OM for Windows systems
This section describes how to migrate from scheduled synchronization on OM for Windows management servers. For further details, see the OM for Windows documentation.
To migrate from scheduled synchronization, complete the following steps on the OM for Windows management server from which you want to receive topology information:
-
Prerequisite. Make sure that the minimum patch level for the OM for Windows management server is installed:
-
Version 8.16: Patch OMW_00121 or superseding patch
-
Version 9.00: Patch OMW_00122 or superseding patch
-
-
Clear the agent repository cache on the OM management server by using the following command:
%OvBinDir%\ovagtrep -clearall -
Remove the service auto-discovery policies from the OM management server node:
%OvBinDir%\ovpolicy -remove DiscoverOM%OvBinDir%\ovpolicy -remove DiscoverOMTypes -
Synchronize the policy inventory on the OM management server:
-
In the console tree, right-click the management server.
-
Select All Tasks > Synchronize inventory > Policies.
The management server creates a deployment job to retrieve the inventory from the local agent.
-
-
Make sure the listener process is running:
-
In the console tree, right-click Operations Manager, and select Configure Server.
-
Click Namespaces, and select Discovery Server.
-
Set the value of Enable discovery WMI listener to true. This is the default value.
-
Click OK to save your changes and close the Server Configuration dialog box.
-
Restart the
OvAutoDiscovery Serverservice for your changes to take effect:
The Server Configuration dialog box opens.
A list of values appears.
net stop "OvAutoDiscovery Server"net start "OvAutoDiscovery Server" -
-
Start the initial synchronization of topology data:
-
In the console tree, select Tools > HP Operations Manager Tools.
-
Right-click Synchronize Topology and select All Tasks > Launch Tool....
The
startInitialSync.battool is started and begins to send all the topology data to the configured target servers. -
Configure topology synchronization on OM for UNIX or Linux systems
This section describes how to configure topology synchronization on OM for UNIX or Linux management servers. For further details, see the OM for UNIX or Linux documentation.
To forward topology data to OBM, complete the following steps on the OM for UNIX or Linux management server from which you want to receive topology information:
-
Prerequisite. Make sure that the minimum patch level for the OM 9.10 for UNIX or Linux management server is installed:
- HP-UX: Patch
PHSS_42736or superseding patch - Linux: Patch
OML_00050or superseding patch - Solaris: Patch
ITOSOL_00772or superseding patch
- HP-UX: Patch
-
Prerequisite. Configure trusted certificates for multiple servers.
In an environment with multiple servers, you must configure each server to trust certificates that the other servers issued.
-
Prerequisite. Set up the forwarding target (OBM Gateway Server, Reverse Proxy, or Load Balancer) in the node bank as a managed node. To do so, run the following command:
/opt/OV/bin/OpC/utils/opcnode -add_node node_name=<node_name> net_type=NETWORK_IP mach_type=<machine_type> group_name=<group_name> node_label=<node_name>
In this instance,
<machine_type>relates to the operating system of the OBM host system,MACH_BBC_WIN2K3_X64(Windows) orMACH_BBC_LX26RPM_X64(Linux), whereas<group_name>relates to the operating system of the OM server host system,hp_ux,solaris, orlinux. -
Type the following command to enable topology synchronization:
/opt/OV/contrib/OpC/enableToposync.sh -online -target <comma_separated_server_list>Replace
<comma_separated_server_list>with the fully qualified domain name of the target management server. If you have more than one target management server, separate each server name with a comma (,). Do not include spaces in the server list.This command restarts the service discovery server. The source management server begins to send any topology data changes immediately.
-
Type the following command to start the initial synchronization of topology data:
/opt/OV/bin/OpC/startInitialSync.sh
Migrate from scheduled synchronization on OM for UNIX or Linux Systems
This section describes how to migrate from scheduled synchronization on OM for UNIX or Linux management servers. For further details, see the OM for UNIX or Linux documentation.
To migrate from scheduled synchronization, complete the following steps on the OM for UNIX or Linux management server from which you want to receive topology information:
-
Prerequisite. Make sure that the minimum patch level for the OM 9.10 for UNIX or Linux management server is installed:
- HP-UX: Patch
PHSS_42736or superseding patch - Linux: Patch
OML_00050or superseding patch - Solaris: Patch
ITOSOL_00772or superseding patch
- HP-UX: Patch
-
Clear the agent repository cache on the management server by using the following command:
/opt/OV/bin/ovagtrep -clearall -
Remove the service auto-discovery policies from the management server node:
/opt/OV/bin/ovpolicy -remove DiscoverOM/opt/OV/bin/ovpolicy -remove DiscoverOMTypes -
Deassign the service auto-discovery policies from the management server node:
/opt/OV/bin/OpC/utils/opcnode -deassign_pol node_name=<management_server> net_type=NETWORK_IP pol_name=DiscoverOMTypes pol_type=svcdisc/opt/OV/bin/OpC/utils/opcnode -deassign_pol node_name=<management_server> net_type=NETWORK_IP pol_name=DiscoverOM pol_type=svcdisc/opt/OV/bin/OpC/opcragt -dist <management_server>Replace
<management_server>with the name of the management server. -
Type the following command to enable topology synchronization:
/opt/OV/contrib/OpC/enableToposync.sh -onlineThis command restarts the service discovery server. The source management server begins to send any topology data changes immediately.
-
Type the following command to start the initial synchronization of topology data:
/opt/OV/bin/OpC/startInitialSync.sh
-
-
Configure the OM for WindowsLinux forwarding policy
To enable event synchronization between OM and OBM, set up a message forwarding policy on the OM server. The policy includes the node name of the target OBM server. Alternatively, specify the load balancers, if configured, or one Gateway Server for each OBM installation, as appropriate for your high-availability arrangement.
Before setting up a policy and to avoid overwriting the current settings, verify if a policy of the type Server-based Flexible Management is already active on the OM for Windows server. If a policy does not exist, create a new policy as described in Create a New Policy. If a policy already exists and is active, adapt the policy as described in Adapt an Active Policy.
Create a New Policy
To set up a new policy on OM for Windows, complete the following steps:
-
Start the OM for Windows console as follows:
Start > Programs > HP > HP Operations Manager
-
In the left pane of the OM for Windows console, select the following:
Policy management > Policies grouped by type > Server Policies > Server-based Flexible Management
-
Verify that no Server-based Flexible Management policy exists. If such a policy does exist, go to Adapt an Active Policy.
-
Right-click Server-based Flexible Management (or a blank space in the right pane), and then select New > Policy.
The Server-based Flexible Management Editor dialog box opens.
-
In the General tab text pane, insert the following policy text:
TIMETEMPLATES
# none
RESPMGRCONFIGS
   RESPMGRCONFIG DESCRIPTION "Forward all messages to OBM"
   SECONDARYMANAGERS
   ACTIONALLOWMANAGERS
   MSGTARGETRULES
      MSGTARGETRULE DESCRIPTION "Forward all messages rule"
         MSGTARGETRULECONDS
         MSGTARGETRULECOND DESCRIPTION "Forward all messages"
         MSGTARGETMANAGERS
            MSGTARGETMANAGER
            TIMETEMPLATE "$OPC_ALWAYS"
            OPCMGR IP 0.0.0.0 "<OBM fully qualified host name>"
Note This forwards all messages to OBM. If you want to reduce the number of messages to be sent, modify the text of the policy so that only a selected subset of messages is sent to OBM. For details, see the OM documentation.
-
Replace
<OBM fully qualified host name>in the policy text with the fully qualified hostname of the Gateway server to receive OM messages (for example,GwSrv.example.com).In deployments involving a load balancer, a NAT device, or a reverse proxy, use the fully qualified hostname of the system used to access the Gateway server (for example,
VirtualSrv.example.com). -
Click Check Syntax to check for syntax errors in the new policy text.
-
After correcting any syntax errors, click Save and Close.
-
In the Save As dialog box that opens, enter a name and a description for the new policy.
-
Click OK to close the Save As dialog box.
-
From the Policy Management folder, right-click the policy, and the select All Tasks > Deploy on.
-
In the Deploy server policy on dialog box that opens, select the name of your OM management server.
-
Click OK to deploy the server-based flexible management policy on the OM for Windows management server.
Adapt an Active Policy
If a message forwarding policy already exists on the OM for Windows system, complete the following steps to edit this policy and add another message target manager to it:
-
Start the OM for Windows console as follows:
Start > Programs > HP > HP Operations Manager
-
In the left pane of the OM for Windows console, select the following:
Policy management > Server policies grouped by type > Server-based Flexible Management
-
In the right pane of the OM for Windows console, double-click the existing policy that you want to edit. The Server-based Flexible Management Editor dialog opens.
If such a policy does not exist, go to Create a New Policy.
-
Add another message target manager as shown in the following example policy text:
TIMETEMPLATES
# none
RESPMGRCONFIGS
   RESPMGRCONFIG DESCRIPTION "Forward all messages to OBM"
   SECONDARYMANAGERS
   ACTIONALLOWMANAGERS
   MSGTARGETRULES
      MSGTARGETRULE DESCRIPTION "Forward all messages rule"
         MSGTARGETRULECONDS
         MSGTARGETRULECOND DESCRIPTION "Forward all messages"
         MSGTARGETMANAGERS
            MSGTARGETMANAGER
            TIMETEMPLATE "$OPC_ALWAYS"
            OPCMGR IP 0.0.0.0 "<First Target Manager>"
MSGTARGETMANAGER TIMETEMPLATE "$OPC_ALWAYS" OPCMGR IP 0.0.0.0 "<OBM fully qualified host name>"Note This forwards all messages to OBM. If you want to reduce the number of messages to be sent, modify the text of the policy so that only a selected subset of messages is sent to OBM. For details, see the OM documentation.
-
Replace
<OBM fully qualified host name>in the text with the fully qualified hostname of the Gateway server that should receive OM messages (for example,GwSrv.example.com).In deployments involving a load balancer, a NAT device, or a reverse proxy, use the fully qualified hostname of the system used to access the Gateway server (for example,
VirtualSrv.example.com). -
Click Check Syntax to check for syntax errors in the new policy text.
-
After correcting any syntax errors, click Save and Close.
- Redeploy the server-based flexible management policy on the OM for Windows management server.
To enable event synchronization between OM and OBM, you must set up a message forwarding policy on each OM management server with the node name of the load balancer, if configured, or one Gateway Server, as appropriate for your high-availability arrangement.
Before setting up a policy, make sure that the forwarding target is set up as a node (see Set up a Forwarding Target in the OM for UNIX or Linux Node Bank). In addition, verify if the msgforw policy is already active on the OM for UNIX or Linux server. If the msgforw does not exist, create a new policy as described in Create a New Policy. If the msgforw policy already exists and is active, adapt the policy as described in Adapt an Active Policy.
Set up a Forwarding Target in the OM for UNIX or Linux Node Bank
The forwarding target (OBM Gateway Server, Reverse Proxy, or Load Balancer) must be set up in the node bank as a managed node. You must add the managed node and put it in a node group by using the
opcnodecommand line tool:/opt/OV/bin/OpC/utils/opcnode -add_node node_name=<node_name> net_type=NETWORK_IP mach_type=<machine_type> group_name=<node_group_name> node_label=<node_name>
In this instance,
<machine_type>relates to the operating system of the OBM host system,MACH_BBC_WIN2K3_X64(Windows) orMACH_BBC_LX26RPM_X64(Linux).<group_name>is the name of a node group, which can be an operating system name likelinux, or any other name.To verify that the node was added successfully, run the following command:
/opt/OV/bin/OpC/utils/opcnode -list_nodesCreate a New Policy
To set up a new message forwarding policy on OM for UNIX or Linux, complete the following steps:
-
Change to the
work_respmgrsdirectory as follows:cd /etc/opt/OV/share/conf/OpC/mgmt_sv/work_respmgrs/
Note Policy template files can be found in /etc/opt/OV/share/conf/OpC/mgmt_sv/tmpl_respmgrs.
-
Create a new policy file by using the following command:
vi <policy file name>
-
Insert the following text into the new policy file:
TIMETEMPLATES
# none
RESPMGRCONFIGS
   RESPMGRCONFIG DESCRIPTION "Forward all messages to OBM"
   SECONDARYMANAGERS
   ACTIONALLOWMANAGERS
   MSGTARGETRULES
      MSGTARGETRULE DESCRIPTION "Forward all messages rule"
         MSGTARGETRULECONDS
         MSGTARGETRULECOND DESCRIPTION "Forward all messages"
         MSGTARGETMANAGERS
            MSGTARGETMANAGER
            TIMETEMPLATE "$OPC_ALWAYS"
            OPCMGR IP 0.0.0.0 "<OMi fully qualified host name>"
Note This forwards all messages to OBM. If you want to reduce the number of messages to be sent, modify the text of the policy so that only a selected subset of messages is sent to OBM. For details, see the OM documentation.
-
Replace
<OBM fully qualified host name>in the text with the fully qualified hostname of the Gateway server that should receive OM messages (for example,GwSrv.example.com).In deployments involving a load balancer, a NAT device, or a reverse proxy, use the fully qualified hostname of the system used to access the Gateway server (for example,
VirtualSrv.example.com). -
Enter the following command to check for syntax errors in the new policy text:
/opt/OV/bin/OpC/opcmomchk -msgforw <policy file name>
-
After correcting any syntax errors, copy the policy to the msgforw policy file in the respmgrs directory as follows:
cp <policy file name> /etc/opt/OV/share/conf/OpC/mgmt_sv/respmgrs/msgforw
-
Inform the server processes to reread the configuration as follows:
/opt/OV/bin/ovconfchg
Message forwarding from OM to OBM is now configured and enabled.
Adapt an Active Policy
If the message forwarding policy already exists on the OM for UNIX or Linux system, complete the following steps to edit this policy and add another message target manager to it:
-
Change to the
work_respmgrsdirectory as follows:cd /etc/opt/OV/share/conf/OpC/mgmt_sv/work_respmgrs/
Note Policy template files can be found in /etc/opt/OV/share/conf/OpC/mgmt_sv/tmpl_respmgrs/.
-
Edit the existing policy to which you want to add the OBM server as a target as follows:
vi <policy file name>
-
Add another message target manager as shown in the following policy text:
# none
RESPMGRCONFIGS
   RESPMGRCONFIG DESCRIPTION "Forward all messages to OBM"
   SECONDARYMANAGERS
   ACTIONALLOWMANAGERS
   MSGTARGETRULES
      MSGTARGETRULE DESCRIPTION "Forward all messages rule"
         MSGTARGETRULECONDS
         MSGTARGETRULECOND DESCRIPTION "Forward all messages"
         MSGTARGETMANAGERS
            MSGTARGETMANAGER
            TIMETEMPLATE "$OPC_ALWAYS"
            OPCMGR IP 0.0.0.0 "<First Target Manager>"
MSGTARGETMANAGER TIMETEMPLATE "$OPC_ALWAYS" OPCMGR IP 0.0.0.0 "<OBM fully qualified host name>"Note This policy forwards all messages to OBM. If you want to reduce the number of messages to be sent, modify the text of the policy so that only a selected subset of messages is sent to OBM. For details, see the OM documentation.
-
Replace
<OBM fully qualified host name>in the text with the fully qualified hostname of the Gateway Server system that should receive OM messages (for example,GwSrv.example.com).In deployments involving a load balancer, a NAT device, or a reverse proxy, use the fully qualified hostname of the system used to access the Gateway Server system (for example,
VirtualSrv.example.com). -
Enter the following command to check for syntax errors in the new policy text:
/opt/OV/bin/OpC/opcmomchk -msgforw <policy file name>
-
After correcting any syntax errors, copy the policy to the msgforw policy file in the respmgrs directory as follows:
cp <policy file name> /etc/opt/OV/share/conf/OpC/mgmt_sv/respmgrs/msgforw
-
Inform the server processes to reread the configuration as follows:
/opt/OV/bin/ovconfchg
Message forwarding from OM to OBM is now configured and enabled.
-
-
Validate event synchronization
Do the following to validate the event synchronization between OBM and OM:
Verify Message Forwarding from OM to OBM
To check if the message forwarding policy for sending messages from OM to OBM is configured correctly, follow these steps:
-
Make sure the OBM servers are running.
-
Make sure at least one open message interface policy is deployed on your OM system. For instructions and details, see the OM documentation.
-
On the OM system, open a command or shell prompt and create a new message by executing the following command:
-
Windows:
opcmsg a=App o=Obj msg_text="Hello"
-
UNIX or Linux:
/opt/OV/bin/OpC/opcmsg a=App o=Obj msg_text="Hello"
-
opcmsg a=App o=Obj msg_text="Hello_002"
-
/opt/OV/bin/OpC/opcmsg a=App o=Obj msg_text="Hello_002"
If you configured the message forwarding policy correctly, the message arrives at the OM server and is forwarded to OBM. You can view the events with the OBM Event Browser.
Note If the message is sent multiple times, no new message is generated by OM. These messages are regarded as duplicates and only the message duplicate count is increased.
To generate a new message, modify the message text. For example:
Synchronize OBM events with OM messages
To check if a change to an event in OBM that is already synchronized between OBM and OM is resynchronized in OM, change the severity of an event as follows:
-
Select Workspaces > Operations Console.
-
In the Event Browser, select the event for which you want to change the severity. Choose the event that was already synchronized in OM and OBM and change its severity, for example, from minor to major.
-
In the OM event browser, verify the severity of this event and make sure it was set to the new severity value.
-
OBM Field Mapping
The following table shows the correspondence between the fields of an OBM event and an OM message.
| OBM Event Attribute | OM Message | |
|---|---|---|
| OM Message Attribute | OM Custom Message Attribute (CMA) | |
| ID | Message ID | |
| Title | Message Text | |
| Description | Description | |
| Lifecycle State/State (depending on space) |
N/A | |
| Solution | Solution | |
| Severity | Severity | |
| Priority | Priority | |
| Category | Message Group | |
| Subcategory | SubCategory | |
| Type | Message Type | |
| Related CI Hint | RelatedCiHint (incoming to OBM) |
|
| HPOM Service ID | Service Name | |
| Related CI | N/A | |
| Node | N/A | |
| Node Hint, DNS Name, IP Address, Core ID | node | NodeHint (incoming to OBM) |
| Source CI Hint, DNS Name, IP Address, Core ID | genNode | SourceCiHint (incoming to OBM) |
| Originating Server | origin | |
| Sending Server | sender | |
| Assigned User | owner | |
| Assigned Group | N/A | |
|
C (Event Browser) Because there is a parent event, the current event will be shown as being a symptom. |
CauseEventId (synchronized back to OM) |
|
|
C (Event Browser) Because there is at least one child event, the current event will be shown as being a cause. |
N/A | |
| Custom Attributes | CustomMessageAttributes | |
| Time Created | CreationTime | |
| Time State Changed | N/A | |
| Time Received | ReceivedTime | |
| Duplicate Count | NumberOfDuplicates | |
| ETI Hint | EtiHint (incoming to OBM) |
|
| User Action | Operator Initiated Action | |
| Automatic Action | Automatic Action | |
| Application | Application | |
| Object | Object | |
| Key (only in details) |
MessageKey | |
| Close Events with Key | Pattern of 1. MessageKeyRel | |
| Original Data | OriginalText | |
| (This field is not displayed, but events that have this attribute arrive as closed.) | logOnly | |
| Match Information | policy, conditionId (unmatched) | |
| Original ID
(only in details) |
origId | |
| Correlation Rule | N/A | |
| Source CI | N/A | |
| No Duplicate Suppression | NoDuplicateSuppression (incoming to OBM) |
|
| Event Type Indicator/ETI | N/A | |
| part of CI (after :) | SubCiHint (incoming to OBM) |
|
Overview
The following figure shows the options for integrating OBM and SM when using the RTSM.
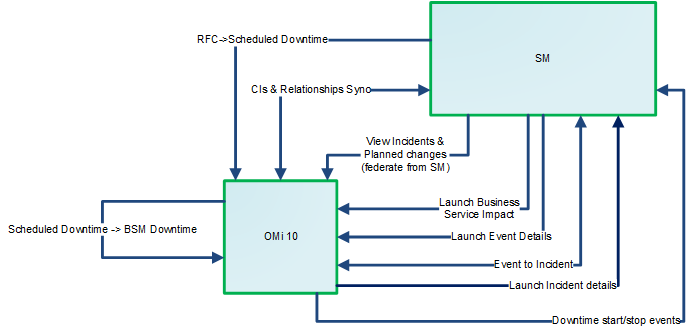
-
CIs synchronization between SM and OBM. To enable operators of all systems to see the same CIs, important service, business application, and infrastructure CIs should be synchronized between all systems. Synchronized CIs are a prerequisite for all other integration features.
-
Incident forwarding between SM and OBM. OBM enables you to forward events from OBM to SM. Forwarded events and subsequent event changes are synchronized back from SM to OBM. You can also drill down from OBM events to SM incidents or from SM incidents to OBM events.
-
Downtime forwarding from SM to OBM. You can create downtimes (also known as outages) in OBM based on Requests for Changes in SM. This is done in two steps. First, scheduled downtime CIs are created in OBM based on RFCs in SM. Then, a BSM downtime CI is created based on the scheduled downtime.
-
Downtime notification from OBM to SM. OBM can send downtime start and end events to SM to notify operators when a downtime occurs. This provides additional information to the SM operator in case of a downtime that was not driven by an RFC.
-
View planned changes and incident details. This integration enables you to view planned changes and incident details in the Changes and Incidents and Hierarchy components in OBM.
-
The Business Impact Report integration enables Service Manager operators to launch an impact report from an incident in the context of the incident's affected CI. This opens an OBM KPI over time page, displaying the affected CI and impacted CIs and services, which allows the operator to categorize and prioritize the incident accordingly.
The following figure shows the options for integrating OBM and SM when using a UCMDB.
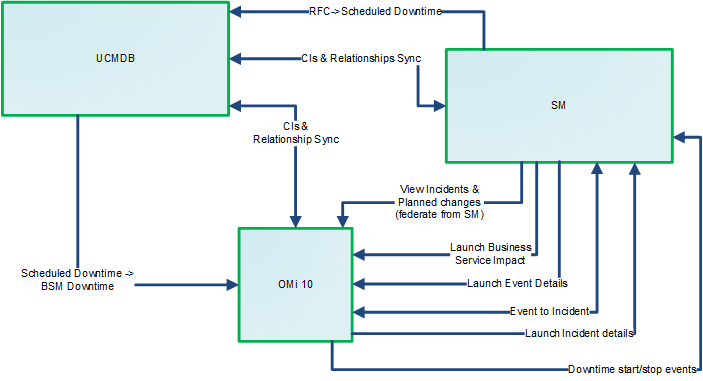
-
CIs synchronization between SM and UCMDB. To enable operators of all systems to see the same CIs, important service, business application, and infrastructure CIs should be synchronized between all systems. Synchronized CIs are a prerequisite for all other integration features. With an external UCMDB, CIs are synchronized from SM to the UCMDB system and vice versa and from the UCMDB system to OBM and vice versa. In this case, the UCMDB acts as Global ID generator.
-
Incident forwarding between SM and OBM. OBM enables you to forward events from OBM to SM. Forwarded events and subsequent event changes are synchronized back from SM to OBM. You can also drill down from OBM events to SM incidents or from SM incidents to OBM events.
-
Downtime forwarding from SM to OBM. You can create downtimes (also known as outages) in OBM based on Requests for Changes in SM. This is done in two steps. First, scheduled downtime CIs are created in UCMDB based on RFCs in SM. Then, a BSM downtime CI is created in OBM based on the scheduled downtime.
-
Downtime notification from OBM to SM. OBM can send downtime start and end events to SM to notify operators when a downtime occurs. This provides additional information to the SM operator in case of a downtime that was not driven by an RFC.
-
View planned changes and incident details. This integration enables you to view planned changes and incident details in the Changes and Incidents and Hierarchy components in OBM.
-
The Business Impact Report integration enables Service Manager operators to launch an impact report from an incident in the context of the incident's affected CI. This opens an OBM KPI over time page, displaying the affected CI and impacted CIs and services, which allows the operator to categorize and prioritize the incident accordingly.
Integration
Complete the following workflow to configure and use the SiteScope integration:
-
Create user accounts
The OBM-SM integration requires integration accounts to be set up for the two three systems to access each other.
-
In Service Manager, create an operator record with system administration privileges, and give it a descriptive name, like
OBMUCMDBSMIntegrUser.To create a dedicated integration user account in SM:
-
Log on to SM as a system administrator.
-
Type contacts in the SM command line, and press ENTER.
-
Create a new contact record for the integration user account. In the Full Name field, type a full name. For example,
RTSMUCMDB. In the Contact Name field, type a name. For example,RTSMUCMDB. Click Add, and then OK. -
Type operator in the SM command line, and press ENTER.
-
In the Login Name field, type the user name of an existing system administrator account, and click Search.
The system administrator account displays.
-
Create a new user account based on the existing one. Change the Login Name to the integration account name you want (for example,
rtsmUCMDB). Type a Full Name. For example,RTSM. In the Contact ID field, click the Fill button and select the contact record you have just created. Click Add. Select the Security tab, and change the password. Click OK.
This is the user account that the OBM server uses to access SM. It is used to forward events, push CIs to, and retrieve incidents and RFCs from SM. Remember the user name and password you specify here, as the OBM UCMDB system will need them to access the Service Manager target server in later steps.
-
-
On each OBM server, create a user account with system administration privileges. This account is used by SM to access the OBM system to retrieve the actual state information of a CI. Give it a descriptive name, like
SMOMiIntegrUser.Remember the user name and password you specify here, as SM will need the accounts to access the OBM server(s) in later steps.
- In OBM, create a user account with the system administration privileges for the UCMDB-OBM integration. Give it a descriptive name, like
UCMDBOMiIntegrUser. Remember the user name and password you specify here, as the UCMDB system will need the account details to access the OBM server in later steps. - In UCMDB, create a user account with system administration privileges for the OBM-UCMDB integration. Give it a descriptive name, like
OMiUCMDBIntegrUser. Remember the user name and password you specify here, as OBM will need the account details to access the UCMDB server in later steps. - In UCMDB, create a user account with system administration privileges for the SM-UCMDB integration. Give it a descriptive name, like
SMUCMDBIntegrUser. Remember the user name and password you specify here, as SM will need the account to access the UCMDB server in later steps.
-
-
Integrate RTSM and SM
Many of the integration features require that Configuration Items (CIs) exist in both Service Manager and OBM. To enable operators of both systems to see the same CIs, they should be synchronized between the two systems. For details about how to integrate OBM RTSM with Service Manager, see the Service Manager Universal CMDB Integration Guide. This integration, which synchronizes important CIs, such as services, business applications and infrastructure CIs, is a prerequisite for all other integration features.
After you have set up the integration, create an integration point in OBM as follows:
-
In OBM, select Administration > RTSM Administration > Data Flow Management > Integration Studio.
-
In the Integration Point pane, select Create New Integration Point or choose an existing integration point to edit. The Create New Integration Point dialog box opens. Enter the following:
Name Recommended Value Description Integration Name SM Integration The name you give to the integration point. Adapter <user defined> Select Software Products > Service Manager > Service Manager 9.xx.
Note Micro Focus recommends to use the following adapters (ordered by preference): ServiceManagerEnhancedAdapter9.41 for SM 9.41+, ServiceManagerEnhancedAdapter9.x for SM 9.40, ServiceManagerAdapter9.x for SM 9.3x
The adapter supports CI/ relationship Data Push from the RTSM to Service Manager, and Population and Federation from Service Manager to the RTSM.
Is Integration Activated selected Select this check box to create an active integration point. Hostname/IP <user defined> The name of the SM server. Port <user defined> The port through which you access SM. Credentials ID <user defined> Click Generic Protocol, click the Add button to add the integration user account you created in for the integration and then select it.
Probe Name (for ServiceManagerAdapter9-x only) <user defined> Select the probe that you installed for this integration. Tip Click the Test Connection button to verify that the details entered are working before continuing.
-
In the Integration Point pane, click the Integration Point you just created, and click the Federation tab in the right pane.
-
In the Supported and Selected CI Types area, verify that Incident and RequestForChange are selected.
-
-
Integrate UCMDB and SM
For details about how to integrate UCMDB with Service Manager, see the Service Manager Universal CMDB Integration Guide. This integration, and the OBM-UCMDB integration, which synchronize important CIs, such as services, business applications and infrastructure CIs, are prerequisites for all other integration features.
After you have set up the integration, create an integration point in OBM as follows:
-
In OBM, select Administration > RTSM Administration > Data Flow Management > Integration Studio.
-
In the Integration Point pane, select Create New Integration Point or choose an existing integration point to edit. The Create New Integration Point dialog box opens. Enter the following:
Name Recommended Value Description Integration Name SM Integration The name you give to the integration point. Adapter <user defined> Select Software Products > Service Manager > Service Manager 9.xx.
Note Micro Focus recommends to use the following adapters (ordered by preference): ServiceManagerEnhancedAdapter9.41 for SM 9.41+, ServiceManagerEnhancedAdapter9.x for SM 9.40, ServiceManagerAdapter9.x for SM 9.3x
The adapter supports CI/ relationship Data Push from the RTSM to Service Manager, and Population and Federation from Service Manager to the RTSM.
Is Integration Activated selected Select this check box to create an active integration point. Hostname/IP <user defined> The name of the SM server. Port <user defined> The port through which you access SM. Credentials ID <user defined> Click Generic Protocol, click the Add button to add the integration user account you created in for the integration and then select it.
Probe Name (for ServiceManagerAdapter9-x only) <user defined> Select the probe that you installed for this integration. Tip Click the Test Connection button to verify that the details entered are working before continuing.
-
In the Integration Point pane, click the Integration Point you just created, and click the Federation tab in the right pane.
-
In the Supported and Selected CI Types area, verify that Incident and RequestForChange are selected.
-
-
Integrate UCMDB and OBM
For details about how to integrate UCMDB with OBM, see Universal CMDB Online Help and the RTSM Best Practices document.
-
Optional. Enable LW-SSO
Lightweight Single Sign-On (LW-SSO) is optional but recommended for the OBM-SM Integration. You have different LW-SSO configuration choices depending on your needs. The following describes how LW-SSO can be used in the OBM-SM workflow.
LW-SSO options
Lightweight Single Sign-On (LW-SSO) is optional but recommended for the OBM-SM Integration. You have different LW-SSO configuration choices depending on your needs. The following describes how LW-SSO can be used in the OBM-SM workflow.
When OBM creates an incident from an OBM event record
OBM creates an incident from an OBM event record by sending RESTful-based requests to SM. The incident ID is then stored in the event record.
LW-SSO is NOT needed in this process. A dedicated SM user account was specified when configuring the SM integration in OBM. OBM uses this dedicated user account when calling the SM RESTful Web Service to create the incident.
When an OBM user views the incident details
The user can log in to SM and view the incident details by using the incident ID stored in the event record.
If the user wants to view the incident details by clicking the incident link from the event record, LW-SSO can be used; otherwise a SM login prompt will appear.
LW-SSO is optional for this process. To enable LW-SSO for this process, configure LW-SSO in both the SM server and Web tier (because the server needs to trust the Web tier), as well as in OBM.
When Service Manager synchronizes the OBM incident status back to OMi
When a user has updated the OBM incident, SM calls the OBM server's RESTful Web Service to update the incident changes to the OBM event record.
LW-SSO is NOT needed in this process. A dedicated OBM user account was specified when the Incident Exchange was set up in SMIS, and SM uses this user account when calling the OBM server's RESTful Web Service to synchronize the incident status back to the OBM event record.
When a user views the event details or the Business Impact Report from an OBM incident
The user clicks the View OMi Event option or Launch Business Impact Report from the incident to view the event details or Business Impact Report.
LW-SSO is optional for this process. If you enable LW-SSO in the SM Web tier and in OBM, the OBM login prompt is bypassed.
Required user permissions
In order to be able to view events, a user needs to be assigned a role with sufficient permission to read events. To manage permissions in OBM, select:
Administration > Users > Users, Groups, and Roles
Select a role or create a new one. In the Permissions section, go to the Operations Console category, select Events and specify the actions users can perform on Events assigned to user.
You can optionally grant the permission to view events not assigned to each user.
When CIs are synchronized between OBMUCMDB and SM
LW-SSO is NOT needed in this process. Dedicated users are specified in the OBM-UCMDB, UCMDB-SM and OBM-SM integration points.
Configure LW-SSO
To use LW-SSO for the SM-OBM integration, LW-SSO must be enabled for both products. In SM, you must enable LW-SSO in both the SM server and web tier.
-
Configure LW-SSO in the SM server
SM servers, version 9.30 and later, support Lightweight Single Sign-On (LW-SSO). An SM integration can pass an authentication token to SM and does not require re-authentication. This simplifies the configuration of Single Sign-On by removing the need to use Symphony Adapter (which proxies LW-SSO-based authentication with the SM Trusted Sign-On solution).
Enabling LW-SSO in the SM server enables web service integrations from other Micro Focus products (for example, Release Control) to bypass SM authentication if the product user is already authenticated and a proper token is used; enabling LW-SSO in both the SM server and web tier enables users to bypass the login prompts when launching the SM web client from other Micro Focus applications.
Note Existing integrations that use the Symphony Adapter and Trusted Sign-On rather than this new LW-SSO mechanism can continue to work.
To configure LW-SSO in the SM server:
- Go to the <Service Manager server installation path>/RUN folder, and open lwssofmconf.xml in a text editor.
- Make sure that the
enableLWSSOFrameworkattribute is set totrue(default). -
Change the domain value
example.comto the domain name of your SM server host.Note To use LW-SSO, your SM web tier and server must be deployed in the same domain; therefore you should use the same domain name for the web tier and server. If you fail to do so, users who log in from another application to the web tier can log in but may be forcibly logged out after a while.
-
Set the initString value. This value MUST be the same with the LW-SSO setting of the other product you want to integrate with SM.
Note
- LW-SSO version 2.5 is supported.
- Optionally, you can change attributes paddingModeName, keySize, encodingMode, engineName, and cipherType. However, you must make sure that they are same with the LW-SSO setting of the other product that you want to integrate with SM.
- Do not change the other configurations, such as the content in tag <restURLs>, and the attribute of tag <service>.
Example:
<?xml version="1.0" encoding="UTF-8"?> <lwsso-config xmlns="http://www.microfocus.com/astsecurity/idmenablmentfw/lwsso/2.0"> <enableLWSSO enableLWSSOFramework="true" enableCookieCreation="true" cookieCreationType="LWSSO" /> <web-service> <inbound> <restURLs> <url>.*7/ws.*</url> <url>.*sc62server/ws.*</url> <url>.*/ui.*</url> </restURLs> <service service-type="rest" > <in-lwsso> <lwssoValidation> <domain>example.com</domain> <crypto cipherType="symmetricBlockCipher" engineName="AES" paddingModeName="CBC" keySize="256" encodingMode="Base64Url" initString="This is a shared secret passphrase"</crypto> </lwssoValidation> </in-lwsso> </service> </inbound> <outbound/> </web-service> </lwsso-config> -
Configure LW-SSO in the SM web tier
If Lightweight Single Sign-On (LW-SSO) is enabled in the SM Web tier, integrations from other Micro Focus products will bypass SM authentication when launching the SM Web client, provided that the Micro Focus product user is already authenticated and a proper token is used.
Note
- To enable users to launch the Web client from another Micro Focus product by using LW-SSO, you must also enable LW-SSO in the SM server.
- Once you have enabled LW-SSO in the web tier, web client users should use the web tier server's fully-qualified domain name (FQDN) in the login URL:
http://<myWebtierHostName>.<myDomain>:<port>/webtier-x.xx/index.do
The following procedure is provided as an example, assuming that the SM Web tier is deployed on Tomcat.
To configure LW-SSO in the SM Web tier:
-
Open the
<Tomcat>\webapps\<SMWeb tier>\WEB-INF\web.xmlfile in a text editor. -
Modify the
web.xmlfile as follows:-
Set the
<serverHost>parameter to the fully-qualified domain name of the SM server.Note This is required to enable LW-SSO from the web tier to the server.
- Set the
<serverPort>parameter to the communications port of the SM server. -
Set the
secureLoginandsslPortparameters.- If you do not want to configure TLS between Tomcat and the browser, set
secureLogintofalse. - We recommend that you enable secure login in a production environment. Once
secureLoginis enabled, you must configure TLS for Tomcat. For details, see the Apache Tomcat documentation.
- If you do not want to configure TLS between Tomcat and the browser, set
- Change the value of context parameter isCustomAuthenticationUsed to false.
- Remove the comment tags (<!-- and -->) enclosing the following elements to enable LW-SSO authentication.
<!-- <filter> <filter-name>LWSSO</filter-name> <filter-class>com.hp.sw.bto.ast.security.lwsso.LWSSOFilter</filter-class> </filter> --> ...... <!-- <filter-mapping> <filter-name>LWSSO</filter-name> <url-pattern>/*</url-pattern> </filter-mapping> --> - Save the
web.xmlfile.
-
- Open the
<Tomcat>\webapps\<SM Web tier>\WEB-INF\classes\lwssofmconf.xmlfile in a text editor. -
Modify the
lwssofmconf.xmlfile as follows:- Set the value of
enableLWSSOFrameworktotrue(default is false). -
Set the
<domain>parameter to the domain name of the server where you deploy your SM Web tier. For example, if your Web tier's fully qualified domain name ismywebtier.domain.example.com, then the domain portion isdomain.example.com.Note To use LW-SSO, your SM web tier and server must be deployed in the same domain; therefore you should use the same domain name for the web tier and server. If you fail to do so, users who log in from another application to the web tier can log in but may be forcibly logged out after a while.
- Set the
<initString>value to the password used to connect Micro Focus applications through LW-SSO (minimum length: 12 characters). For example, smintegrationlwsso. Make sure that other HPE applications (for example, Release Control) connecting to SM through LW-SSO share the same password in their LW-SSO configurations. -
In the
<multiDomain>element, set the trusted hosts connecting through LW-SSO. If the SM web tier server and other application servers connecting through LW-SSO are in the same domain, you can ignore the<multiDomain>element ; If the servers are in multiple domains, for each server, you must set the correctDNSDomain(domain name),NetBiosName(server name),IP(IP address), andFQDN(fully-qualified domain name) values. The following is an example.<DNSDomain>example.com</DNSDomain>
<NetBiosName>myserver</NetBiosName>
<IP>1.23.456.789</IP>
<FQDN>myserver.example.com</FQDN>
Note As of version 9.30, SM uses <multiDomain> instead of <protectedDomains>, which is used in earlier versions. The multi-domain functionality is relevant only for UI LW-SSO (not for web services LW-SSO). This functionality is based on the HTTP referrer. Therefore, LW-SSO supports links from one application to another and does not support typing a URL in a browser window, except when both applications are in the same domain.
-
Check the
secureHTTPCookievalue (default: true).- If you set
secureHTTPCookietotrue(default), you must also setsecureLoginin theweb.xmlfile totrue(default); if you setsecureHTTPCookieto false, you can setsecureLoginto eithertrueorfalse. In a production environment, you are recommended to set both parameters totrue. - If you do not want to use TLS, set both
secureHTTPCookieandsecureLogintofalse.
- If you set
- Save the
lwssofmconf.xmlfile.
Here is an example of
lwssofmconf.xml:<?xml version="1.0" encoding="UTF-8"?> <lwsso-config xmlns="http://www.hp.com/astsecurity/idmenablmentfw/lwsso/2.0">
  <enableLWSSO
	enableLWSSOFramework="true"
	enableCookieCreation="true"
	cookieCreationType="LWSSO"/>

  <webui>
	    <validation>
	      <in-ui-lwsso>
	        <lwssoValidation id="ID000001">
	         <domain>example.com</domain>
	          <crypto cipherType="symmetricBlockCipher"
	            engineName="AES" paddingModeName="CBC" keySize="256"
	            encodingMode="Base64Url"
	            initString="This is a shared secret passphrase"/>
	        </lwssoValidation>
	      </in-ui-lwsso>

	      <validationPoint
	        enabled="false"
	        refid="ID000001"
	        authenicationPointServer="http://server1.example.com:8080/bsf"/>

	    </validation>

	    <creation>
	      <lwssoCreationRef useHTTPOnly="true" secureHTTPCookie="true">
	        <lwssoValidationRef refid="ID000001"/>
	        <expirationPeriod>50</expirationPeriod>
	      </lwssoCreationRef>
	    </creation>

	    <logoutURLs>
	        <url>.*/goodbye.jsp.*</url>
		<url>.*/cwc/logoutcleanup.jsp.*</url>
	    </logoutURLs>

	    <nonsecureURLs>
		<url>.*/images/.*</url>
		<url>.*/js/.*</url>
		<url>.*/css/.*</url>
		<url>.*/cwc/tree/.*</url>
		<url>.*/sso_timeout.jsp.*</url>
	   </nonsecureURLs>

	    <multiDomain>
              <trustedHosts>
                 <DNSDomain>example.com</DNSDomain>
                 <DNSDomain>example1.com</DNSDomain>
                 <NetBiosName>myserver</NetBiosName>
                 <NetBiosName>myserver1</NetBiosName>
                 <IP>xxx.xxx.xxx.xxx</IP>
                 <IP>xxx.xxx.xxx.xxx</IP>
                 <FQDN>myserver.example.com</FQDN>
                 <FQDN>myserver1.example1.com</FQDN>
              </trustedHosts>
           </multiDomain>
</webui> <lwsso-plugin type="Acegi"> <roleIntegration rolePrefix="ROLE_" fromLWSSO2Plugin="external" fromPlugin2LWSSO="enabled" caseConversion="upperCase"/> <groupIntegration groupPrefix="" fromLWSSO2Plugin="external" fromPlugin2LWSSO="enabled" caseConversion="upperCase"/> </lwsso-plugin> </lwsso-config>
- Set the value of
- Open the
<Tomcat>\webapps\<SM Web tier>\WEB-INF\classes\application-context.xmlin a text editor. -
Modify the
application-context.xmlas follows:-
Add
lwSsoFilterto filterChainProxy:/**=httpSessionContextIntegrationFilter,lwSsoFilter,anonymousProcessingFilterNote If you need to enable web tier LW-SSO for integrations and also enable trusted sign-on for your web client users, add lwSsoFilter followed by preAuthenticationFilter, as shown in the following:
/**=httpSessionContextIntegrationFilter,lwSsoFilter,preAuthenticationFilter,anonymousProcessingFilter. -
Uncomment bean lwSsoFilter:
<bean id="lwSsoFilter" class="com.hp.ov.sm.client.webtier.lwsso.LwSsoPreAuthenticationFilter"> - Save the
application-context.xmlfile.
-
- Repack the updated SM web tier files and replace the old
web tier .warfile deployed in the<Tomcat>\webappsfolder. - Restart Tomcat so that the configuration takes effect.
-
Configure LW-SSO in OBM
In OBM:
-
Navigate to Authentication Management:
Administration > Users > Authentication Management
-
In the Single Sign-On Configuration section, click Edit to open Single Sign On Editor panel.
-
In the Single Sign On Editor panel, select Lightweight.
-
Paste the Token Creation Key (initString) value that you copied above from JMX to get/set Token Creation Key (initString) to the Token Creation String(initString).
-
Click Save to save your configuration.
For details on configuring LW-SSO, see the OBM Administration Guide.
-
-
-
View actual state in SM
To display the Actual State information in the SM configuration item form, do the following:
-
Log on to SM as a system administrator.
-
Click System Administration > Base System Configuration > Miscellaneous > System Information Record.
-
Click the Active Integrations tab.
-
Select the HP Universal CMDB option.
The form displays the UCMDB web service URL field.
-
In the UCMDB web service URL field, type the URL to the Universal CMDB web service API. The URL has the following format:
http://<UCMDB server name>:<port>/axis2/services/ucmdbSMService
-
Specify the credentials for the user you created to access the OBM server.In the UserId and Password fields, type the user credentials that are required to manage CIs on the UCMDB system.
Replace <UCMDB server name> with the host name of your UCMDB server, and replace <port> with the port used by your UCMDB server web service.
-
Click Save. SM displays the message: Information record updated.
-
Log out of the SM system.
-
To verify that the setup worked, log back into the SM system with an administrator account. The Actual State section will be available in CI records pushed from OBM.
-
-
Configure event forwarding from OBM to SM
OBM enables you to forward events from OBM to Service Manager, which then become incidents in Service Manager. Subsequent event/incident changes are synchronized between Service Manager and OBM. You can also drill down from OBM events to Service Manager incidents and vice versa.
Follow the steps below to set up an incident exchange between Service Manager and OBM.
-
Configure the SM server as a connected server in OBM
To synchronize events and event changes between OBM and Service Manager incidents, configure Service Manager as a target connected server in the OBM Connected Servers manager.
To configure the Service Manager server as a target connected server, perform the following steps:
-
Navigate to the Connected Servers manager:
Administration > Setup and Maintenance > Connected Servers
-
In the central Connected Servers pane, click New and select External Event Processing. Alternatively, you can click New in the External Event Processing area in the right pane.
The Create External Event Processing Server panel opens.
-
In the General section, enter a display label (a name for the target Service Manager server), an identifier (a unique internal name if you want to replace the automatically generated one), and, optionally, a description of the connection being specified.
Note The Identifier field is filled in automatically. For example, if you enter
Service Manager 1as the display label for the target Service Manager server,Service_Manager_1is automatically inserted in the Identifier field.Make a note of the name of the new target server (in this example,
Service_Manager_1). You must provide it later as the user name when configuring the Service Manager server to communicate with the server hosting OBM. -
In the Server Properties section, complete the following information:
-
Enter the fully qualified domain name of the Service Manager target server.
-
From the drop-down list, select the Service Manager System CI type.
-
Optional. Customize the way events and change notifications are delivered to this server by using Advanced Delivery Options:
-
Serial: Events and change notifications are delivered serially in the order in which they were received.
-
Serial per source: Default. Each originating server is provided with a dedicated outgoing request delivery path. For each individual outgoing request delivery path, events and change notifications are delivered serially in the order in which they were received. This can increase the throughput for delivery of events and change notifications when many events are received from multiple originating servers, while maintaining the incoming order.
-
Parallel: The configured number of outgoing request delivery paths is used when forwarding events and change notifications. This can further increase the throughput for delivery of events and change notifications. However, because the source of the event is not considered, maintenance of the incoming order cannot be guaranteed.
-
-
-
In the Integration Type section, complete the following information:
-
Select Call Script Adapter as the integration type.
-
From the Script name drop-down list, select the Service Manager Groovy script adapter sm:ServiceManagerAdapter.
-
Specify a maximum transaction time value (the time limit for the execution of the script). The default value is 60 seconds.
-
-
In the Outgoing Connection section, enter the user credentials (user name and password) and the port number required to access the Service Manager target server and to forward events to that server:
-
In the Username field, enter the user name for the integration user you set up in Service Manager.
-
In the Password field, enter the password for the user you specified. Repeat the password for verification.
-
In the Port field, specify the port configured on the Service Manager side for the integration with OBM.
To find the port number to enter:
-
If you are using default ports in Service Manager, select or clear Use secure HTTP as appropriate, and then click Set default port. The port is set automatically.
Note If you do not want to use secure HTTP, make sure that the Use secure HTTP check box is cleared.
If the Use secure HTTP check box is selected, download and install a copy of the target server’s TLS certificate by clicking import the certificate, and then clicking the Connect and Import from Server or Import from File button, if the certificate is available in a local file.
-
If you need to find the port number, access the following file on your Service Manager system:
<Service Manager root directory>/HP/Service Manager <version>/Server/RUN/sm.cfgIn the
sm.cfgfile, check for thesm -loadBalancerline and add the port entry at the end of the line. The line looks similar to this:sm -loadBalancer -httpPort:13080Enter the appropriate value of the port used by Service Manager in the Port field of the Outgoing Connection section.
-
-
Select the Enable synchronize and transfer control check box.
If the Enable synchronize and transfer control check box is selected, an OBM operator can transfer ownership of the event to the target connected server by using the Transfer Control option in the Event Browser context menu. If it is not selected, the Synchronize and Transfer Control option is not available from the Event Browser context menu or from the list of forwarding types for configuring forwarding rules.
-
-
In the Incoming Connection section, select the Accept event changes from external event processing server check box, and then enter a password that the Service Manager server requires to connect to the server hosting OBM.
Note Make a note of this password. You must provide it later when configuring the Service Manager server to communicate with the server hosting OBM. This password is associated with the user name (
Service_Manager_1) you configured in Service Manager.If Enable synchronize and transfer control was previously selected, the Accept event changes from external event processing server option is assumed and cannot be disabled.
-
In the Event Drilldown section, complete the following information:
-
Enter the fully qualified domain name and port of the Service Manager system into which you want to perform the incident drill down. The default port value is automatically inserted and can be restored by clicking Set default port.
Note To enable incident drill down to Service Manager, you must install a web tier client for your Service Manager server according to your Service Manager server installation or configuration instructions.
In the Event Drilldown section, configure the server where you installed the web tier client along with the configured port used.
If you do not specify a server in the Event Drilldown section, it is assumed that the web tier client is installed on the server used for forwarding events and event changes to SM, and receiving event changes back from Service Manager.
If nothing is configured in the Event Drilldown section, and the web tier client is not installed on the Service Manager server machine, the web browser will not be able to find the requested URL.
-
Optional. Select the Use secure HTTP check box for secure communication.
-
-
In the Test Connection section, click Run Test to check that the specified connection attributes are correct. If an error message is displayed, correct the connection information, and retest the connection.
-
Make sure that the Activate after save check box is selected if you want to enable the server connection immediately.
-
Click Create. The target Service Manager server appears in the list of connected servers.
-
If you have SM 9.34 or higher, perform the following additional steps:
- Reopen the Service Manager connected server that you configured in the previous steps. To do so, double-click the connected server entry in the connected servers list.
-
Copy the ID of the connected server and save it. You must specify this ID as
omi.mgr.idon the Service Manager system.An example of a connected server ID is as follows:
ID: 22f42836-fd36-473e-afc9-a81290f4f73b
-
-
Optional. Configure an event forwarding rule
Once you have configured the Service Manager server as a connected server in OBM, you can forward events manually by using Transfer Control To from the Context Menu. If you want to automatically forward events, you can configure an Event Forwarding Rule for the OBM server.
-
Open the Event Forwarding manager:
Administration > Event Processing > Automation > Event Forwarding
-
In the Event Forwarding Rules pane, click New Item to open the Create New Event Forwarding Rules dialog box.
-
Enter a display name, and (optional) a description of the event forwarding rule being specified.
-
Select Active. A rule must be active in order for its status to be available in Service Manager.
-
Select an event filter for the event forwarding rule from the Events Filter list. The filter determines which events to consider for forwarding.
Filters for Event Forwarding Rules can screen events based on the following date-related event attributes which, for example, help you to ignore outdated events:
-
Time Created
-
Time Received
-
Time Lifecycle State Changed
-
-
If no appropriate filter is already configured, create a new filter as follows:
-
Click the New Item button to open the Filter Configuration dialog box. You can choose between New Simple Filter or New Advanced Filter.
-
In the Display Name field, enter a name for the new filter, in this example, FilterCritical.
Clear the check boxes for all severity levels except for the severity Critical.
Click OK.
-
You should see your new filter in the Select an Event Filter dialog box (select it, if it is not already highlighted).
Click OK.
-
-
Under Target Servers, select the target server you configured in the previous step on connecting servers. Click the Add button next to the target servers selection field. You can now see the connected server's details. In the Forwarding Type field, select the Synchronize and Transfer Control forwarding type. Although other selections are technically possible, only Synchronize and Transfer Control is supported by Service Manager.
-
-
Configure the OBM integration in SM
Service Manager can integrate with more than one OBM server. To configure more than one server, first complete Configure the Instance Count in the Service Manager-OBM integration template before adding integration instances. To proceed with the default of one server, skip to Add an SMOMi integration instance for each OBM server.
Configure the Instance Count in the Service Manager-OBM integration template
To integrate Service Manager with more than one OBM server, configure the Instance Count setting in the SMOMi integration template, as described below.
- Log on to Service Manager as a system administrator.
- Type db in the command line, and press Enter.
-
In the Table field, type SMISRegistry, and click Search.
The SMIS integration template form opens.
-
Click Search.
A list of SMIS integration templates opens.
- Select SMOMi from the list.
-
In the Instance Count field, change the value of 1 to the number of OBM servers that you want to integrate with Service Manager. For example, if you need two OMi servers, change the value to 2.
- Click Save.
Add an SMOMi integration instance for each OBM server
Once you have completed configuration in OBM, you are ready to add and enable a separate integration instance in Service Manager for each OBM server.
To add and enable an Incident Exchange (OMi - SM) integration instance:
- Log on to Service Manager as a system administrator.
-
Click Tailoring > Integration Manager.
-
Click Add.
The Integration Template Selection wizard opens.
-
Select SMOMi from the Integration Template list.
Note Ignore the Import Mapping check box, which has no effect on this integration.
-
Click Next.
-
Complete the integration instance information:
- Modify the Name and Version fields to the exact values you need.
- In the Interval Time (s) field, enter a value. For example: 600. If an OBM opened incident fails to be synchronized back to OMi, Service Manager will retry the failed task at the specified interval (for example, 600 seconds).
- In the Max Retry Times field, enter a value. For example: 10. This is the maximum allowed number of retries for each failed task.
- (Optional) In the SM Server field, specify a display name for the Service Manager server host. For example: my_Local_SM.
- (Optional) In the Endpoint Server field, specify a display name for the OBM server host. For example: my_OBM_1.
- (Optional) In the Log File Directory field, specify a directory where log files of the integration will be stored. This must be a directory that already exists on the Service Manager server host.
- (Optional) In the Log Level field, change the log level from INFO (default) to another level. For example: WARNING.
- (Optional) If you want this integration instance to be automatically enabled when the Service Manager Server service is started, select Run at system startup.
- Click Next. The Integration Instance Parameters page opens.
-
On the General Parameters tab, complete the following fields as necessary:
Field Sample Value Description omi.server.url http://<servername>/opr-gateway/rest/synchronization/event/ This is the URL address of the OBM server's RESTful web service. Replace <servername> with the fully qualified domain name of your OMi server. http.conn.timeout 30 The HTTP connection timeout setting in seconds. Note The out-of-box value is 30 (seconds), and 15 (seconds) is used if this field is empty.
http.rec.timeout 30 The HTTP receive timeout setting in seconds. Note The out-of-box value is 30 (seconds), and 15 (seconds) is used if this field is empty.
http.send.timeout 30 The HTTP send timeout setting in seconds. Note The out-of-box value is 30 (seconds), and 15 (seconds) is used if this field is empty.
sm.mgr.id 55436DBE-F81E-4799-BA05-65DE9404343B The Universally Unique Identifier (UUID) automatically generated for this instance of Service Manager. Note This field is automatically completed each time when you add an SMOMi integration instance. Do not change it, otherwise the integration will not work properly.
omi.reference.prefix urn:x-hp:2009:opr: The prefix of the BDM External Process Reference field, which will be present in incoming synchronization requests from the OBM server.
Note This field is automatically completed and has a fixed value. Do not change it.
sm.reference.prefix urn:x-hp:2009:sm: The prefix of the BDM External Process Reference field, which will be present in outgoing synchronization requests from Service Manager. Note This field is automatically completed and has a fixed value. Do not change it.
omi.eventdetail.baseurl http://<servername>/opr-console/opr-evt-details.jsp?eventId= The basic URL address of the event detail page in OBM. Replace <servername> with the fully qualified domain name of your OBM server. -
On the General Parameters and Secure Parameters tabs, enter three parameter values that you specified when configuring the Service Manager server as a connected server in OBM. The following table lists the parameters, whose values you can copy from your OBM server.
To copy the parameter values from OBM, follow these steps:
- Log in to OBM as a system administrator.
- Navigate to Administration > Setup and Maintenance > Connected Servers.
- Locate your Service Manager server configuration entry and double-click it.
- In the General section, copy the ID string into the omi.mgr.id field in Service Manager.
- In the Incoming Connection section, copy the User name and Password to the username and Password fields in Service Manager, respectively.
Field Sample Value Description omi.mgr.id (on the General Parameters tab) f3832ff4-a6b9-4228-9fed-b79105afa3e4 The Universally Unique Identifier (UUID) automatically generated in OBM for the target Service Manager server.
Note This parameter was introduced to support multiple OBM servers. Service Manager uses the UUID to identify from which OBM server an incident was opened. Be aware that if you delete the connected server configuration for the Service Manager server in OBM and then recreate the same configuration, OBM generates a new UUID. You must reconfigure the integration instance by changing the old UUID to the new one.
Tip If you have only one OBM server, you can simply remove this parameter (remove both the parameter name and value) from the integration instance.
username omi.mgr.id (on the General Parameters tab) SM_Server This is the user name that the Service Manager server uses to synchronize incident changes back to the OBM server.
Password (on the Secure Parameters tab) SM_Server_Password This is the password that the Service Manager server uses to synchronize incident changes back to the OBM server.
-
Click Next twice, and then click Finish.
Note Leave the Integration Instance Mapping and Integration Instance Fields settings blank. This integration does not use these settings.
Service Manager creates the instance. You can edit, enable, disable, or delete it in Integration Manager.
- Enable the integration instance.
- If you have multiple OBM servers, repeat the steps above for the rest of your OBM servers.
-
Configure launch of SM incident details from OBM
If you want to be able to drill down to Service Manager incidents from the OBM Event Browser, you must configure the Service Manager web tier in the sm:ServiceManagerAdapter script in OBM.
-
Navigate to Connected Servers in OBM:
Administration > Setup and Maintenance > Connected Servers
Click Manage Scripts.
-
Select the sm:ServiceManagerAdapter script, and click the Edit Item button.
-
Click the Script tab and locate the following text in the Groovy script:
private static final String SM_WEB_TIER_NAME = 'webtier-9.30' -
Change the value of
webtier-9.30to the value required to access the Service Manager web tier client.The drill-down URL is made up like this:
http://<FQDN of Service Manager web tier server>/<web path to Service Manager>/<URL query parameters>In this instance,
<FQDN of Service Manager web tier server>is the fully qualified DNS name of the Service Manager server where the web tier client is installed. This part of the URL is added automatically (together withhttp://orhttps://) according to the values that you provided when you configured Service Manager as a target connected server in the Connected Servers manager. The address of the Event Drilldown section of the Connected Server makes up the rest of the URL. For details, see the previous step on connecting servers.An example of a drill-down URL:
http://smserver.example.com/SM930/index.do?ctx=docEngine&file=probsummary&query=number%3D%22IM10216%22&queryHash=bf52f465In this example, you must replace
webtier-9.30withSM930. All the other parts of the URL are configured automatically. -
When finished editing, save the new version of the script. Note that the script can always be reverted to its original version.
For details, see the OBM Administration Guide.
-
If you are using SM 9.34 or lower, set the values of the
querysecurityparameter and thequerySecurityWeb parameter from the default values (true) tofalsein the SM web tier configuration fileweb.xml.For details about the
querysecurityparameter and thequerySecurityWeb parameter, see Service Manager Online Help.
-
-
Optional. Attribute synchronization
Attribute Synchronization Using Groovy Scripts
When the SM incident is initially created from an OBM event, event attributes are mapped to the corresponding SM incident attribute. Out of the box, after the initial incident creation, whenever the incident or event subsequently changes, only a subset of the changed event and incident attributes are synchronized. The following describes how to customize the list of attributes to synchronize upon change. If you want to change the out-of-the-box behavior regarding which attributes are updated, you can specify this in the Groovy script used on the OBM side for synchronization or incident creation. In the Groovy script, you can specify which fields are updated in SM, and which fields are updated in OBM. You can also specify custom attributes in the Groovy script.
Bidirectional Synchronization of Attributes
Individual OBM event attributes can be synchronized from an OBM event to the corresponding SM incident, whenever the event is changed in OBM. Similarly, individual SM incident attributes can be synchronized from an SM incident to the corresponding event in OBM, every time the event is changed in SM. To change the attributes that are synchronized from an OBM event to a corresponding SM incident, change the attributes included in the
SyncOPRPropertiesToSMlist in the Groovy script. To change the attributes that are synchronized from an SM incident to an OBM event, change the attributes included in theSyncSMPropertiesToOPRlist in the Groovy script. By default, thestate,solution, andcauseattributes are synchronized from OBM events to their corresponding SM incidents, and theincident_statusandsolutionattributes are synchronized from an SM incident to the corresponding OBM event.To enable synchronization of all attributes in both directions, you can set the
SyncAllPropertiesvariable to true. In this case, all other variables will be ignored.Example:
private static final Set SyncOPRPropertiesToSM = ["state", "solution", "cause"]
private static final Set SyncSMPropertiesToOPR = ["incident_status", "solution"]
The following table lists the OBM event attributes that can by synchronized with an SM incident, and the matching SM incident attributes that can be synchronized with an OBM event:
OBM event attribute SM incident attribute titlenamedescriptiondescriptionstateincident_statusseverityurgencypriorityprioritysolutionsolutionUnidirectional Synchronization of Attributes
The
assigned_user,assigned_group, andcauseevent properties can be synchronized from an OBM event to a corresponding SM incident. To synchronize these attributes, add them to theSyncOPRPropertiesToSMlist in the groovy script.Example:
-
private static final Set SyncOPRPropertiesToSM = ["assigned_user", "assigned_group", "cause"]
Individual OBM event properties can be synchronized to a corresponding SM incident Activity Log. Updates are not synchronized back from the SM incident Activity Log to the corresponding OBM event. To change the properties that are synchronized, add the desired properties to the
SyncOPRPropertiesToSMActivityLoglist in the Groovy script. By default, thetitle,description,state,severity,priority,annotation,duplicate_count,cause,symptom,assigned_user, andassigned_groupproperties are synchronized.Example:
private static final Set SyncOPRPropertiesToSMActivityLog = ["title", "description", "priority"]
The following list includes all properties that can by synchronized from OBM events to the SM incident Activity Log:
-
title -
description -
state -
severity -
priority -
solution -
annotation -
duplicate_count -
assigned_user -
assigned_group -
cause -
symptom -
control_transferred_to -
time_state_changed
Custom Mappings for Custom Attributes
You can define your own mappings for custom attributes between OBM and SM. These mapping can be either unidirectional, if the attributes are only contained in one map, or bidirectional, if the attributes are contained in both maps. To create custom mappings for custom attributes, you can edit the
MapSM2OPRCustomAttributeandMapOPR2SMCustomAttributelists in the Groovy script. These maps are empty by default.Example:
-
private static final Map <String, String> MapSM2OPRCustomAttribute = [“MySMAttribute” : “MyOBMCustomAttribute”] -
private static final Map <String, String> MapOPR2SMCustomAttribute = [ “MyOtherOBMCustomAttribute” : “MyOtherSMAttribute”, “MyThirdOBMCA”, “activity_log”]
-
Test the event forwarding and cross launches
To test the event forwarding, forward an event manually to SM and then verify that the event is forwarded to SM as expected, and that the cross launches work in both directions.
-
Open an OBM Event Browser.
- Select an event and select Transfer Control To in the Context Menu. Select the SM target system.
-
Select the Forwarding tab.
-
In the External Id field, you should see a valid SM incident ID after a few seconds.
-
Verify that the incident appears in the Incident Details in Service Manager by using the cross launch (see next step).
If the event drill-down connection is not configured, verify the forwarding by using the following:
-
In the Forwarding tab in the OBM Event Browser, copy or note the incident ID from the External Id field.
-
In the Service Manager user interface, navigate to:
Incident Management > Search Incidents
-
Paste or enter the incident ID in the Incident Id field.
-
Click the Search button. This takes you to the incident in the Incident Details.
-
-
Test the cross launch from OBM to SM:
Click the hyperlink created with the incident ID. A browser window opens, which takes you directly to the incident in the Incident Details in Service Manager.
-
Test the cross launch from SM to OBM:
In the Incident Details in Service Manager, click More and then select View OMi Event. A browser window opens, which takes you directly to the event in the Event Browser in OBM.
Note The View OMi Event option displays only when the omi.mgr.id parameter in the corresponding SM-OBM integration instance is set correctly.
- Close the incident in Service Manager.
-
Verify that the change in the state of the incident (it is now
closed) is synchronized back to OBM. You may not be able to see the event that was closed in SM in the active Event Browser, but it should now be in the Closed Events Browser.
-
-
Advanced configuration
Configure forwarding of affected business services from OBM to SM
Service Manager versions 9.40 and higher support the display of multiple affected business services associated with an event in OBM. By default, when an event is created in OBM that affects more than one business service CI, all affected services are automatically forwarded to SM. The most critical service is displayed on the "Primary Service" tab in SM, and all other affected services are displayed on the "Impacted Services" tab.
If you only want to forward the most critical affected service associated with an event from OBM to SM, you can change the
ForwardAllAffectedBusinessServicesflag in the sm:ServiceManagerAdapter script to false.-
Navigate to Connected Servers in OBM:
Administration > Setup and Maintenance > Connected Servers
Click Manage Scripts.
-
Select the sm:ServiceManagerAdapter script, and click the Edit Item button.
-
Click the Script tab and search for
ForwardAllAffectedBusinessServices. Change the value tofalse. -
When finished editing, save the new version of the script. Note that the script can always be reverted to its original version. For details, see the OBM Administration Guide.
-
-
-
Downtime forwarding from SM to OBM
You can create downtimes (also known as outages) in OBM based on Requests for Changes (RFCs) in SM. This is done in two steps. First, scheduled downtime CIs are created in OBMthe UCMDB based on RFCs in SM. Then, a BSM downtime CI is created in OBM based on the scheduled downtime.
You can also send downtime start and end information from OBM to SM to notify operators of when a downtime occurs, especially if the downtime was not driven by an RFC in SM.
Notes:- For Changes/Tasks that have final approval phases defined in Service Manager Integration Suite (SMIS), the downtimes will be synchronized after the Changes/Tasks get final approval.
- Only downtimes that end at a future time will be synchronized.
- Select the Configuration Item(s) Down checkbox when scheduling downtimes in Changes/Tasks.
- The SLA scheduler needs to be started in the System Status form.
Step 1: Add an SMBSM_DOWNTIME integration instance in SM
To set up the integration from Service Manager to OBM, you must add an instance of this integration in the Service Manager Integration Suite (SMIS). Note that additional setup is required on the OBM side for integration from OBM to Service Manager.
To add the SMBSM_DOWNTIME instance:
- Click Tailoring > Integration Manager. Integration Instance Manager opens.
- Click Add. The Integration Template Selection wizard opens.
- Select SMBSM_DOWNTIME from the Integration Template list. Ignore the Import Mapping check box, which has no effect on this integration.
- Click Next. The Integration Instance Information page opens.
-
Do the following:
- Modify the Name and Version fields to the exact values you need.
- In the Interval Time(s) field, enter a value based on your business needs in regard to downtime exchange frequency. Note that a short interval time can be safe because the next scheduled task will not start until the previous task is completed and the interval time passed.
- In the Max Retry Times field, enter a value. This is the maximum allowed number of retries (for example, 10) for each failed task.
- In the Log File Directory field, specify a directory where log files of the integration will be stored. This must be a directory that already exists on the Service Manager server. By default, logging message is output to
sm.log. - (Optional) In the SM Server field, specify a display name for the Service Manager server host. For example: my_local_SM.
- (Optional) In the Endpoint Server field, specify a display name for the OBM server host. For example: my_BSM_1.
- (Optional) In the Log Level field, change the log level from INFO (default) to another level. For example: WARNING.
- (Optional) If you want this integration instance to be automatically enabled when the Service Manager Server service is started, select Run at system startup.
- Click Next. The Integration Instance Parameters page opens.
-
On the General Parameters tab, complete the following fields as necessary:
Name Category Value Description WithdrawDowntime General true/false Set this value to
true: When authorized users are manually changing the phase of a change record which has 'valid' outage, a window will open and provide choices of withdrawing the outage.Set this value to
false: The pop-up window is disabled. This operation may cause some unapproved planned downtimes be synchronized to OBM.By default, this value is set to
true.Category or workflow (Process Designer) name of changes Change The final approval phase for changes Set the final approval phase for downtime, which is the indication of valid downtime information. Category or workflow (Process Designer) name of tasks Task The final approval phase for tasks Set the final approval phase for downtime, which is the indication of valid downtime information. sm.host General <sm server name > Set the Service Manager server host name or DNS name to compose the External Process Reference and the Reference Number of Scheduled Downtime CI in UCMDB.
Note: Do not include a colon in this field. Otherwise, the logic will be broken.sm.reference.prefix General urn:x-hp:2009:sm Set the prefix to compose the External Process Reference of Scheduled Downtime CI in UCMDB.
Note: This field has a fixed value. Do not change it.Notes:- Type category or workflow name of change/task in the Name column. This value is case-sensitive and it must match the record in Service Manager database.
- Set the value to
Changefor changes in the Category column. Similarly, set the value toTaskfor tasks. - Type the final approval phase in the Value column. This value is case-sensitive and it must match the record in Service Manager database. You can separate multiple phases by semicolons, which must be the English character.
- Detailed information will be displayed in the integration log when the following errors occur:
- User input of categories/phases for the changes/tasks is not correct.
- The category and phase pair does not exist in the database.
- For Change Management categories which do not have approval phase, the downtime integration will treat its downtime information as final approved once created. You do not need to define any phases in SMIS parameters.
-
For the category or workflow name of the changes and the tasks, the integration will ignore all the final phases defined for the redundant category or workflow.
-
Click Next twice and then click Finish. Leave the Integration Instance Mapping and Integration Instance Fields settings blank. This integration does not use these settings.
Service Manager creates the instance. You can edit, enable, disable, or delete it in Integration Manager.
-
Enable the integration instance. SMIS will validate all the final phases you filled in the Integration Instance Parameters page and print warning messages if there are errors.
Step 2: Tailor Service Manager to handle phase change
In the Service Manager Change Management module, authorized users can manually change the phase of a change record. If the phase is changed to the one prior to the final approval phase in the SMBSM_DOWNTIME instance, the system will check if there are existing planned downtimes that have been set to Ready. If such downtimes exist, a window will open and provide two options for the corresponding planned downtimes:
- Click Yes to withdraw the corresponding planned downtimes from UCMDBthe RTSM. The changes or tasks need to be approved again to synchronize with UCMDBthe RTSM at another time.
- Click No. There will be no change to the planned downtimes even if the actual status of the changes or tasks are not approved.
Note: To disable the pop-up window when withdrawing the planned downtimes, you must set theWithdrawDowntimeparameter tofalsein the SMBSM_DOWNTIME instance. This operation may cause some unapproved planned downtimes to be synchronized to OBM.With Process Designer (PD) Content Pack 2 applied in Service Manager, you can tailor the process to transit changes or tasks from one phase that is after the final approval phase in the SMBSM_DOWNTIME instance to another that is prior to the final approval phase. To withdraw the related planned downtime for this kind of transition, you must add a rule set for the transition in the Closed Loop Incident Process (CLIP) solution. Follow these steps:
- Go to the target workflow that needs tailoring.
- Select the transition that moves a phase from before the final approval phase to after the final approval phase.
- In the Rule Sets section, click Add and select the clip.downtime.withdraw rule set.
- Click OK to save the workflow.
Step 3: Set up downtime sync jobs in OBMUCMDB
As part of CI synchronization, you have already set up an integration point between SM and OBMUCMDB. In this step, you add downtime synchronization jobs, so that scheduled downtime CIs are created in OBMUCMDB based on Requests for Change in SM.
To add the downtime synchronization jobs:
- Log in to your OBMUCMDB system as an administrator.
- Edit the existing integration point that connects to your Service Manager server.
- Click Administration > RTSM Administration> Data Flow Management > Integration StudioManagers > Data Flow Management > Integration Studio. OBM UCMDB displays a list of integration points.
- Select the existing SM integration point. Make sure that CIs have already been synchronized between SM and OBMUCMDB.
-
Create two integration jobs in the integration point on the Population tab:
- Create a new job including the
SM CLIP Down Time Populationjob definition. Under Scheduler Definition, select the Scheduler enabled checkbox and set the Repeat Interval to 1 Minute. Click OK to save the job. - Create another new job including the
SM CI Connection Downtime CIjob definition. Under Scheduler Definition, select the Scheduler enabled checkbox and set the Repeat Interval to 1 Minute. Click OK to save the job.
Pay attention to the running order. The
CLIP Down Time Populationjob must be run first. You can set the two jobs as schedule-based and set the schedule interval according to your needs. - Create a new job including the
Note: If no related CIs exist in the RTSM UCMDB when creating relationships, the population will fail or succeed with a warning. To disable the warning, remove the downtime CI that does not have related CIs in the RTSMUCMDB.Step 4: Set up creation of BSM Downtime CIs
In this step, BSM Downtime CIs are created based on Scheduled Downtime CIs.
To enable downtimes defined in SM to be sent to OBM, you must install the DFP2 in the OBM deployment.
Important:
-
Following the initial integration, a large amount of data may be communicated from SM to OBM. It is highly recommended that you perform this procedure during off-hours, to prevent negative impact on system performance.
To create BSM Downtime CIs:
-
Create a new Integration Point or, if existing, edit the SM Scheduled Downtime Integration Into BSM Integration Point:
-
Do the following on your OBM system. Do the following on your UCMDB:
Go to:
Administration > RTSM Administration > Data Flow Management > Integration Studio
Go to:
Managers> Data Flow Management > Integration Studio
-
Click New Integration Point or Edit, enter a name and description of your choice, and select the adapter SM Scheduled Downtime Integration Into BSM from the Service Manager folder.
If you have upgraded from an older version of OBM to OBM 10.10, you may still see the old "BSM Downtime Adapter", or you may see the "SM Scheduled Downtime Integration Into BSM" adapter in the Third Party Products folder (not in the Service Manager folder). In this case, you must upgrade your adapter by doing the following:
- Open the Package Manager.
- Deploy the package:
/opt/hp/BSM/odb/conf/factory_packages/BSMDowntimeAdapter.zipon the data processing server. - You should now find the SM Scheduled Downtime Integration Into BSM adapter in the Service Manager folder.
-
Enter the following information for the adapter: OBM GW or Load Balancer/Reverse Proxy FDQN and port (80/443), communication protocol (http/https), and the context root (if you have a non-default context root).
-
Specify the credentials for the OBM system. The specified user must have administrative rights in the RTSM.
Specify the credentials for the user you created to access the OBM system.
Choose generic protocol as protocol. -
Click OK, then click the Save button above the list of the integration points.
-
-
You can use the Statistics tab in the lower pane to track the number of downtimes that are created or updated. By default, the integration job runs every minute. If a job has failed, you can open the Query Status tab and double-click the failed job to see more details on the error.
If there is an authentication error, verify the OBM credentials entered for the integration point.
If you receive an unclear error message with error code, this generally indicates a communication problem. Check the communication with OBM.
A failed job will be repeated until the problem is fixed.
Step 5: Verify the SM-OBM downtime synchronization setup
When you have set up the Downtime integration, you can perform the following tasks to see if you have successfully set up your downtime synchronization.
Task 1. Open a new change of a category that has the final approval phase defined in SMIS
- Click Change Management > Create New Change.
- Select Hardware for example.
- In the Affected CI field, choose a CI that has been synchronized. For example:
adv-afr-desk-101. - Set Scheduled Downtime Start and Scheduled Downtime End to a future time.
- Select the Configuration Item(s) Down checkbox.
- Set other required fields.
- Click Validation Accepted. If you are prompted to fill in more required fields, supply the required information and click Validation Accepted again.
- Click Request Authorization.
- Click Save&Exit the change.
Task 2. Approve the change at the final approval phase
- Click Change Management > Task Queue.
- Search for the task that was created in Task 1 and click Close to close the task.
- Click Change Management > Search Change and search for the change opened in Task 1.
- Move the Change to the Change Approval phase by selecting Request Authorization.
- Log on to Service Manager with user account
Change.Approver. - Select Approval Inbox and search for the change created in Task 1.
- Approve the change.
Task 3. Create new format for the intClipDownTime table
-
Open the SM Windows client.
Note: This step can only be performed in the SM Windows client. - Enter fd into the search field to open the Forms Designer and click New.
- Create a new format for the intClipDownTime table by using the Form Wizard.
- Add all fields to this format.
Task 4. Check the corresponding intClipDownTime record
- From Database Manager, open the format of the intClipDownTime table.
- Click Search to see the record created for this downtime.
-
Check the External Status field:
External Status values Description NULLThe downtime is waiting for final approval, or the scheduler has not proceeded this record yet. 0(Canceled)The downtime is canceled before being implemented. 1(Ready)The downtime has been approved and is ready to be synchronized to UCMDB or BSM (RTSM). 2(Withdrawn)The downtime is approved firstly and then the approval is retracted (withdrawn). Notes:- Only downtime records with External Status
1can be synchronized. - If the External Status is not
1, wait some time for background schedulers SLA and SMBSM_DOWNTIME to process this record.
- Only downtime records with External Status
Task 5. Populate downtime from Service Manager to UCMDB
- From UCMDB, run the
CLIP Down Time Populationjob and theCI To Down Time CI With Connectionjob in a fixed order. - Search for the
adv-afr-desk-101CI in UCMDB. Check that a corresponding Scheduled Downtime CI is created, and a relationship between the Scheduled Downtime CI and the affected CI is created.
Task 6. Test if BSM Downtime CIs have been created
- In OBM, go to Administration > Service Health > Downtime Management.
- Check if a corresponding Downtime was created.
-
Sending downtime notifications from OBM to SM
OBM can send downtime start and end events to SM to notify operators of when a downtime occurs. This provides additional information to the SM operator in case of a downtime that was not driven by an RFC.
To enable OBM to send downtime start and end events to SM, follow these steps:
-
Access the following location in OBM:
Administration > Setup and Maintenance > Infrastructure Settings > Foundations > Downtime
- Change the value of the Downtime Send Event parameter to true.
- Restart your OBM services on all Gateway Servers and Data Processing Servers.
This procedure generates events in OBM. After performing it, make sure you edit and enable the Automatically forward "downtime started" and "downtime ended" events to Trouble Ticket System event forwarding rule to forward downtime-start and downtime-end events to the SM server that should be specified in the alias connected server called "Trouble Ticket System". For details on event forwarding and connected servers, see the OBM Administration Guide.
Downtime events use the following formats:
- Downtime Start
Event field OBM Downtime Severity Normal Category Downtime Notification Title Downtime for <CI Type><Affected CI Name>started at <Downtime Start Time> Key <OBM Downtime ID>:<Affected CI ID>:downtime-start SubmitCloseKey False OutageStartTime <Downtime Start Time> OutageEndTime <Downtime End Time> CiName <Affected CI Name> CiId <Affected CI Global ID> CiHint GUCMDB:<Affected CI Global ID>|UCMDB:<Affected CI ID> HostHint GUCMDB:<Related Host Global ID>|UCMDB:<Related Host ID> EtiHint downtime:start - Downtime End
Event field OBM Downtime Severity Normal Category Downtime Notification Title Downtime for <CI Type><Affected CI Name> ended at < Downtime End Time> Key <OBM Downtime ID>:<Affected CI ID>:downtime-stop SubmitCloseKey true CloseKeyPattern <OBM Downtime ID>:<Affected CI ID>:downtime-start EtiHint downtime:end LogOnly true -
-
View changes and incidents in OBM
This integration enables you to view planned changes and incident details in the Changes and Incidents and Hierarchy components in OBM.
-
Prerequisite
This integration requires that CIs are synchronized between the RTSM UCMDB and SM.
Out-of-the-box, OBM provides queries that are used to retrieve changes and incidents from SM. These queries need to be manually deployed to your UCMDB. On the OBM data processing server, go to
<OBM_Home>/odb/conf/factory_packagesand find theConsole.zippackage. Copy the package to the local directory on your UCMDB system and use the UCMDB Package Manager to deploy theconsole.zippackage to the UCMDB.This integration requires an administrator user account for OBM to connect to SM. This user account must already exist in both OBM and SM.
-
Configure the SM adapter time zone
Configure the time zone so Incidents and Planned Changes have the correct time definitions:
-
In SM, select Navigation pane > Menu navigation > System Administration > Base System Configuration > Miscellaneous > System Information Record. Open the Data Info tab.
-
In the Date Info tab, look up the value for the Time Zone.
-
In OBM, select Administration > RTSM Administration > Data Flow Management > Adapter Management.
-
In the Resources window, open ServiceManagerAdapter9-x > Configuration Files > ServiceManagerAdapter9-x/serviceDeskConfiguration.xml
Find the row that includes the following string:
<globalConnectorConfig>< next to the view name to choose specific KPIs. If no individual KPIs are selected, KPI status data will be forwarded for all CIs that are associated with the chosen view.
 -
Optional. In the Performance Dashboard Data section, choose one or multiple public favorites of your performance dashboards for which you want to forward data to BVD.
-
Optional. Clear the check box Activate after save if you want the status of the rule to be inactive after clicking Save. You can activate the rule at a later point in time.
-
Click Save to save the BVD data forwarding rule.
-
Integration
Complete the following workflow to integrate OBM and COSO Data Lake.
Prerequisite
Configure the infrastructure settings on the OBM machine by following the below steps.
- Log on to the OBM UI.
- Select Administration > Setup and Maintenance > Infrastructure Settings > Foundations > ITOM Intelligent Data Lake.
-
Enter the following endpoints:
-
Administration Endpoint:
https://<CDF_Master_FQDN>:36502/urest/v1/itom-data-ingestion-administration -
Data Access Endpoint:
https://<CDF_Master_FQDN>:36501/urest/v1/itom-data-ingestion-store -
Data Receiver End Point:
https://<CDF_Master_FQDN>:36500/itomdi/receiver
-
For OBM installed on a Linux machine:
-
On the OBM machine, create the
ca.crtby running the following command:/opt/OV/bin/ovcert -exporttrusted -file /tmp/ca.crt - Copy
/tmp/ca.crtand/opt/HP/BSM/opr/integration/idl/idl_config.shto the CDF master node where IIDL is running. -
Run the following commands on the CDF master node where IIDL is running:
chmod +x /tmp/idl_config.sh./idl_config.sh -cacert <path of ca.crt which was copied from OBM machine> -pod-restart -
Copy
/var/run/secrets/boostport.com/issue_ca.crtfrom the receiver container to the CDF master node by running the following command:kubectl exec <receiver pod name> -n <NAMESPACE> -c itom-di-receiver-cnt -- /bin/bash -c " su -c \"cat /var/run/secrets/boostport.com/issue_ca.crt\" receiveruser" > /tmp/issue_ca.crt - Copy the
issue_ca.crtfrom the CDF master node to the OBM machine. -
On OBM machine, run the following command:
/opt/HP/BSM/opr/bin/opr-config-idl.sh -cacert issue_ca.crt
For OBM installed on a Windows machine:
-
On OBM machine, create
ca.crtby running the following command:"%OvInstallDir%\bin\win64\ovcert" -exporttrusted -file C:\ca.crt - Copy the
C:\ca.crtand%TOPAZ_HOME%\opr\integration\idl\idl_config.shto the CDF master node where IIDL is running. -
Run the following commands on the CDF master node where IIDL is running:
chmod +x /tmp/idl_config.sh./idl_config.sh -cacert <ca.crt copied from OBM machine> -pod-restart -
Copy
issue_ca.crtfrom the receiver container to master by running the following command:kubectl exec <receiver pod name> -n <NAMESPACE> -c itom-di-receiver-cnt -- /bin/bash -c " su -c \"cat /var/run/secrets/boostport.com/issue_ca.crt\" receiveruser" > /tmp/issue_ca.crt - Copy the
issue_ca.crtfrom the CDF master node to the OBM machine. -
On OBM machine, run the following command:
%TOPAZ_HOME%\opr\bin\opr-config-idl.bat -cacert issue_ca.crt
You can integrate Cloud Optimizer with OBM to view the Cloud Optimizer alerts, topology, and performance graphs on OBM. Cloud Optimizer integration with OBM helps you to seamlessly monitor your virtual infrastructure from OBM. Integrating Cloud Optimizer with OBM allows you to monitor the virtual infrastructure provided by VMware vCenter, Microsoft Hyper-V, and KVM.
This integration can be achieved by installing the OBM Management Pack for Cloud Optimizer on Business Service Management (BSM) version 9.25 and Operations Manager i (OBM) 10.01 or higher. To support integration with BSM 9.25, you must install the BSM 9.25 latest hotfix. For the latest support matrix information, see the Software Product Support Matrix. Contact support for more information.
In a distributed environment, it must be installed on all BSM Data Processing Servers (BSM DPS) and BSM Gateway Severs (BSM GWS).
Prerequisites
All the monitored VM nodes should have the hostname set and the VMware tools running on them.
The OBM Management Pack for Cloud Optimizer works with OBM and provides the following features:
- Ready to deploy Management Template to suit different monitoring requirements.
- Ability to view Cloud Optimizer alerts and topology on OBM.
- Ability to view performance graphs.
The OBM Management Pack for Cloud Optimizer includes the following artifacts:
| Artifact | Name | Description |
| Management Template | Cloud Optimizer-Monitor (302.0) | Monitors the performance of virtual nodes. It consists of two Aspects: Cloud Optimizer Alerts and Cloud Optimizer Discovery. |
| Aspects | Cloud Optimizer-Alerts (302.0) | Forwards Cloud Optimizer alerts, vCenter events and alarms to OBM. It has four policies: Cloud Optimizer Alert Sensitivity, Cloud Optimizer Custom Alert Sensitivity Definition, Cloud Optimizer-EventMonitor, and Cloud Optimizer-OMIntegration. |
| Cloud Optimizer-Discovery (302.0) | Discovers the virtualization infrastructure. | |
| Policies | Cloud Optimizer-AlertSensitivity |
Used to handle alerts with high, medium, low, and custom sensitivity levels. The policy has a parameter named SensitivityLevel. SensitivityLevel can have values such as High, Medium, Low, and Custom. Deploying the vPV-AlertSensitivity policy will set the AlertToOm parameter to TRUE by default. This parameter is required to send alerts to OBM console. |
| Cloud Optimizer Custom Alert Sensitivity Definition | If you want to use custom sensitivity, set the SensitivityLevel parameter as Custom and edit the Cloud Optimizer Custom Alert Sensitivity Definition policy. | |
| Cloud Optimizer-EventMonitor | Used to monitor events and alarms from the Cloud Optimizer server. | |
| Cloud Optimizer-OMIntegration | Used to forward Cloud Optimizer alerts to the OM and OMi. You can use this policy to customize the severity of alerts. | |
| Cloud Optimizer-Discovery | Used to discover the virtualization infrastructure. | |
| Cloud Optimizer-SuppressAlerts | Used to suppress alerts. |
Integration
On Cloud Optimizer machine:
- Log on as an administrator.
- From the Cloud Optimizer home page, click Settings > Integration.
- In the Operations Manager/Operations Manager i (OM/OBM) section, click Download Zip Package (OBM).
- Copy the vPV_OBM_Integration.zip file and transfer it to all OBM machines (Gateway and the Data Processing Servers).
- Install Operations Agent 12.01 or later on the Cloud Optimizer machine. For more information, see the Operations Agent Installation section.
-
Cloud Optimizer 3.04 coexists only with Operations Agent 12.01 or later. For OBM integration, you must upgrade Operations Agent to 12.01 or later.
- Run the following command on the Cloud Optimizer machine to make sure the certificate is set between OBM and Cloud Optimizer machine.
Logs for event processing (for vPV-EventMonitor policy) on Cloud Optimizer
Add the following entry to /etc/logrotate.conf to manage the log file:
/var/opt/OV/log/events.log
{size 5M
create 700 root bin
rotate 3
}
/opt/OV/bin/OpC/install/opcactivate -srv <hostname> -cert_srv <hostname>
In this instance, <hostname> is the FQDN/IP address of the of the OBM server.
-
Log on to the OBM machine and grant the certificate.
The OBM machine here refers to OBM available with the Business Service Management (BSM) with Monitoring Automation version 9.25 (with latest BSM 9.25 hotfix applied), BSM 9.26, OBM 10.01 or higher. For latest support matrix information, see the Software Product Support Matrix.
On the OBM machine:
In a distributed environment, it must be installed on all BSM Data Processing Servers (BSM DPS) and BSM Gateway Severs (BSM GWS)
Make sure you have installed the OBM Management Pack for Infrastructure version 1.11 on the OBM machine. You can download it from Marketplace.
-
Extract the contents of the Cloud Optimizer OBM Integration Pack. Copy the Integration package to the respective folder:
On Windows:
c:\tempOn Linux:
/tmp -
Run the following commands to install the Cloud Optimizer OBM Integration Pack:
On Windows:
cscript vPV_integration_install.vbs -iOn Linux: .
/vPV_integration_install.sh -i -
After the installation is complete, check the log file (install.log). This is available in
<BSMInstallDir>/log/vpv_int_install.log. -
Add the Cloud Optimizer machine to the Nodes with Operations Agent group on the OBM machine.
Skip this step in case the node already exists
To access,
On BSM, click Admin > Operations Management > Setup > Monitored Nodes > Nodes with Operations Agent.
On OBM, click Administration > Setup and Maintenance > Monitored Nodes > Nodes with Operations Agent.
-
Before you begin monitoring, deploy the Management Template or Aspects provided by the OBM Management Pack for vPV.
If you are using Monitoring Automation for Composite Applications license, you can deploy either the OBM Management Pack for Cloud Optimizer Management Templates or OBM Management Pack for Cloud Optimizer Aspects to the CIs.
If you are using Monitoring Automation for Server license, you can deploy the OBM Management Pack for Cloud Optimizer Aspects.
-
Deploy the Aspects
To deploy the OBM Management Pack for Cloud Optimizer Aspects to the CIs:
Skip this task if you are using Monitoring Automation for Composite Applications license and have assigned the OBM Management Pack for Cloud Optimizer Management Templates to the CI
-
Open Management Templates and Aspects:
On OBM, click Administration > Monitoring > Management Templates and Aspects.
-
In the Configuration Folders pane, click Configuration Folders > Infrastructure Management > Cloud Optimizer Management Pack.
-
In the Management Templates and Aspects pane, right-click the Cloud Optimizer Discovery Aspect, and then click Assign and Deploy Item. The Assign and Deploy wizard opens.
You must first deploy the Cloud Optimizer Discovery Aspect followed by the Cloud Optimizer Alerts aspect.
-
In the Configuration Item tab, click the CI to which you want to assign the Management Template, and then click Next.
-
No editing is required in the Required Parameters tab, click Next.
-
To change the default values of the parameters, in the All Parameters tab on BSM 9.2x or Parameter Summary tab on OBM 10.x, you can select the parameter and then click Edit. The Edit Parameter dialog box opens. Click Value, specify the value, and then click OK.
-
(Optional). In the Configure Options tab, if you do not want to enable the assignment immediately, clear the Enable Assigned Objects check box. You can then enable the assignment later using the Assignments & Tuning.
-
Click Finish.
-
-
Identify and Deploy Management Template
To deploy the OBM Management Pack for Cloud Optimizer Management Templates to the CIs:
-
Open the Management Templates and Aspects:
On OBM, click Administration > Monitoring > Management Templates and Aspects.
-
In the Configuration Folders pane, click Configuration Folders > Infrastructure Management > Cloud Optimizer Management Pack.
-
In the Management Templates and Aspects pane, right-click Cloud Optimizer Monitor Aspect, and then click Assign and Deploy Item. The Assign and Deploy wizard opens.
-
In the Configuration Item tab, click the CI to which you want to assign the Management Template, and then click Next.
-
No editing is required in the Required Parameters tab, click Next.
-
To change the default values of the parameters, in the All Parameters tab on BSM 9.2x or Parameter Summary tab on OBM 10.x, you can select the parameter and then click Edit. The Edit Parameter dialog box opens. Click Value, specify the value, and then click OK.
-
(Optional). In the Configure Options tab, if you do not want to enable the assignment immediately, clear the Enable Assigned Objects check box. You can then enable the assignment later using the Assignments & Tuning pane.
-
Click Finish.
-
-
Verify the Cloud Optimizer Integration with OBM
After the Management Template has been successfully deployed, you can view the Cloud Optimizer alerts, topology, and performance graphs in OBM.
To verify the Cloud Optimizer and OBM integration, do the following on the OBM machine:
- Verify if the OprvPV Package is available in the OBM Package Manager.
- Verify if the vPV_Infrastructure view is created in the OBM Modeling Studio.
To verify if the OprvPV Package is available in the OBM Package Manager:
-
Navigate to
On BSM, Admin > RTSM Administration > CI Type Manager.
On OBM, Administration > RTSM Administration > Administration > Package Manager.
-
Search for OprvPV Package in the list of available packages.
To verify if the vPV_Infrastructure view is created in the OBM Modeling Studio:
-
Navigate to
On BSM, Admin > RTSM Administration > CI Type Manager.
On OBM, Administration > RTSM Administration > Modeling > Modeling Studio.
-
In the left pane, select Resources. Under the
rootfolder, locate Operations Management. -
Under the Operations Management folder, search for vPV > vPV_Infrastructure view.
Configuring SSO to View Performance Graphs in OBM
When you integrate Cloud Optimizer with OBM, you can view performance graphs for VMs, Cluster, Datastore, Datacenter, Resource Pool and Hosts in OBM.
Prerequisites
Configure OMi for Cloud Optimizer Single Sign-On (SSO) Utility
- DNS domain of your OBM/BSM server must be same as Cloud Optimizer server.
- initString configured in OBM/BSM server must be same as configured in Cloud Optimizer server.
- For proper functioning of SSO, the time should be in sync between the OBM server and Cloud Optimizer server.
The OBM machine here refers to OBM available with the Business Service Management (BSM) with Monitoring Automation version 9.25 (with latest BSM 9.25 hotfix applied), BSM 9.26, OBM10.01 or higher. For latest support matrix information, see the Software Product Support Matrix.
To get initString, on the OMi machine:
-
Go to Administration > Users > Authentication Management.
-
In the Single Sign-On Configuration section, select and copy the value for Token Creation Key (initString) field. This InitString is used to configure Cloud Optimizer for SSO.
To get initString, on the BSM machine:
- Go to Admin > Platform > Users and Permissions > Authentication Management.
-
Paste the Value of JMX to get/set Token Creation Key (initString) field to a notepad. Replace <gateway server> with the BSM server name.
If this URL does not work with the hostname of the gateway (external), log on to BSM machine and then replace the gateway server with the local host.
-
Copy the value and view it on a browser. The JMX MBean View appears.
-
In the list of MBean attributes, note the value for InitString attribute. This InitString is used to configure Cloud Optimizer for SSO.
On the Cloud Optimizer machine
Follow the steps:
- Log on as a root user.
-
Open the
lwssofmconf.xmlfile available at the following location:/opt/OV/www/webapps/PV/WEB-INF/classes/. -
Edit the values of
<domain>and<initString>in thelwssofmconf.xmlfile. For example,<validation>
<in-ui-lwsso>
<lwssoValidation id="ID000001">
<domain><hp.com></domain>
<crypto cipherType="symmetricBlockCipher"
engineName="AES" paddingModeName="CBC" keySize="256"
encodingMode="Base64Url"
initString="<mention the init string here>"</crypto>
</lwssoValidation>
</in-ui-lwsso>
</validation>
Make sure the
<domain>and<initString>are same in both Cloud Optimizer and OBM/BSM server. -
Use the
TRUSTED_SITE_URLparameter to configure the trusted websites for Cloud Optimizer. An application will be able to embed Cloud Optimizer page within itself only if theTRUSTED_SITE_URLparameter is set in thePVconfig.inifile.If the application that wants to embed Cloud Optimizer has the URL
mydashboard.company.com/home, you must do the following configuration in thePVconfig.inifile:TRUSTED_SITE_URL=http or https://<application_URL, for example, mydashboard.company.com>
For OMi,
http://<FQDN of OBM>
https://<FQDN of OBM>
- Restart
tomcatBservice.
Add Components in OBM
Perform the following steps to add components in OBM:
-
Log on to OBM UI.
-
Select Workspace> My Workspace.
-
Select Create a new page > Add component. A pop up window opens, click * to add a component.
The New Component dialog box opens.
- Enter the name, URL(( http://<vPV_FQDN>:<port number>/PV/?CTX=BSM )for SSO)) and description for the new component.
-
Click OK.
After configuring the prerequisites, follow these steps to view the performance graphs in OMi:
-
On BSM, navigate to, Applications > Operations Management > Performance Perspective.
On OBM, navigate to, Workspace > Operations Console > Performance Perspective.
-
In the View Explorer pane, select vPV_Infrastructure.
-
Select a Configuration Item (CI) to draw the performance graphs.
Customize the Severity of Alerts
To customize the severity of alerts that are being forwarded to OM/OBM, follow these steps:
-
Navigate to
On OM, click Policy Management > Policy Groups > vPV-Integration.
On OBM, click Administration > Monitoring > Policy Templates > Policy Management > Templates grouped by type > Events> Open Message Interface.
-
In the Policy Template pane, double-click the vPV-OMIntegration policy.
The vPV-OMIntegration - Edit Open Message Interface window appears.
-
Click the Rules tab.
-
Double-click the rule for which you want to customize the severity.
-
Set the Severity for the rule as Normal, Minor, Critical, Warning, or Major.
-
Click Save or Save and Close.
-
Assign and Deploy the changes.


Legal Notices
Warranty
The only warranties for products and services of Micro Focus and its affiliates and licensors (“Micro Focus”) are set forth in the express warranty statements accompanying such products and services. Nothing herein should be construed as constituting an additional warranty. Micro Focus shall not be liable for technical or editorial errors or omissions contained herein. The information contained herein is subject to change without notice.
Restricted Rights Legend
Confidential computer software. Except as specifically indicated otherwise, a valid license from Micro Focus is required for possession, use or copying. Consistent with FAR 12.211 and 12.212, Commercial Computer Software, Computer Software Documentation, and Technical Data for Commercial Items are licensed to the U.S. Government under vendor's standard commercial license.
Copyright Notice
© Copyright 2015 - 2018 EntIT Software LLC, a Micro Focus company