


View package statistics
The Pipeline Statistics tab displays detailed information about packages and includes graphical representations of package summary, trends, states, deployment status and so on. It provides a holistic view of all packages and deployments and enables you to make informed decisions with respect to package deployment.
To view package statistics
- Navigate to Release Automation > Release Pipeline.
-
Select the type of design (topology or sequenced) for which you need to view the package statistics, from the drop-down list on the left hand side of the screen. (Topology Designs is selected by default).
-
From the list of designs on the left hand side of the screen, select the design whose package information you want to view.
-
Click the Pipeline Statistics tab in the right pane.
You can view the pipeline statistics for all versions of the package. By default, the current version statistics are displayed. To view the statistics for an older version, select the Application Version from the drop-down list available on the right-hand side of the screen.
To view the latest package statistics, click the gear button on the right-hand side of the screen and select Refresh.
The following table lists the metrics that comprise pipeline statistics:
Metric Description Package Trend Displays in line graph format, the days during which packages were created. The X-axis represents the dates and the Y-axis represents the number of packages.
Hover your cursor on the X-axis to view the number of packages created on any date.
Release Progression The mouth or the top layer of the funnel represents the first lifecycle stage and the bottom layer of the funnel represents the last lifecycle stage. Each layer displays the total number of packages that are not only present in the stage but also those that have successfully transitioned to the next stage.
The colors that represent each lifecycle stage in the funnel are the colors that were set when the lifecycle stage was created.
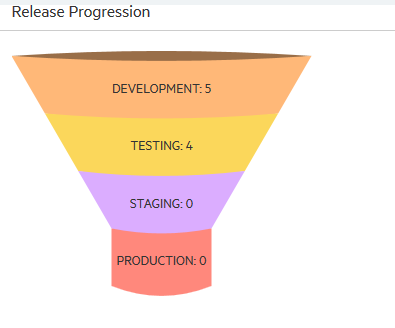
For example, in the figure above, a total of 5 packages were in the Development stage, out of which 4 were sent to the Testing stage. From the Testing stage, 0 were sent to the Staging stage and from there 0 were sent to the Production stage.
This implies that out of 5 packages, 4 are in the Testing stage and 1 is still in the Development stage.
Package Summary Displays in pie chart format the number of packages in each lifecycle stage. The colors used for each lifecycle stage are the colors set when the lifecycle stage was created. The number of packages in each state is displayed below the pie chart. Deployment Summary Displays in pie chart format the number of deployments in each lifecycle stage. The colors used for each lifecycle stage are the colors set when the lifecycle stage was created. The number of deployments in each state is displayed below the pie chart. Package Status Displays in bar graph format, in each lifecycle stage the number of packages in each state. The X-axis represents the lifecycle stages and the Y-axis represents the number of packages. The different colors represent the different package states.
Select Grouped to view different bars for each package state or Stacked to view all package states in one bar.
See Lifecycle stages and actions for details about package states.
Deployment Status Displays in bar graph format, in each lifecycle stage the number of deployments in each state. The X-axis represents the lifecycle stages and the Y-axis represents the number of deployments. The different colors represent the different deployments.
This graph depicts the number of deployments that are not canceled in the system and how many resources are consumed.
Select Grouped to view different bars for each deployment or Stacked to view all deployments in one bar.