Pipeline statistics
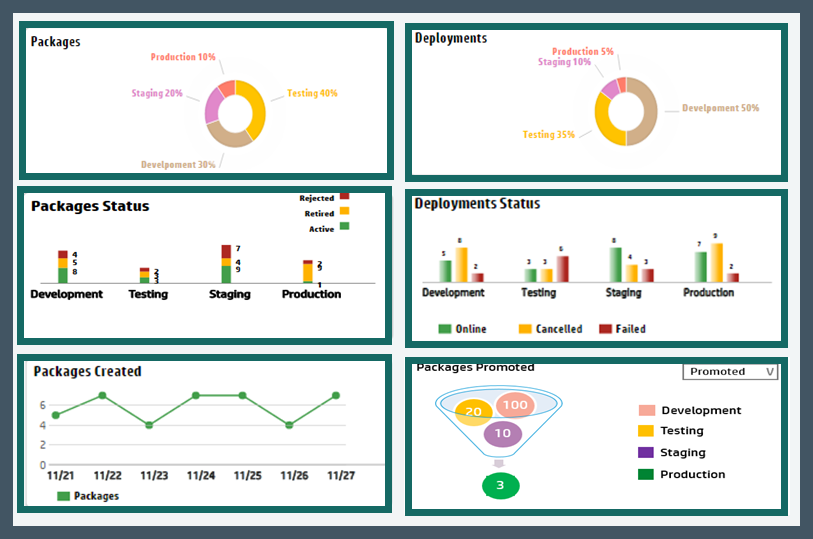
The Pipeline Statistics tab displays detailed information about packages and includes graphical representations of package summary, trends, states, deployment status and so on. It provides a holistic view of all packages and deployments and enables you to make informed decisions with respect to package deployment.
It displays information about the number of packages created on any date, the number of successful transitions, the number of deployments and so on.
For detailed information about the pipeline statistics, see the Codar Online Help.