


How to run and view net value simulation
Read this topic to learn how to run the net value simulation and how to view the graphical net value trend.
How to run net value simulation
To run the net value simulation, follow these steps:
- From the , select Build > Financials > Net Value Simulation.
-
Select the asset type from the following:
- Devices
- Infrastructure & Peripheral
- Licenses
- Click the Filter
 button in each asset type to filter the simulation criteria. This narrows down the simulation scope.
 -
From Run simulation by, select from the following:
-
DATE: Click the Calendar
 button to specify a date. The Simulated net value column in the right panel shows the estimated net value of the selected asset on the date that is specified.
 -
VALUE: Fill in a value in the Less than field. When the net value is less than the specified value for the first time, the following columns will be displayed in the right panel:
- Simulated net value: Shows the estimated value of the asset record that meet the criteria for the first time.
- Simulated date: Shows the date when the asset record meets the criteria for the first time.
Note The value is calculated based on the depreciation rate of the asset. If the asset is not depreciated to the specified value within the depreciation period, the last date of the depreciation duration will be displayed in the Simulated date column and the net value on that day will be displayed in the Simulated net value column.
-
- Click Run simulation.
All asset records that meet the filter criteria are displayed in the asset table of the right panel.
How to view net value trend
To view the graphical net value trend of a certain asset, select the value of the asset record in the Simulated net value column. The graphical net value trend is displayed.
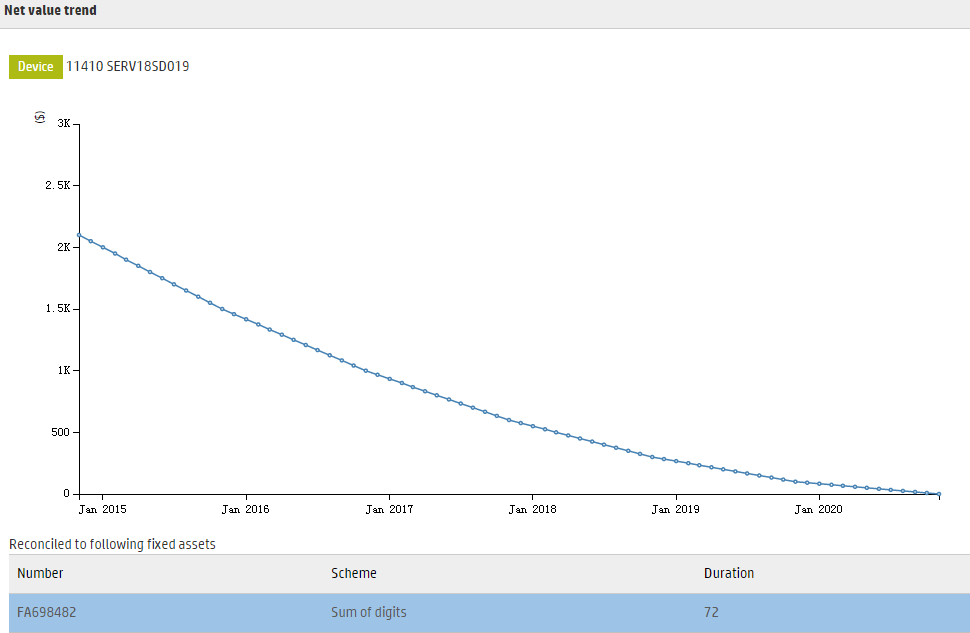
By pointing to the line, you can view the predicted net value of the asset on various dates.
If there are other fixed assets associated with the selected asset, they are displayed under the net value trend as well.
Related topics


