Searching the Help
To search for information in the Help, type a word or phrase in the Search box. When you enter a group of words, OR is inferred. You can use Boolean operators to refine your search.
Results returned are case insensitive. However, results ranking takes case into account and assigns higher scores to case matches. Therefore, a search for "cats" followed by a search for "Cats" would return the same number of Help topics, but the order in which the topics are listed would be different.
| Search for | Example | Results |
|---|---|---|
| A single word | cat
|
Topics that contain the word "cat". You will also find its grammatical variations, such as "cats". |
|
A phrase. You can specify that the search results contain a specific phrase. |
"cat food" (quotation marks) |
Topics that contain the literal phrase "cat food" and all its grammatical variations. Without the quotation marks, the query is equivalent to specifying an OR operator, which finds topics with one of the individual words instead of the phrase. |
| Search for | Operator | Example |
|---|---|---|
|
Two or more words in the same topic |
|
|
| Either word in a topic |
|
|
| Topics that do not contain a specific word or phrase |
|
|
| Topics that contain one string and do not contain another | ^ (caret) |
cat ^ mouse
|
| A combination of search types | ( ) parentheses |
|
How to edit a portfolio record
-
From the main menu, select Plan > Application Portfolio > Portfolios. Service Management displays a list of portfolios.
-
Select the portfolio record that you want to edit.
To filter the record list, click the Add filter
 button. For more information, see Filters.
 -
Click the portfolio identifier in the ID column to display the selected record, or click Edit in the portfolio preview panel.
-
By default, the portfolio is displayed with the General tab selected. Click the tab you want to edit or view:
Tab Description General Displays general information about the selected portfolio. For more information about the General tab, see General tab. Contents Displays the applications that are included in the portfolio. For more information about the Contents tab, see Contents tab. Roadmaps Displays the active roadmaps of all applications. For more information about roadmaps, see Roadmaps tab. Optimizations Displays the optimization records in which the selected portfolio is assessed and analyzed. For more information about optimization, see Optimization tab. Analysis Displays an application analysis chart. For more information about application analysis, see Analysis tab. Discussions Displays any relevant conversations about the selected portfolio. For more information about discussions, see Discussions. History Displays changes to the selected portfolio. For more information about history, see History. - Click
 Save when you are finished.
General tab
This tab includes the following portfolio details.
| Field | Description |
|---|---|
| Title | The title for the portfolio. |
| Description | The description that captures the details of the portfolio. |
| Created by | The name of the portfolio creator. |
| Owner | The owner of the portfolio. |
| Owning group |
The business group that owns the portfolio. Note Only organizational groups can be selected. |
| Creation time | The time that the portfolio was created. |
Contents tab
The Contents tab displays the IDs and titles of the applications that are included in the portfolio.
You can add applications to the portfolio or remove them from the portfolio.
To add a linked record:
-
Click Add or the grid icon
 .
. -
Select the record(s). The added items appear in yellow.
-
Click Save.
To remove a linked record:
-
Select the record(s).
-
Click Remove. The selected items appear in strikethrough text.
-
Click Save.
To view the application details, click the application ID.
Note At maximum, 200 applications are supported in a single portfolio.
Roadmaps tab
The Roadmaps tab displays the active roadmaps of all applications in the portfolio. If more than one roadmap is associated with the application, only the active one is displayed.
To change the granularity of the view, click Year, Quarter, Month, or Week above the roadmaps.
The time periods marked in light blue indicate the roadmap phases; the blue flags on the roadmaps indicate the milestones.
Hover over a phase to view its details:
- Phase ID
- Phase name
- Start date
- Finish date
Hover over a milestone to view its details:
- Milestone ID
- Milestone name
- Milestone date
To view the application details, click the application name.
Optimizations tab
The Optimizations tab displays the following information of the optimization records in which the selected portfolio is assessed and analyzed:
- ID
- Title
- Optimization type
- Phase ID
- Creator
Analysis tab
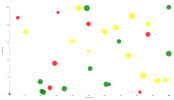
The Analysis tab displays the analysis of all applications. Each application in the chart is displayed as a bubble.
When you hover over a bubble, the following information about the application is displayed:
- ID
- Title
- Category
- Description
The bubble chart includes the following elements:
| UI element | Description |
|---|---|
| Bubble size | Indicates the total cost of ownership (TCO) of the portfolio — the larger in size, the higher in TCO. |
| Bubble color |
Indicates the health status of the application:
|
| X axis of the chart | Indicates the quality rating of the application. |
| Y axis of the chart | Indicates the value rating of the application. |
Related topics


