


View Performance Dashboard
Performance Dashboards represent a pictorial representation of metrics. The OMi MP for Docker includes the performance dashboard, which is mapped to the Docker host or container CIT. The graphs are generated from the DOCKER data source. For information about creating and viewing graphs, see the documents for Performance Dashboard available in documentation for the Operations Manager i.
How to View Performance Dashboard
Performance Perspective enables you to populate graphs from existing graph templates. You can also plot customized graphs by selecting the required metrics for a selected CI.
To view the Performance Perspective of DOCKER CIs using dashboard, follow these steps:
-
Open the Performance Perspective pane:
Click Applications > Operations Management > Performance Perspective.
The View Explorer pane appears.
- In the Browse Views tab, select the Docker_Topology or DockerSwarm_TopologyView.
-
Select the Docker Container CI.
The default dashboard available for the Docker_Topology or DockerSwarm_Topology View appears in the Performance pane.
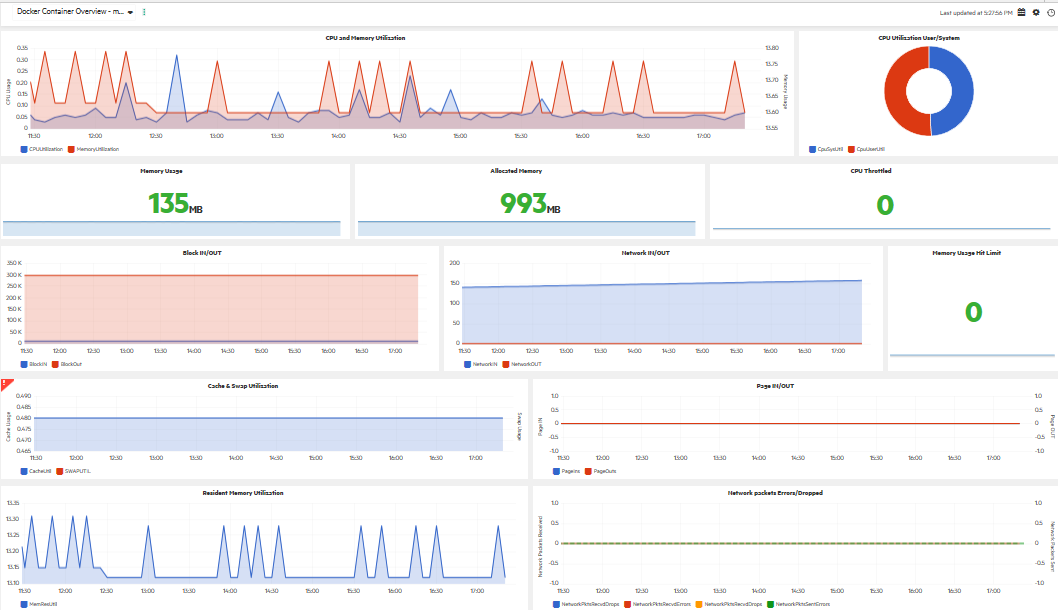
Sample of Docker Performance Dashboard
List of Performance Dashboards
| Datasource | Performance Dashboard |
|---|---|
| Operations Agent |
Docker Host Docker Container Overview |
| Metric streaming | Docker Container Overview (OpsBridge Store) |
Types of Performance Dashboard
| Performance Dashboard | Graphs | Metrics |
|---|---|---|
| Docker Host | Total Images | DOCKER_HOST / IMAGES |
| Containers Stopped | DOCKER_HOST / STOPPED | |
| Containers Paused | DOCKER_HOST / PAUSED | |
| Container Status | DOCKER_HOST / PAUSED | |
| DOCKER_HOST / RUNNING | ||
| DOCKER_HOST / STOPPED | ||
| Containers Running | DOCKER_HOST / RUNNING | |
| DISK% | DOCKER_HOST / GBL_DISK_UTIL_PEAK | |
| CPU% | DOCKER_HOST / GBL_CPU_TOTAL_UTIL | |
| MEMORY% | DOCKER_HOST / GBL_MEM_UTIL | |
| NETWORK% | DOCKER_HOST / GBL_NET_UTIL_PEAK | |
| Network Input Output Packet Breakdown | DOCKER_HOST / GBL_NET_IN_PACKET | |
| DOCKER_HOST / GBL_NET_OUT_PACKET | ||
| Docker Host | System Wide CPU and Memory Usage | DOCKER_HOST / GBL_CPU_TOTAL_UTIL |
| DOCKER_HOST / GBL_MEM_UTIL | ||
| Memory Usage % Break down | DOCKER_HOST / GBL_MEM_SYS_UTIL | |
| DOCKER_HOST / GBL_MEM_USERS_UTIL | ||
| CPU Usage % Breakdown | DOCKER_HOST / GBL_CPU_SYS_MODE_UTIL | |
| DOCKER_HOST / GBL_CPU_USERS_MODE_UTIL | ||
| Disk Read and Write Byte Breakdown | DOCKER_HOST / GBL_DISK_PHYS_READ_BYTE | |
| DOCKER_HOST / GBL_DISK_PHYS_WRITE_BYTE | ||
| Docker Container Overview | CPU and Memory Utilization | DOCKER / MEMORYUTILIZATION |
| DOCKER / CPUUTILIZATION | ||
| CPU Utilization User/System | DOCKER / CPUSYSYTIL | |
| DOCKER / CPUUSERUTIL | ||
| Memory Usage | DOCKER / MEMORYUSAGE | |
| Allocated Memory | DOCKER / ALLOCATED MEMORY | |
| CPU Throttled | DOCKER / CPUTHROTTLED | |
| Block IN/OUT | DOCKER / BLOCKIN | |
| DOCKER / BLOCKOUT | ||
| Network IN/OUT | DOCKER / NETWORKIN | |
| DOCKER / NETWORKOUT | ||
| Memory Usage Hit Limit | DOCKER/ MEMORYUSGHITLIMITS | |
| Docker Container Overview | Cache & Swap Utilization | DOCKER / CACHEUTIL |
| DOCKER / SWAPUTIL | ||
| Page IN/OUT | DOCKER / PAGEINS | |
| DOCKER / PAGEOUTS | ||
| Resident Memory Utilization | DOCKER / MEMRESUTIL | |
| Network packets Errors/Dropped | DOCKER / NETWORKPKTSRECVDDROPS | |
| DOCKER / NETWORKPKTSRECVDERRORS | ||
| DOCKER / NETWORKPKTSSENTDROPS | ||
| DOCKER / NETWORKPKTSSENTERRORS |