


View Performance Dashboard
Performance Dashboards represent a pictorial representation of metrics. The OMi MP for Google Cloud includes the performance dashboard. The graphs are generated from the GOOGLECLOUD data source. For information about creating and viewing graphs, see the documents for Performance Dashboard available in documentation for the Operations Manager i.
View Performance Dashboard
Performance Perspective enables you to populate graphs from existing graph templates. You can also plot customized graphs by selecting the required metrics for a selected CI.
To view the Performance Perspective of GOOGLECLOUD CIs using dashboard, follow these steps:
-
Open the Performance Perspective pane:
Click Workspaces > Operations Console > Performance Perspective.
The View Explorer pane appears.
-
In the Browse Views tab, select the GoogleCloudGCEInstance_Deployment view.
The default graphs or dashboard available for the GoogleCloudGCEInstance_Deployment appears in the Performance pane.
The following is an example of GoogleCloudGCEInstance_Deployment Performance Dashboard:
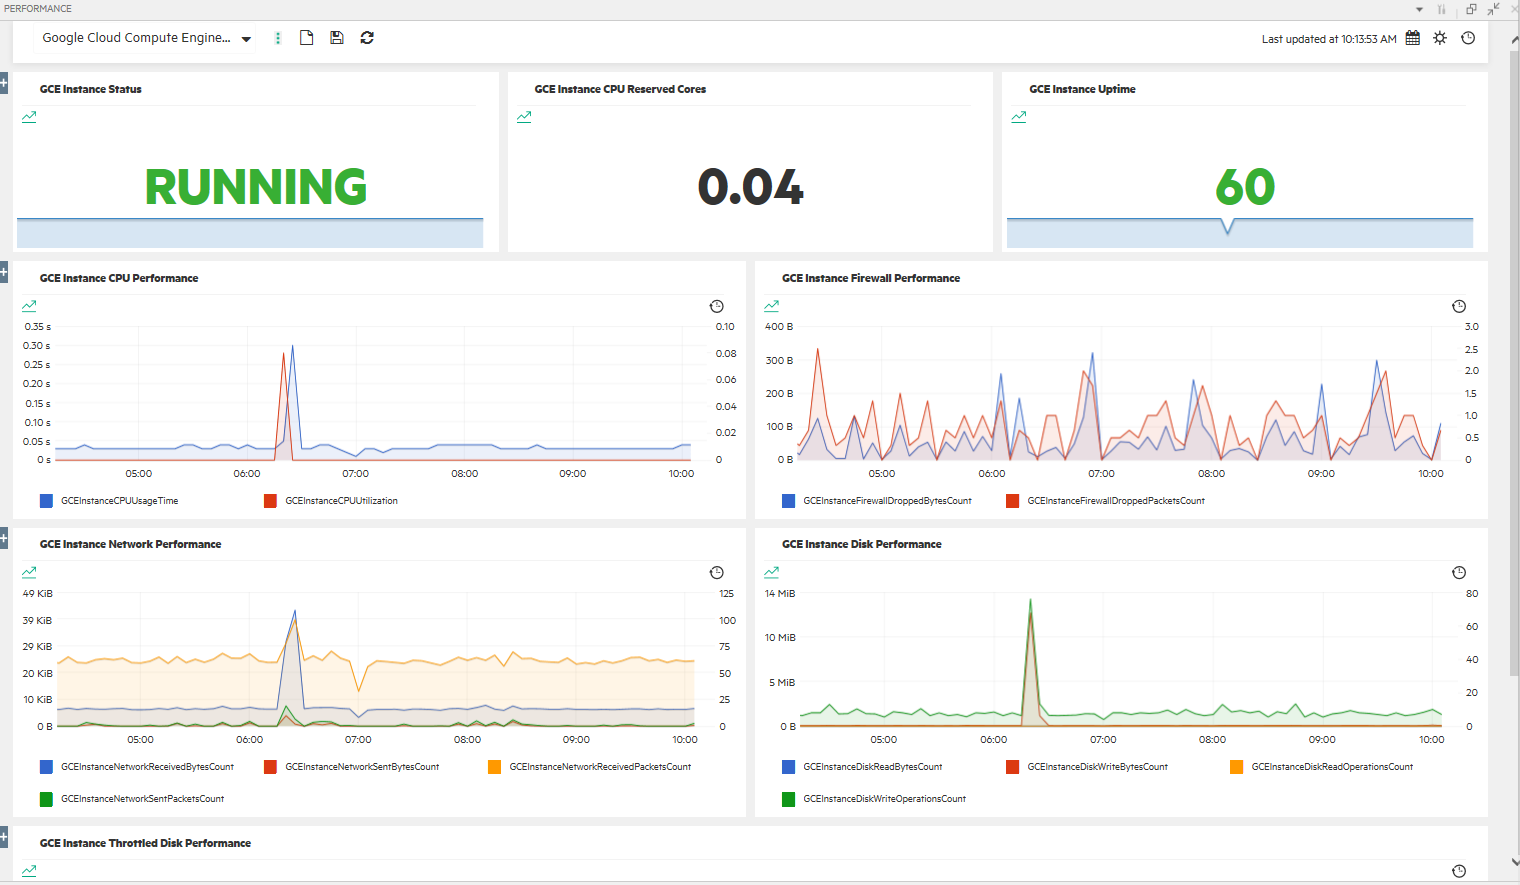
List of Performance Dashboard
| Datasource | Performance Dashboard |
|---|---|
| Operations Agent |
Google Cloud Compute Engine Instance Performance
|
Types of Performance Dashboard
| Performance Dashboard | Graphs | Metrics |
|---|---|---|
| Google Cloud Compute Engine Instance Performance |
GCE Instance Status |
GCEINSTANCESTATUS |
|
GCE Instance CPU Reserved Cores |
GCEINSTANCECPUUSAGETIME |
|
| GCE Instance Uptime | GCEINSTANCEUPTIME | |
|
GCE Instance CPU Performance |
GCEINSTANCECPUUSAGETIME GCEINSTANCECPUUTILIZATION |
|
| GCE Instance Firewall Performance |
GCEINSTANCEFIREWALLDROPPEDBYTESCOUNT GCEINSTANCEFIREWALLDROPPEDPACKETSCOUNT |
|
|
GCE Instance Network Performance |
GCEINSTANCENETWORKRECEIVEDBYTESCOUNT GCEINSTANCENETWORKSENTBYTESCOUNT GCEINSTANCENETWORKRECEIVEDPACKETSCOUNT GCEINSTANCENETWORKSENTPACKETSCOUNT |
|
|
GCE Instance Disk Performance |
GCEINSTANCEDISKREADBYTESCOUNT GCEINSTANCEDISKWRITEBYTESCOUNT GCEINSTANCEDISKREADOPERATIONSCOUNT GCEINSTANCEDISKWRITEOPERATIONSCOUNT |
|
|
GCE Instance Throttled Disk Performance |
GCEINSTANCEDISKTHROTTLEDREADBYTESCOUNT GCEINSTANCEDISKTHROTTLEDWRITEBYTESCOUNT GCEINSTANCEDISKTHROTTLEDREADOPSCOUNT GCEINSTANCEDISKTHROTTLEDWRITEOPSCOUNT |


