Searching the Help
To search for information in the Help, type a word or phrase in the Search box. When you enter a group of words, OR is inferred. You can use Boolean operators to refine your search.
Results returned are case insensitive. However, results ranking takes case into account and assigns higher scores to case matches. Therefore, a search for "cats" followed by a search for "Cats" would return the same number of Help topics, but the order in which the topics are listed would be different.
| Search for | Example | Results |
|---|---|---|
| A single word | cat
|
Topics that contain the word "cat". You will also find its grammatical variations, such as "cats". |
|
A phrase. You can specify that the search results contain a specific phrase. |
"cat food" (quotation marks) |
Topics that contain the literal phrase "cat food" and all its grammatical variations. Without the quotation marks, the query is equivalent to specifying an OR operator, which finds topics with one of the individual words instead of the phrase. |
| Search for | Operator | Example |
|---|---|---|
|
Two or more words in the same topic |
|
|
| Either word in a topic |
|
|
| Topics that do not contain a specific word or phrase |
|
|
| Topics that contain one string and do not contain another | ^ (caret) |
cat ^ mouse
|
| A combination of search types | ( ) parentheses |
|
Health and status
Enrich your dashboards and put your team's focus on the things that matter most to your organization by using customized health and key performance indicators. Ensure that you uphold your service level agreements (SLAs) by monitoring the relevant KPIs and tracking how they change over time. Dashboard topological views can be linked to health indicators to provide the best overview. This enables you to more quickly and easily prioritize and assign events that have the most impact.
When setting up a new monitored application, key performance indicators (KPIs) and health indicators (HIs) need to be considered first. The following are the key questions that must be answered:
-
If application availability and performance is important, how should those KPIs be measured?
-
What are the SLAs that might be breached if application availability and performance thresholds are not met?
The IT organization is not only responsible for ensuring that this application is available, but also that all associated resources perform according to user expectations. All of this information must be factored into the selection of KPIs and the definition of HIs.
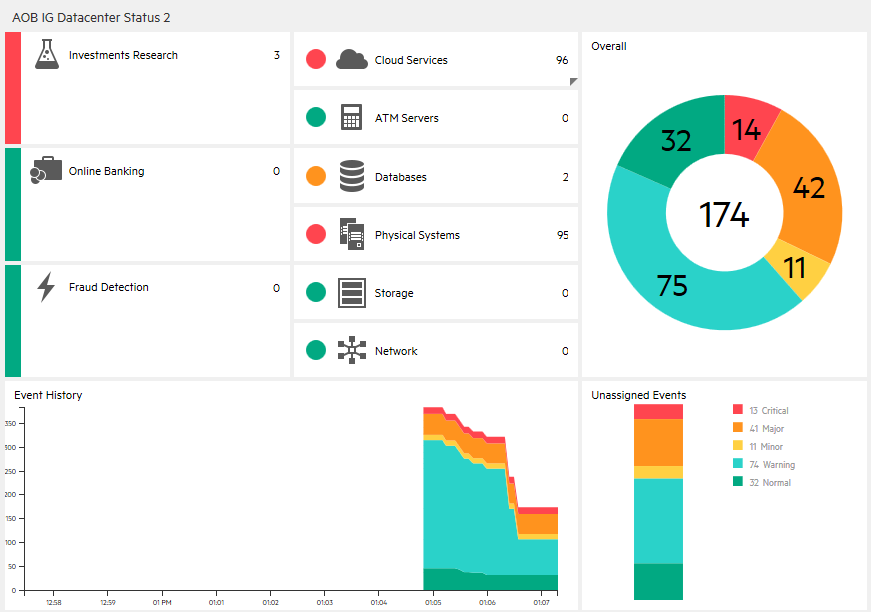
Monitoring Dashboards provide you with an at-a-glance overview of the events from your monitored environment. They enable you to quickly assess the health of the environment and to identify areas that require your attention.
Monitoring Dashboards display status information by using widgets as building blocks (for example, stack and pie widgets). Each widget references an event filter, a view, or both, and displays only the status of those events that match the criteria of the filter and that are related to the CIs included in the referenced view, making it easy to customize.
Users can configure their own dashboards, or use default dashboards, including the 360° View dashboard, which provides a high-level overview of the status of CIs in a selected view, or the KPI Over Time dashboard, which shows the status or the value of selected KPIs and CIs over time. The Top View also enables users to see the business availability of system components at a glance.
The following figure shows a Monitoring Dashboard screen:

With event-based data, you can see which related CI is affected by an event. Additionally, health data, such as event type indicators (ETIs), health indicators (HIs), and KPIs, is used to evaluate the health of related CIs in the context of the event.
HIs provide fine-grained measurements on the CIs that represent your monitored applications and business services. Some HIs provide business metrics such as backlog and volume, while others monitor various aspects of performance and availability such as CPU load or disk space.
ETIs are categorizations of events. As multiple data collectors may send event samples regarding a single event to OMi, events are generalized into a common type.
For any device, such as a server, the severity of the problems directly associated with the server is collated and combined with the information about the devices associated with the server. The combined data is passed to calculation rules that evaluate and set the KPIs that indicate the overall health of the object.
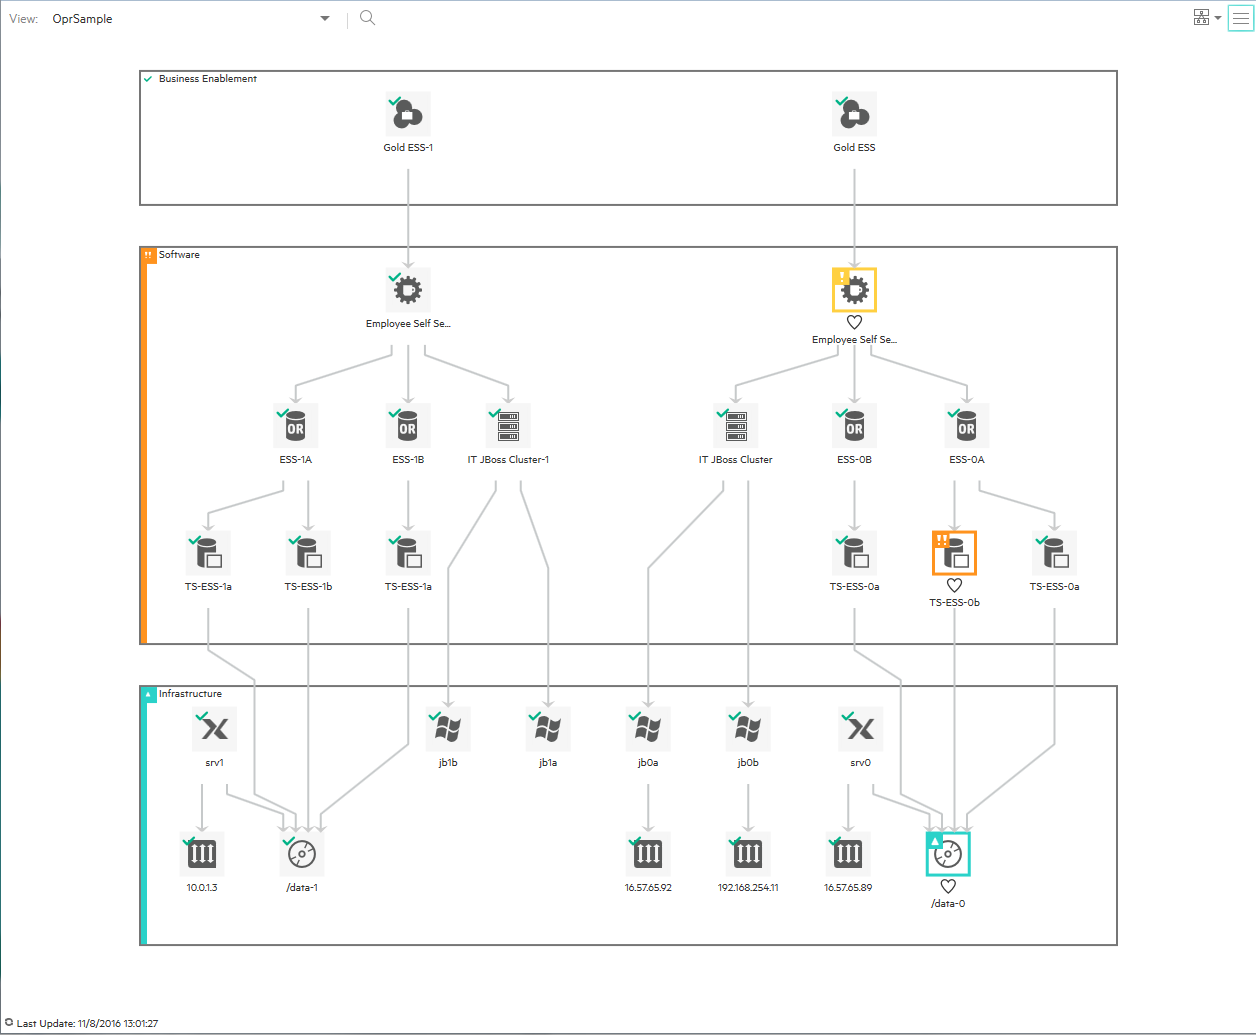
The following figure shows part of a Health Perspective screen, in particular the Health Top View, which shows a hierarchical overview of the relationships among the objects associated with a selected event:

You can see the health status of an object, its KPIs, and HIs, and see how the health status of the selected object affects the health of related objects. For example, you can navigate to check the health of neighboring CIs. This information helps you analyze which events to focus on, and prioritize event handling to maximize availability and minimize negative impact on business services. Users can also select views to show only the events and CIs for which they are responsible.
We welcome your comments!
To open the configured email client on this computer, open an email window.
Otherwise, copy the information below to a web mail client, and send this email to ovdoc-asm@hpe.com.
Help Topic ID:
Product:
Topic Title:
Feedback:


