


Performance Dashboard
Performance Dashboard represents pictorial representation of metrics. This includes the performance dashboard, AWS CIT. The graphs are generated from the AWS data source. For more information about creating and viewing graphs, see the documents for Performance Dashboard available in documentation for the HPE Operations Manager i.
How to View Performance Dashboard
Performance Perspective enables you to populate graphs from existing graph templates. You can also plot customized graphs by selecting the required metrics for a selected CI. To view the Performance Perspective of Windows or LogicalVolume CIs using dashboard, follow these steps:
-
Open the Performance Perspective pane:
Click Workspaces > Operations Console > Performance Perspective.
The View Explorer pane appears.
- In the Browse Views tab, select the AWS_EC2 View. The default graphs or dashboard available for the AWS_EC2 View appears in the Performance pane.
-
Select the one of the following Performance Dashboard.
Data source Performance Dashboard Operations Agent AWS Compute Overview
AWS EBS Overview
Metric streaming AWS Compute Overview (OpsBridge Store)
AWS EBS Overview (OpsBridge Store)
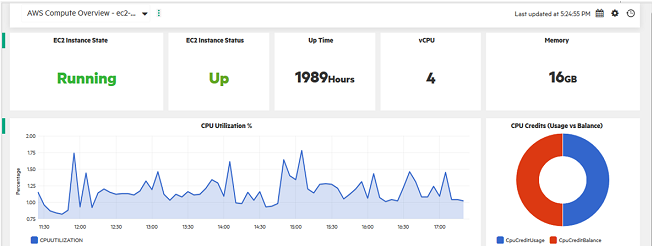
Sample of AWS Compute Overview
Type of Performance Dashboards
| CI | Performance Dashboard | Graphs | Metrics |
|---|---|---|---|
| Computer (VM instance) |
AWS Compute Overview and AWS Compute Overview (OpsBridge Store) |
EC2 Instance State | AWS:EC2_METRICS / STATE |
| EC2 Instance Status | AWS:EC2_METRICS / STATUSCHECKINST | ||
| Up Time | AWS:EC2_META / INSTANCE_AGE | ||
| vCPU | AWS:EC2_META / VCPU | ||
| Memory | AWS:EC2_META / MEMORY_GB | ||
| CPU Utilization % | AWS:EC2_METRICS / CPUUTILIZATION | ||
| CPU Credits (Usage vs Balance) | AWS:EC2_METRICS / CPUCREDITUSAGE | ||
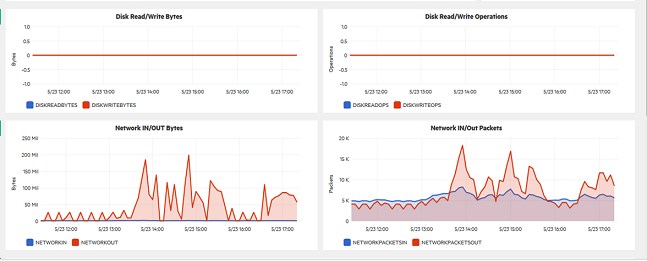
| Disk Read/Write Bytes | AWS:EC2_METRICS / DISKREADBYTES | ||
| Disk Read/Write Operations | AWS:EC2_METRICS / DISKREADOPS | ||
| Network IN/OUT Bytes | AWS:EC2_METRICS / NETWORKIN | ||
| AWS:EC2_METRICS / NETWORKOUT | |||
| Network IN/OUT Packets | AWS:EC2_METRICS / NETWORKPACKETSIN | ||
| AWS:EC2_METRICS / NETWORKPACKETSOUT | |||
| Logical Volume |
AWS EBS Overview and AWS EBS Overview (OpsBridge Store) |
Burst Balance | AWS:EC2__EBS_METRICS / BURSTBALANCE |
| Read Write Ops | AWS:EC2__EBS_METRICS / VOLUMEREADOPS | ||
| AWS:EC2__EBS_METRICS / VOLUMEWRITEOPS | |||
| Total Read-Write Time | AWS:EC2__EBS_METRICS / VOLTOTALREADTIME | ||
| AWS:EC2__EBS_METRICS / VOLTOTALWRITETIME | |||
| Volume Size | AWS:EC2__EBS_METRICS / VOLUME_SIZE | ||
| Read Bytes | AWS:EC2__EBS_METRICS / VOLUMEREADBYTES | ||
| Write Bytes | AWS:EC2__EBS_METRICS / VOLUMEWRITEBYTES | ||
| Queue Length | AWS:EC2__EBS_METRICS / VOLUMEQUEUELENGTH | ||
| CONS READ WRITE OPS | AWS:EC2__EBS_METRICS / VOLCONSREADWRITEOPS | ||
| Throughput % | AWS:EC2__EBS_METRICS / VOLTHROUGHPUTPCT | ||
| Idle Time | AWS:EC2__EBS_METRICS / VOLUMEIDLETIME |