Searching the Help
To search for information in the Help, type a word or phrase in the Search box. When you enter a group of words, OR is inferred. You can use Boolean operators to refine your search.
Results returned are case insensitive. However, results ranking takes case into account and assigns higher scores to case matches. Therefore, a search for "cats" followed by a search for "Cats" would return the same number of Help topics, but the order in which the topics are listed would be different.
| Search for | Example | Results |
|---|---|---|
| A single word | cat
|
Topics that contain the word "cat". You will also find its grammatical variations, such as "cats". |
|
A phrase. You can specify that the search results contain a specific phrase. |
"cat food" (quotation marks) |
Topics that contain the literal phrase "cat food" and all its grammatical variations. Without the quotation marks, the query is equivalent to specifying an OR operator, which finds topics with one of the individual words instead of the phrase. |
| Search for | Operator | Example |
|---|---|---|
|
Two or more words in the same topic |
|
|
| Either word in a topic |
|
|
| Topics that do not contain a specific word or phrase |
|
|
| Topics that contain one string and do not contain another | ^ (caret) |
cat ^ mouse
|
| A combination of search types | ( ) parentheses |
|
Data Flow Probe Setup Window
In this window you can manage the discovery domains, Data Flow Probes, and probe clusters in UCMDB. You can also manage connection data for each connection protocol.
| To access | Select Data Flow Management > Data Flow Probe Setup. |
| See also |
|
Domains and Probes Pane
Enables you to view, define or edit domains, connection credentials, probe clusters, Data Flow Probes, and passive discovery probes. Also enables you to automatically upgrade all the Data Flow Probes with the latest cumulative patch (CUP).
User interface elements are described below (unlabeled elements are shown in angle brackets):
| UI Element (A–Z) | Description |
|---|---|

|
|

|
Remove Domain/Probe/Cluster. Removes the selected domain, Data Flow Probe/probe cluster, or passive discovery probe. Note
|

|
Find Probe Range by IP. If a Probe has many defined ranges, you can locate a specific range on the Probe. To do this, select the Probe and click Find Probe Range by IP. In the Find Probe Range dialog box, enter the IP address (in IPv4 or IPv6 format, as appropriate) and click the Find button. The range is highlighted in the Ranges pane. |

|
Reload Domain Information from Server. Updates all domain and probe information from the server. |
|
|
Note When a Data Flow Probe/probe cluster is suspended, only the ability to run jobs is suspended. All other processes continue to run as usual. The suspend feature is used to just create a job execution policy for a particular probe, and dispatch the policy to that particular probe. Once the job execution policy takes effect, all of the jobs dispatched to the particular probe are switched to the Total blackout state. It does not block the process of job dispatching from UCMDB server to the probe. The effect of the suspend feature equals to creating a job execution policy rule in the Domains and Probes Details pane directly. |

|
Deploy Probe Update. Opens the Deploy Probe Update dialog box, enabling you to automatically update the CUP version of all the Data Flow Probes connecting to the UCMDB Server to the CUP version compatible with the UCMDB CUP version. In the Deploy Probe Update dialog box, navigate to the Probe CUP .zip file. Note During the CUP deployment process, all compatible Data Flow Probes are automatically restarted. If an integration is running on a Data Flow Probe while it is restarting, the integration stops running, and starts over when the Data Flow Probe restarts. If an integration is almost finished running, or a significant part has already run, to avoid starting the integration over, we recommend letting it complete its run, and, thereafter, updating the CUP. |

|
Undeploy Probe Update. Enables you to undeploy CUP versions of the Data Flow Probes connecting to the UCMDB Server, and thereby align them with the CUP version of the UCMDB Server. For details, see How to Align the Data Flow Probe CUP with the UCMDB Server CUP. |
| <Domain and Probes tree> |
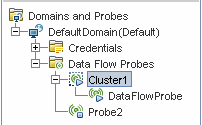
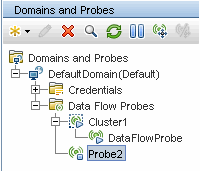
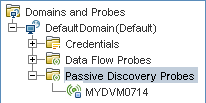
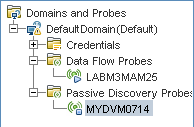
Displays the domains defined in the system, along with the credential per supported protocol and the probe clusters, Data Flow Probes, and passive discovery probes in each domain. Note Integration Probes—that is Probes on Linux machines, and Windows Probes configured for integration only— are not displayed in the tree. To verify if an integration Probe is connected, create a dummy integration point and verify that the Probe is listed among the Probes that can be selected for the integration point. For details, see How to Set Up an Integration Point. |
| <Credential status icons> |
 . Indicates that an active discovery job or activity wants to connect using the protocol, but no protocol credential information is defined. . Indicates that an active discovery job or activity wants to connect using the protocol, but no protocol credential information is defined. |
| <Data Flow Probe status icons> |
|
| <Probe Cluster status icons> |
Note A red exclamation mark on the cluster icon ( |
Details pane
Displays details relevant to the node selected in the Domains and Probes tree.
| Selected Node | Information Pane |
|---|---|
|
Domains and Probes
|
Displays details of all the Data Flow Probes. You can also define and edit job execution policies. For details, see Domains and Probes Details Pane. |
|
A specific domain
|
Displays a list of probe clusters, Data Flow Probes, and passive discovery probes defined and running in the selected domain. You can add a description for the domain in this pane. For details, see <Domain> Details Pane. |
|
A specific protocol
|
Displays the details on the protocol, including user credentials. You can add/edit protocol parameters in this pane. For details, see <Protocol> Details Pane. For a list of supported protocols, see the Universal CMDB Discovery and Integrations Content Help. |
|
A probe cluster
|
Displays details of the selected probe cluster, including range information. You can also add ranges to, or exclude ranges from, the cluster. For details, see Cluster Details Pane. |
|
A Data Flow Probe
|
Displays the details of the Data Flow Probe, including range information. You can also add ranges to, or exclude ranges from, the Data Flow Probe. For details, see Data Flow Probe Details Pane. |
|
Passive Discovery Probes
|
You can view and globally configure notification types and verification policies for all passive discovery probes that integrate with the Data Flow Probes of the same domain. For details, see Passive Discovery Probes Pane. |
|
A specific passive discovery probe
|
Displays the details of a passive discovery probe, including the Data Flow Probe to which it connects, and its IP range information. You can also configure the IP ranges to be monitored by the passive probe, and you can remove a passive probe from the domain. For details, see Passive Discovery Probe Details Pane. |
We welcome your comments!
To open the configured email client on this computer, open an email window.
Otherwise, copy the information below to a web mail client, and send this email to cms-doc@microfocus.com.
Help Topic ID:
Product:
Topic Title:
Feedback:


 /
/ 
 . Indicates the Probe is connected.
 . Indicates the Probe is suspended.
 . Indicates the Probe is disconnected.
 . Indicates the probe cluster is connected.
 . Indicates the probe cluster is suspended.
 ) indicates an warning or error that needs attention.


