Searching the Help
To search for information in the Help, type a word or phrase in the Search box. When you enter a group of words, OR is inferred. You can use Boolean operators to refine your search.
Results returned are case insensitive. However, results ranking takes case into account and assigns higher scores to case matches. Therefore, a search for "cats" followed by a search for "Cats" would return the same number of Help topics, but the order in which the topics are listed would be different.
| Search for | Example | Results |
|---|---|---|
| A single word | cat
|
Topics that contain the word "cat". You will also find its grammatical variations, such as "cats". |
|
A phrase. You can specify that the search results contain a specific phrase. |
"cat food" (quotation marks) |
Topics that contain the literal phrase "cat food" and all its grammatical variations. Without the quotation marks, the query is equivalent to specifying an OR operator, which finds topics with one of the individual words instead of the phrase. |
| Search for | Operator | Example |
|---|---|---|
|
Two or more words in the same topic |
|
|
| Either word in a topic |
|
|
| Topics that do not contain a specific word or phrase |
|
|
| Topics that contain one string and do not contain another | ^ (caret) |
cat ^ mouse
|
| A combination of search types | ( ) parentheses |
|
Performance dashboards
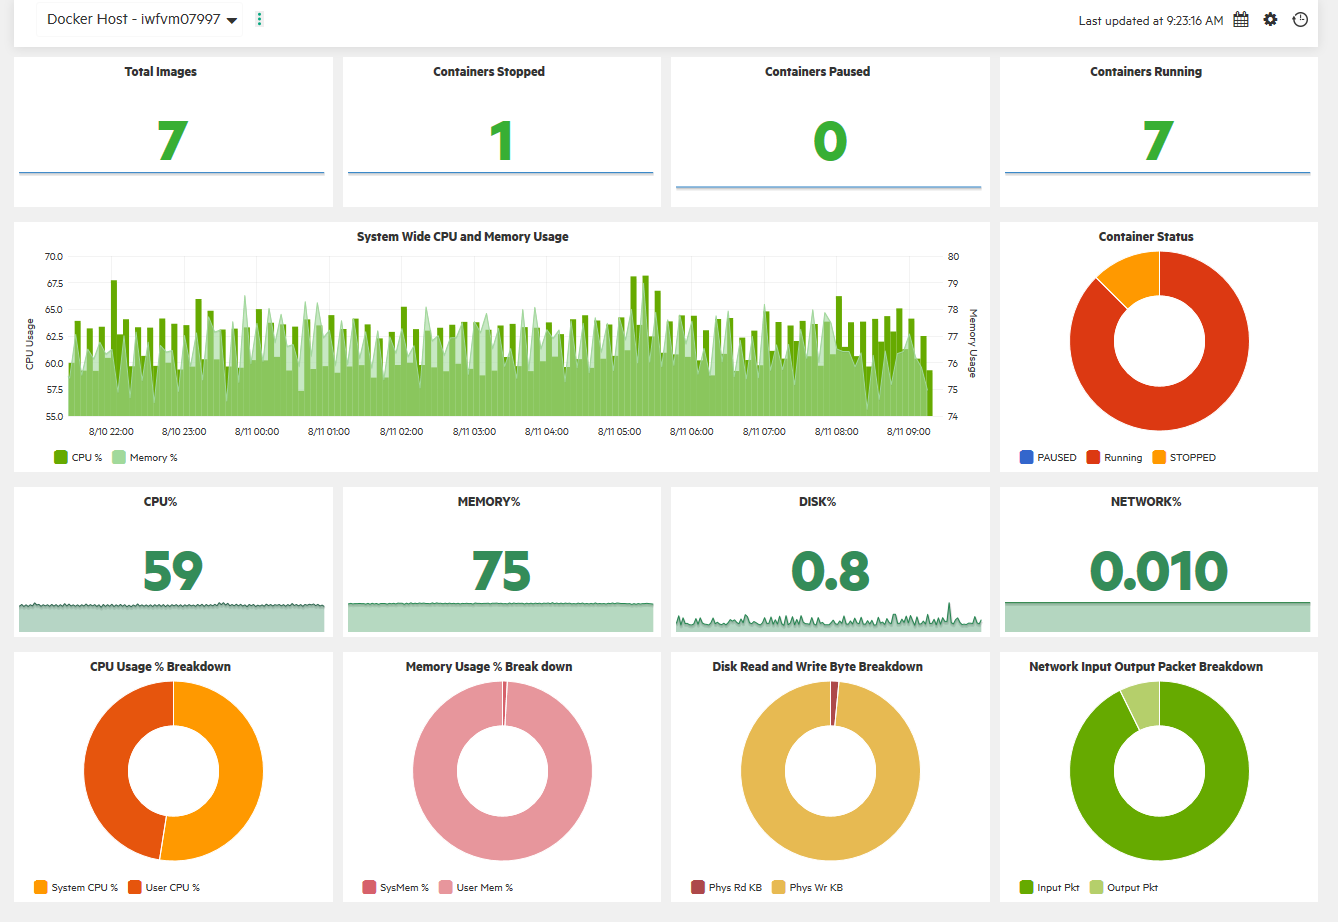
Use performance dashboards to visualize system metrics and custom application metrics. By default, out-of-the-box dashboards are available. In addition, you can create and customize performance dashboards for the CIs that you are monitoring.
Performance dashboards help you perform the following:
- Explore and visualize performance metrics of a host of components such as applications, systems, and network.
- Quickly visualize the performance of important CIs by using personalized favorites.
- Share user-defined favorites as public favorites.
-
Embed charts such as graphs, tables, texts, process tables, and pies into the performance dashboard.
- Embed performance dashboards or single charts into any UI mashup page.
-
Parameterize instances to manage multiple instances across systems.
-
Visualize event information in the performance dashboard through Event Overlay.
-
Visualize time-specific data in the Date Range Panel.
-
Assign performance dashboards to CI Types (CITs).
-
Enjoy real-time visualization of performance metrics.
- Forward critical performance metrics to Business Value Dashboards.
- Compare CIs that belong to similar CITs by using the CI Comparison dashboard.

We welcome your comments!
To open the configured email client on this computer, open an email window.
Otherwise, copy the information below to a web mail client, and send this email to ovdoc-asm@hpe.com.
Help Topic ID:
Product:
Topic Title:
Feedback:


