


Metric Streaming
Metric streaming enables visualization of system, application, and custom metrics in an enterprise environment. The metric streaming configuration policy and data forwarding policy define the metrics (collected by Operations Agent and Connectors) that must be streamed at required intervals. You can then stream the metrics to a central server (target) of your choice, so that critical performance data of all the nodes is available at one place. Use Metric Streaming to monitor critical performance metrics that need to be checked frequently.
For example, you can forward the metrics to a Performance Engine server (target). The Performance Engine then forwards this data to the Performance Dashboard where the data is graphically displayed.
You can configure Metric Streaming using any one of the following processes:
hpsensor- if you want to stream critical metrics in real time.opcgeni- if you want to stream and store metrics when the streaming rate is more than 100 data points/second.
The end-to-end work flow for metric streaming consists of several components that work together. The following table lists the components and the supported versions:
| Components | Supported Versions | |
| For Flow 1 (using hpsensor) | For Flow 2 (for opcgeni) | |
| OMi | 10.11 and later
|
10.61 and later
|
| Operations Agent | 12.01 and later
|
12.03 and later
|
| Performance Engine | 10.11 and later
|
10.61 and later
|
|
Management Pack (Optional)
|
2.10
|
2.10
|
| Connectors (Optional) | All versions | All versions |
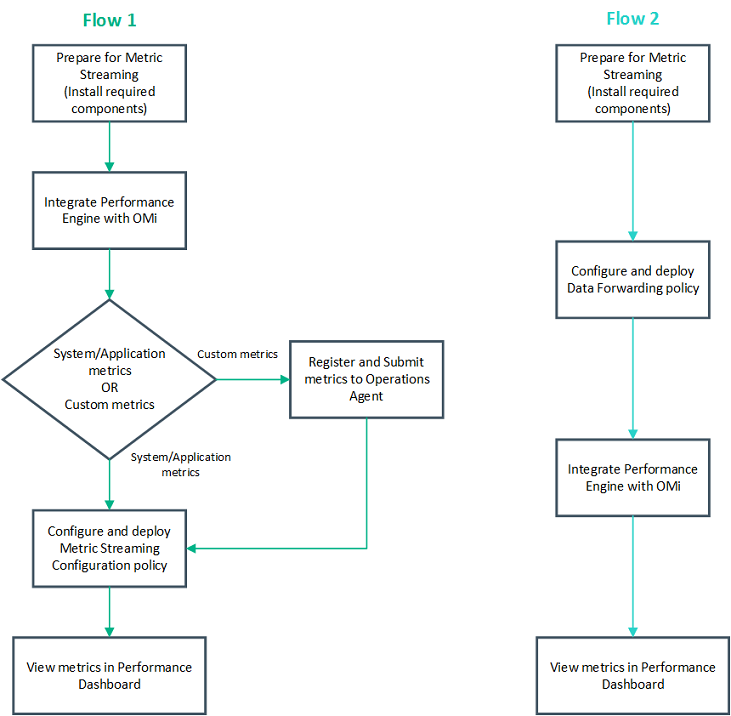
Metric Streaming Configuration Work Flow
The following flowcharts describe the metric streaming configuration work flows using hpsensor and opcgeni. Follow Flow 1 and Flow 2 for streaming using hpsensor and opcgeni respectively.
Note In the following flowcharts, it is assumed that metrics are already being collected by using Operations Agent or Connectors.
Important If you are using Flow 2, we recommend that you disable data logging into the local store of Operations Agent, to improve performance. To disable local data logging, set the OPCGENI_
DISABLE_
LOCAL_STORE configuration variable in the Operations Agent as TRUE. For more information about configuration variables of Operations Agent, see Configuration variables of Monitoring Component.
See Metric Streaming Configuration Task Flow - Flow 1and Metric Streaming Configuration Task Flow - Flow 2for more information about the configuration tasks.
The following table describes the configuration tasks for metric streaming using hpsensor.
| Task | Description |
|---|---|
| Task 1: Integrate Performance Engine with OMi |
Perform this task to integrate Performance Engine with OMi. Note By default, the built-in cache of Performance Engine stores data for one hour. If you want to store and visualize data for longer durations, you must configure Vertica with Performance Engine. |
| Task 2: Register and submit metrics to Operations Agent. | Optional. Perform this step if you want to stream custom metrics. This step is not required for streaming system metrics and the application metrics provided by Management Packs. |
| Task 3: Configure Metric Streaming Configuration policy | Metric Streaming Configuration policy defines the metrics that must be collected by Operations Agent or Operations Connector, and the endpoint to which the metrics must be forwarded. |
| Task 4: Deploy Metric Streaming Configuration Policy | Deploy Metric Streaming Configuration Policy to the managed nodes. |
| Task 5: View metrics in Performance Dashboard |
View the streamed metrics in Performance Dashboard.
|
You have successfully configured metric streaming for streaming real-time data using hpsensor. For more information about metric streaming using opcgeni, see Metric Streaming Configuration Task Flow - Flow 2.
The following table describes the configuration tasks for metric streaming using opcgeni.
| Task | Description |
|---|---|
| Task 1: Configure Data Forwarding policy | Configure the data forwarding policy to specify the metrics that you want to stream, and the endpoint to which the metrics must be forwarded. |
| Task 2: Integrate Performance Engine with OMi |
Performance Engine is considered as the target in this task flow. Perform this task to integrate Performance Engine with OMi. Note Performance Engine must be configured with Vertica. |
| Task 3: View metrics in Performance Dashboard |
View the streamed metrics in Performance Dashboard.
|
You have successfully configured metric streaming using opcgeni.