Administer > Policies > Database Policies > Database Policy User Interface > Configuring Mappings in Database Policies

Configuring Mappings in Database Policies (Events and Metrics Only)

The Mappings page enables you to map columns of database tables to custom variables.

To access

  • In the Operations Connector user interface, click Create in the toolbar. Then click Event > DDatabase Database.

  • In the Operations Connector user interface, click Create in the toolbar. Then click Metric > DDatabase Database.

Alternatively, double-click an existing policy to edit it.

Click Mappings to open the policy Mappings page.

Mappings overview

A custom variable consists of a map name, an optional database table column, and one or more source and target value pairs. For example, you can assign the table column SEVERITY to the map name mapSeverity, and add a source value of Serious. You can then assign the target value critical to the variable so that Operations Connector inserts the value critical into the event in all places where the variable is used and the source value is Serious in the database record.

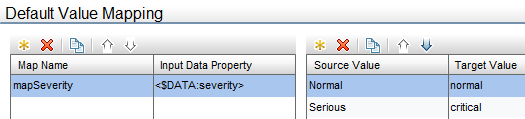
Table columns use the following syntax: <$DATA:<table_column>>

where <table_column> is the name of the table column in the third-party database, for example <$DATA:severity>.

For example, the custom variable mapSEVERITY has the table column SEVERITY assigned.

Assigning a table column to a map name is optional. If you do not assign a table column to a variable, you must add the source value directly to the variable when you insert the variable in an event attribute.

You can rearrange the information that appears in the lists by clicking the up or down arrows at the top of the list.

The Sample Data tab is empty if no sample data has been loaded into the policy or if the database query fails.

The Table Column tab shows the following information, if sample data is available:

  • Input Data Properties

    If sample data is available, then the Input Data Properties section shows the table columns specified in the query.

  • Values for <table column>

    The Values for <table column> section displays the values of a column selected in the Input Data Properties section. If a value appears more than once, click Toggle Deduplication of XML Values to show or hide duplicate values. To find values that belong to more than one row, select the value and click Find Matching XML Events in Sample Data. The Database Sample Data window opens and shows all rows that have the selected value.

When you drag a column from the table columns list and drop it on the Default Value Mapping list, Operations Connector automatically adds the default prefix map to the map name and inserts the table column. You can then drag one or more column source values from the values list and drop them on the Source Value list. You then finally only have to type the target values.

Tasks

How to configure mappings for table columns

This task describes how to map table columns to custom variables.

  1. Create one or more custom variables.

    If you are working with sample data, drag the table column from the table column list to the Map Name column. Operations Connector automatically adds the default prefix map to the map name and inserts the column name.

    Alternatively, click above the Map Name column and type the variable name in the map name field. Columns are optional. If you do not assign a column to a variable, you must add the source value directly to the variable when you insert the variable in an event attribute.

  2. Add source and target value pairs to each custom variable.

    • If sample data is loaded in Operations Connector, drag a value from the Values for '...' list to the Source Value column, and then type the target value in the corresponding field.

      Alternatively, c Click above the Source Value column and type the source and target values in the corresponding fields.

    • Optional. In the Indicators tab, add indicators to the source or target value fields. After loading the indicators from the OMi server, the Indicators tab shows a hierarchy of configuration item types.

      To insert an indicator in a source or target value field, drag the indicator state (for example, HTTPServer:Normal) from the Indicators tab and drop it on the corresponding field.

    • Optional. In the Policy Variables tab, add policy variables to event or metric attributes. Operations Connector replaces the variables with the appropriate values in the generated event or metric.

      Use quotation marks to surround variables, for example "<$MSG_NODE>" or "<$MSG_GEN_NODE>", at least for those variables whose values can contain space characters.

Related tasks

UI Descriptions

Default Value Mappings

UI Element Description
Create new mapping definition. Adds a new mapping definition to the list of mappings.
Delete mapping definition. Deletes the selected mapping definition.
Copy Mapping Definition. Creates a copy of the selected mapping definition.
Move Up. Moves the selected mapping definition up to a higher position.
Move Down. Moves the selected mapping definition down to a lower position.
Map Name Name of the custom variable. Operations Connector automatically adds the default prefix map to the map name if the variable has been created from sample data.
Input Data Property

Table column assigned to the custom variable.

Operations Connector replaces the table column at runtime with the value of the specified column. If you insert a value, the value will be used.

Data key assigned to the custom variable.

Perl attribute key names use the following syntax:

<$DATA:<AttributeName>>

where <AttributeName> is the data key name in a Perl hash array.

Operations Connector replaces the attribute name at runtime with the value of the specified key.

Create new mapping. Adds a new pair of source and target values to the mapping definition.
Delete mapping. Deletes the selected source and target value pair.
Copy Value Mapping. Creates a copy of the selected value mapping.
Move Up. Moves the selected value mapping up to a higher position.
Move Down. Moves the selected value mapping down to a lower position.
Source Value

Original value of the table column.

Original value of the input data reference.

Target Value

New value of the table column.

New value of the input data reference.

Sample Data Tab

UI Element Description
<Search Properties>

Entered search string is used to find a table column. The list changes as you type; only matching items appear.

To clear the search results, click .

Find Matching Records. To find values that belong to more than one table row, select the value and click Find Matching XML Events in Sample Data. The Database Sample Data window opens and shows all rows that have the selected value.
Toggle Deduplication. Shows or hides duplicate values.
Input Data Properties

Shows all columns that are returned by the database query.

The Sample Data tab is empty if no sample data has been loaded into the policy or if the database query did not succeed. See also Configuring the Data Source in Databases Policies topic.

Values for <...>

Displays the values of the column selected in the Input Data Properties section.

Indicators Tab

UI Element

Description

Refresh. Loads the configured indicators from the connected OMi server.

  • Loading indicators from the OMi server may take a few seconds.

  • The Operations Connector server must be configured as an Operations Connector integration server in OMi for the indicators to load successfully.

<Search …>

Entered search string is used to search the indicators and highlight only the indicators containing the specified string.

To search for indicators with specific text strings in the name, type the string in the <Search …> field and click the button. The first matching indicator is selected in the list of rules. Click the and buttons to move to the previous and next matching indicator.

<Indicators>

Hierarchy of configuration item types with associated health indicators (HIs), which are applicable for the event integration only, and event type indicators (ETIs). To insert an indicator with a state in a policy, drag and drop the indicator from the Indicators tab to the relevant field in the policy.

Policy Variables Tab

Policy Variables Tab for Database and REST Web Service Listener Policies (Events only)

Variable Description
<$MSG_APPL> Returns the name of the application associated with the input event that caused the message. Sample output: /usr/bin/su(1) Switch User
<$MSG_GEN_NODE>

Returns the IP address of the node that sends the event. Sample output: 192.168.1.123.

<$MSG_GEN_NODE_NAME> Returns the host name of the node that sends the event. Sample output: node123.example.com.
<$MSG_GRP> Returns the default category of the event. Sample output: Security
<$MSG_ID> Returns the unique identity number of the event, as generated by the Operations Agent. Note that identity numbers are not generated for suppressed messages. Sample output: 6e998f80-a06b-71d0-012e-0f887a7c0000
<$MSG_NODE> Returns the IP address of the node on which the original event took place. Sample output: 192.168.1.123
<$MSG_NODE_NAME> Returns the name of the node on which the original event took place. This is the hostname that the agent resolves for the node. This variable is not fixed, however, and can be changed by a policy on a per-event basis.
<$MSG_SERVICE> Returns the service name associated with the event.
<$MSG_OBJECT> Delivers the name of the object associated with the event.
<$MSG_SEV> Returns the default value for the severity of the event. The following severity conversions are performed when this variable is set by the Windows Event Log: information=Normal, warning=Warning, error=critical, success audit=Normal, failure audit=Critical, default=unknown).Sample output: Normal
<$MSG_TEXT> Returns the full text of the event. For open message interface policies, this value is the msg_text parameter submitted by the opcmsg command. For the Windows Event Log this value is the event ID and description. Sample output: SU 03/19 16:13 + ttyp7 bill-root
<$MSG_TIME_CREATED> Returns the time the message was created on the managed node in seconds elapsed since midnight (00:00:00), January 1, 1970, coordinated universal time. Sample output: 950008585
<$MSG_TYPE> Delivers the name set for message type.

Policy Variables Tab for XML File and Structured Log File Policies (Events only)

Variable Description
<$LOGFILE> Returns the name of the log file that contains the input event. Sample output: program_log.txt
<$LOGPATH> Returns the name and path of the log file that contains the input event. Sample output: C:\temp\mylogfile\program_log.txt
<$MSG_APPL> Returns the name of the application associated with the input event that caused the message. Sample output: /usr/bin/su(1) Switch User
<$MSG_GEN_NODE>

Returns the IP address of the node that sends the event. Sample output: 192.168.1.123.

<$MSG_GEN_NODE_NAME> Returns the host name of the node that sends the event. Sample output: node123.example.com.
<$MSG_GRP> Returns the default category of the event. Sample output: Security
<$MSG_ID> Returns the unique identity number of the event, as generated by the agent. Note that identity numbers are not generated for suppressed messages. Sample output: 6e998f80-a06b-71d0-012e-0f887a7c0000
<$MSG_NODE> Returns the IP address of the node on which the original event took place. Sample output: 192.168.1.123
<$MSG_NODE_NAME> Returns the name of the node on which the original event took place. This is the hostname that the agent resolves for the node. This variable is not fixed, however, and can be changed by a policy on a per-event basis.
<$MSG_SERVICE> Returns the service name associated with the event.
<$MSG_OBJECT> Delivers the name of the object associated with the event.
<$MSG_SEV> Returns the default value for the severity of the event. The following severity conversions are performed when this variable is set by the Windows Event Log: information=Normal, warning=Warning, error=critical, success audit=Normal, failure audit=Critical, default=unknown).Sample output: Normal
<$MSG_TEXT> Returns the full text of the event. For open message interface policies, this value is the msg_text parameter submitted by the opcmsg command. For the Windows Event Log this value is the event ID and description. Sample output: SU 03/19 16:13 + ttyp7 bill-root
<$MSG_TIME_CREATED> Returns the time the message was created on the managed node in seconds elapsed since midnight (00:00:00), January 1, 1970, coordinated universal time. Sample output: 950008585
<$MSG_TYPE> Delivers the name set for message type.

Policy Variables Tab for Open Message Interface, Scheduled Task, and SNMP Interceptor Policies (Events only)

Variable Description
<$MSG_APPL> Returns the name of the application associated with the input event that caused the message. Sample output: /usr/bin/su(1) Switch User
<$MSG_GEN_NODE>

Returns the IP address of the node that sends the event. Sample output: 192.168.1.123.

<$MSG_GEN_NODE_NAME> Returns the host name of the node that sends the event. Sample output: node123.example.com.
<$MSG_GRP> Returns the default category of the event. Sample output: Security
<$MSG_ID> Returns the unique identity number of the event, as generated by the Operations Agent. Note that identity numbers are not generated for suppressed messages. Sample output: 6e998f80-a06b-71d0-012e-0f887a7c0000
<$MSG_NODE> Returns the IP address of the node on which the original event took place. Sample output: 192.168.1.123
<$MSG_NODE_NAME> Returns the name of the node on which the original event took place. This is the hostname that the agent resolves for the node. This variable is not fixed, however, and can be changed by a policy on a per-event basis.
<$MSG_SERVICE> Returns the service name associated with the event.
<$MSG_OBJECT> (Open Message Interface and Scheduled Task Only) Delivers the name of the object associated with the event.
<$MSG_SEV> Returns the default value for the severity of the event. The following severity conversions are performed when this variable is set by the Windows Event Log: information=Normal, warning=Warning, error=critical, success audit=Normal, failure audit=Critical, default=unknown).Sample output: Normal
<$MSG_TEXT> Returns the full text of the event. For open message interface policies, this value is the msg_text parameter submitted by the opcmsg command. For the Windows Event Log this value is the event ID and description. Sample output: SU 03/19 16:13 + ttyp7 bill-root
<$MSG_TIME_CREATED> Returns the time the message was created on the managed node in seconds elapsed since midnight (00:00:00), January 1, 1970, coordinated universal time. Sample output: 950008585
<$MSG_TYPE> Delivers the name set for message type.
<$NAME> (Scheduled Task Only) Returns the name of the policy that sent the event. Sample output: cpu_util
<$OPTION(N)> (Open Message Interface Only) Returns the value of an optional variable that is set by opcmsg or opcmon (for example, <$OPTION(A)>, < $OPTION(B)>, and so on.).
<$PROG> (Scheduled Task Only) Returns the name of the program executed by the scheduled task policy Sample output: check_for_upgrade.bat
<$USER> (Scheduled Task Only) Returns the name of the user under which the scheduled task was executed. Sample output: administrator

Policy Variables Tab for All Policy Types (Metrics only)

Variable Description
<$MSG_GEN_NODE>

Returns the IP address of the node that sends the event. Sample output: 192.168.1.123.

<$MSG_GEN_NODE_NAME> Returns the host name of the node that sends the event. Sample output: node123.example.com.