


Add colored ranges to a report
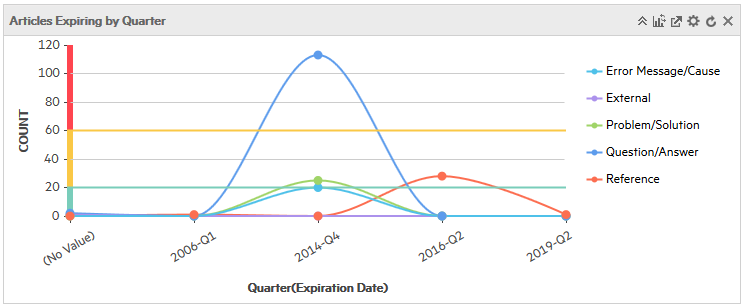
You can add colored ranges to charts in reports to highlight thresholds and ranges. When you define colored ranges for a graphical chart, the section of the relevant axis falling within each range is displayed in the defined color, and threshold markers are displayed on the report to mark the limits of the ranges. When you define colored ranges for a number chart, the color of the number changes according to the range in which it falls.
You can configure colored ranges on the following types of report:
- Chart- Vertical bar
- Chart- Stacked vertical bar
- Chart- Horizontal bar
- Chart- Stacked horizontal bar
- Chart- Line
- Chart- Area
- Chart- Number
To configure colored ranges for a chart, follow these steps:
- Navigate to the Advanced settings tab of the report to which you want to add colored ranges. To do this, view the report on a dashboard, click the Settings (
 ) icon on the top-right of the report, and then click the Advanced settings tab. Or, click Reporting > Search Report, search for the desired report, and then click the Advanced settings tab.
 -
In the From column of the Colored Ranges table, enter the lower threshold value of each color range.
- In the To column, enter the upper threshold value of each color range.
-
In the Color column, select the color for each range. You can use the same color for multiple ranges. Available colors are defined in the Color Indicator Settings table.
- Click Save. To preview the colored ranges, click the Preview tab.
Note
- The From value of the first range and the To value of the last range can be left blank, to indicate infinite values.
- Ranges must be defined in ascending order.
- Ranges must be contiguous. That is, the From value of each range must equal the To value of the preceding range.