Searching the Help
To search for information in the Help, type a word or phrase in the Search box. When you enter a group of words, OR is inferred. You can use Boolean operators to refine your search.
Results returned are case insensitive. However, results ranking takes case into account and assigns higher scores to case matches. Therefore, a search for "cats" followed by a search for "Cats" would return the same number of Help topics, but the order in which the topics are listed would be different.
| Search for | Example | Results |
|---|---|---|
| A single word | cat
|
Topics that contain the word "cat". You will also find its grammatical variations, such as "cats". |
|
A phrase. You can specify that the search results contain a specific phrase. |
"cat food" (quotation marks) |
Topics that contain the literal phrase "cat food" and all its grammatical variations. Without the quotation marks, the query is equivalent to specifying an OR operator, which finds topics with one of the individual words instead of the phrase. |
| Search for | Operator | Example |
|---|---|---|
|
Two or more words in the same topic |
|
|
| Either word in a topic |
|
|
| Topics that do not contain a specific word or phrase |
|
|
| Topics that contain one string and do not contain another | ^ (caret) |
cat ^ mouse
|
| A combination of search types | ( ) parentheses |
|
Discovery Results Tab/Pane
This tab/pane displays the discovery results from discovery job runs or from discovery activities that ran in Management Zones.
| To access |
Select Data Flow Management > Universal Discovery:
|
| Important Information |
UCMDB includes a purging mechanism for managing old discovery result statistics. This mechanism enables faster display of discovery result statuses. That is, the old result records are merged and are therefore still available for the user. This feature is controlled by two system parameters:
|
| Relevant tasks | |
| See also |
User interface elements are described below (unlabeled elements are shown in angle brackets):
| UI Element (A–Z) | Description |
|---|---|

|
Refresh. Retrieves the latest discovery results from the server (job results are not automatically updated in the Results pane). |

|
View Instances. Displays all new and updated CIs. Select a CIT and click:
Note When you double-click a row, created CI instances are displayed. Available: When the discovery results include created or updated instances. |

|
Select the time range or Probe for which to display discovery results and statistics.
|

|
Show all declared CI Types. By default, only discovered CITs are listed in the table; the Discovered CIs column includes CITs if the number of CIs found is greater than zero. Click the button to display every CI that can be discovered by the job, even if the Discovered CIs value is zero:
|
| <Results grid> |
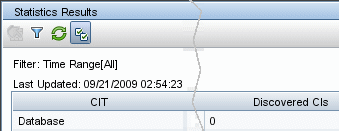
Displays the discovery results and statistics.
|
| Filter | The time range set with the Set Time Range button. |
| Last updated | The date and time that the Results grid was last updated. |
We welcome your comments!
To open the configured email client on this computer, open an email window.
Otherwise, copy the information below to a web mail client, and send this email to cms-doc@microfocus.com.
Help Topic ID:
Product:
Topic Title:
Feedback:


