


Report guidelines
You can create operational or analytic reports, which are based on groupings and functions, or an operational raw data report, which is a more basic report on a record type without groupings or functions. In either case, follow the procedure described in How to work with reports.
Note You cannot select a grouping without a function or a function without a grouping.
The following are guidelines for selecting the report properties.
Create an operational or analytic report
For these types of reports, you must select at least one grouping option and one function.
-
In the General tab of the Report properties pane, locate the Group by field and click Add group. Select a field from the drop-down list. These are the fields of the report record type.
-
If the field you select is a record type in its own right, you can click the +Related link next to it and select a field of that record type from the drop-down list. The value in this field will appear in the report.
If you do not click the +Related link, the record type appears under the Columns drop-down. Click in the box and select a field of that record type from the drop-down list. The value in this field will appear as an additional column in the grid view of the report.
-
Optionally, click Add group again to add a second grouping. You can add additional groupings that are displayed in the grid view of the report. The chart view is relevant for up to two groupings.
-
In the Function field, click Add function and select a function from the drop-down list. The selected function is applied to the grouping(s) you selected. The following functions are available:
Function Description Average Calculates an average of the values in each group or subgroup. Count Calculates the number of values in each group or subgroup. Percent Calculates each group or subgroup's percent of the total. Percent is calculated by count or by sum of a field. Select Count or Sum from the drop-down list. Percent per group Calculates each subgroup's percent of its group. Percent per group is calculated by count or by sum of a field. Select Count or Sum from the drop-down list.
Note This option is only relevant when exactly two Group by options have been selected.
Sum Calculates the sum of the values in each group or subgroup. For Average, Sum, Percent by Sum, and Percent per group by Sum, you must click the +Field link next to the function and select a numeric field from the drop-down list.
Note For survey reports, only the Average and Count functions are available.
You can click Add function again to add additional functions which are displayed in the grid view of the report. For the chart view, only one function is displayed. If you added multiple functions in the General tab, you must select one of those functions in the Chart function field in the Chart tab.
-
When you preview or save the report, the data is displayed as follows:
- In Grid view, the rows of the table represent the different combinations of options of the selected groupings. Each function is displayed as a column of the table.
-
In Chart view:
- If one grouping option was selected, the value of the selected function applied to each group appears as a bar, column, or pie slice.
-
If two grouping options were selected, the bars or columns for each group reflect the function applied to each of the subgroups in that group (the pie chart option is not available).
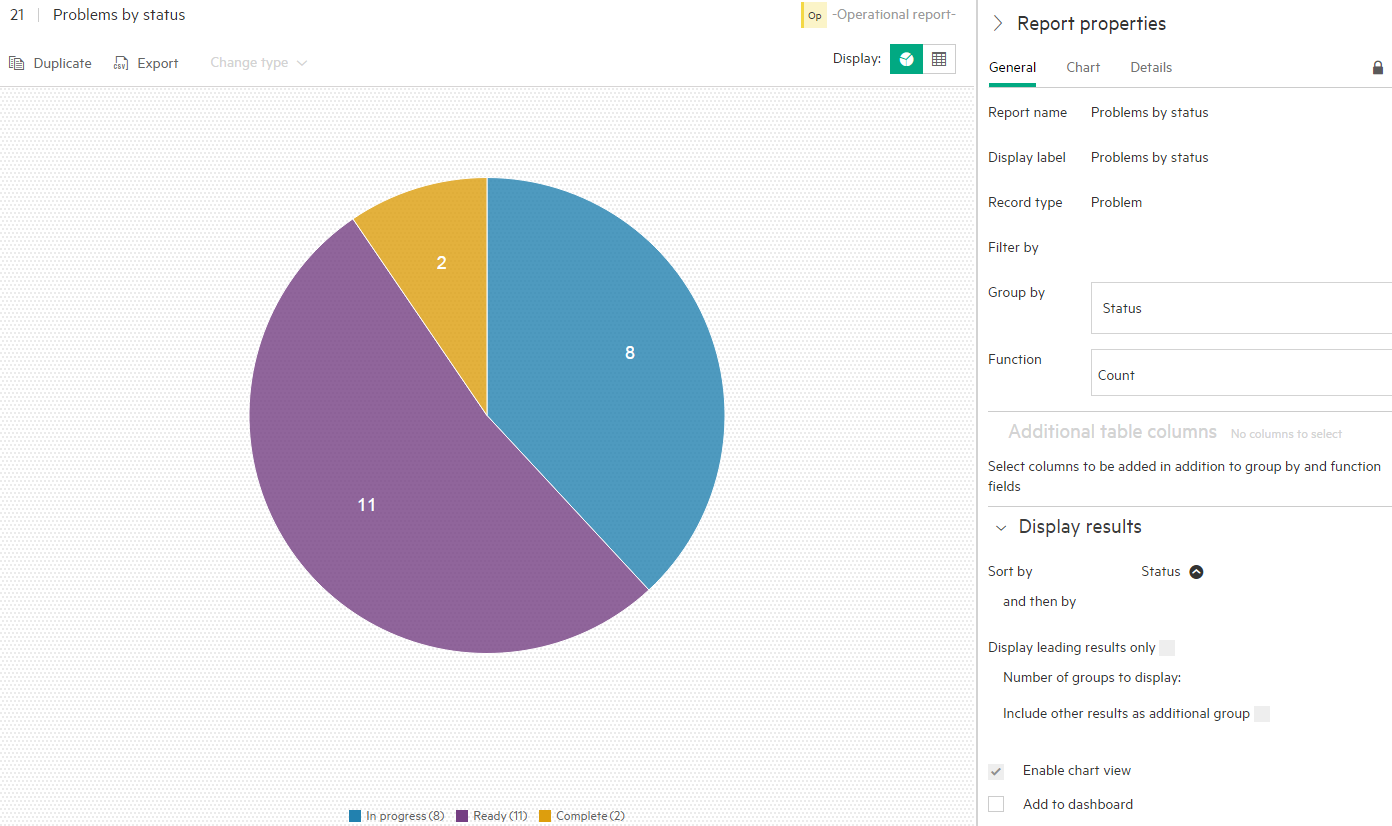
Example of a report with one grouping option
The out-of-the-box report Problems by status displays a pie chart with each slice representing the number of problem records with a different status. The grouping field is Status and the function is Count. You can click a pie slice to drill down to Problem Management and view the problem records in the selected group.
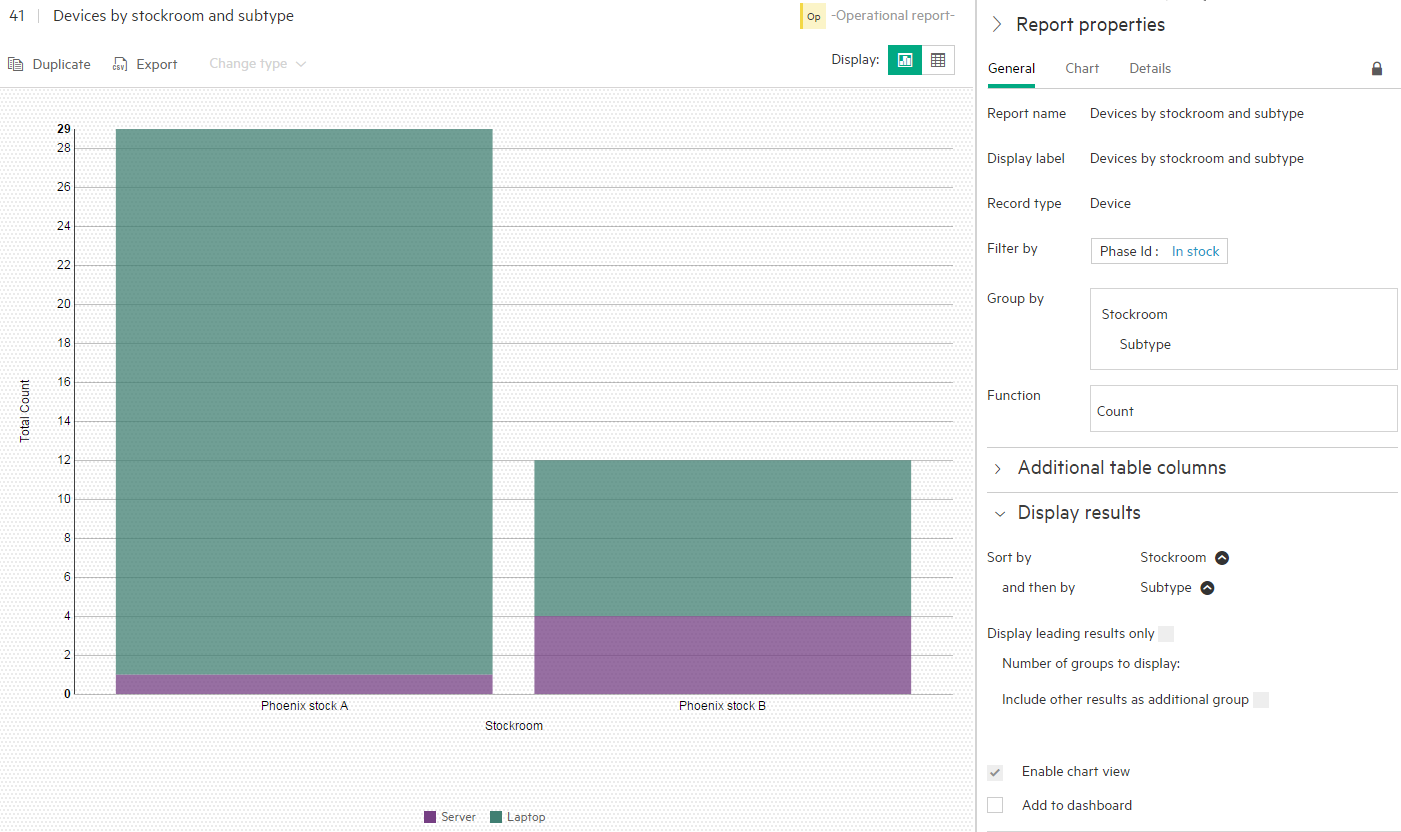
Example of a report with two grouping options
The out-of-the-box report Devices by stockroom and subtype displays a stacked column chart with each column representing the number of devices from a different stockroom. The subsections of the columns represent devices of different subtypes (laptops or servers). The first grouping field is Stockroom, the second grouping field is Subtype, and the function is Count. You can click a column subsection to drill down to Service Asset & Configuration > Devices and view the devices in the selected group.
Create an operational raw data report
An operational raw data report has no grouping options or functions. It displays only the raw data from the selected record type.
You have the option to select the columns that appear in the report in the Columns section of the Report properties pane. At least one column must be selected. If you do not select columns, the default column selection is used.
The report displays data from the record type grid page. There is no chart option for this report type. You can limit the size of the report using the Row limit option in the Details tab of the Report properties pane. The report displays all the data or the number of rows selected if the data exceeds the limit.
Related topics


