


Optimization use case
This use case is based on the images shown below.
Carl Hulman is a project portfolio manager. He manages investments for enhancing the F-Generation application in his company. He creates a project portfolio 16747: F-Generation for that purpose, and sets himself as the owner.

Carl’s portfolio contains four proposals (new business initiatives that bring new business value), one program and two projects. Project 16843: SAP Integration is currently in planning phrase, while Project 16852: Maps everywherehas already begun and is in execution phrase.

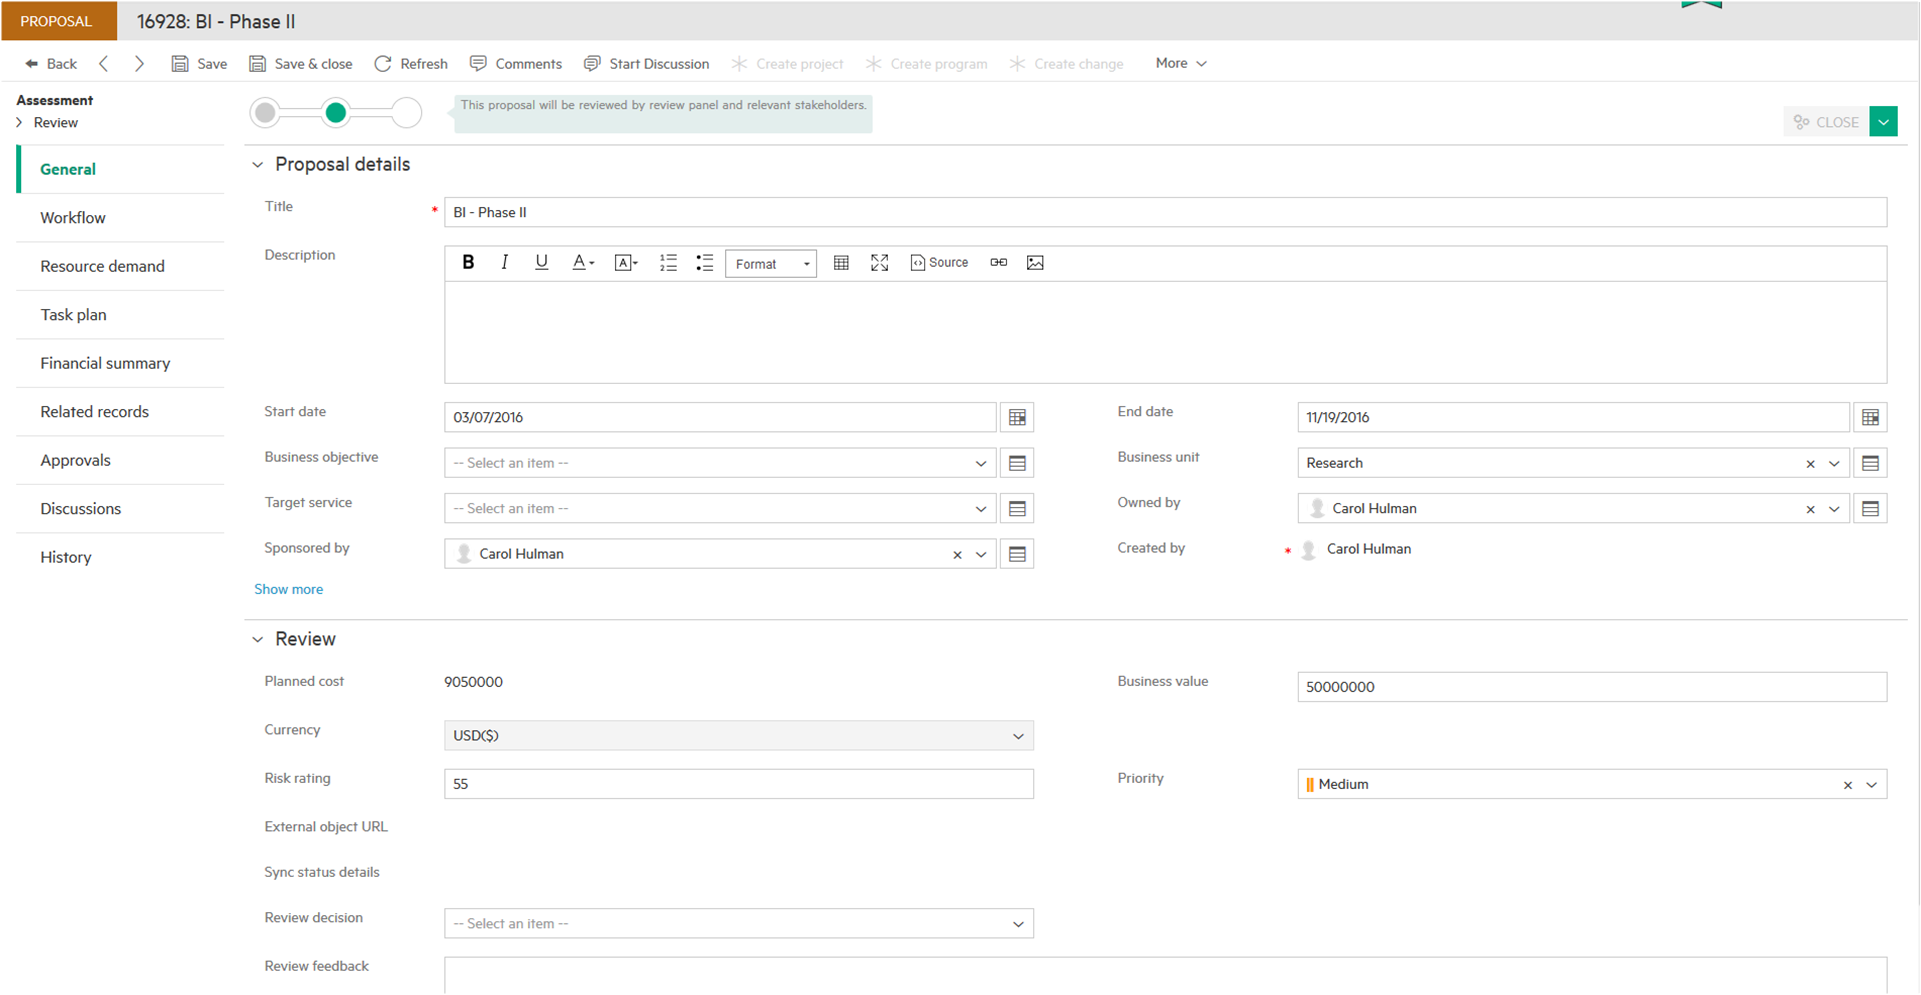
The planned cost or resource demand and the business value are also recorded in the proposal. Take proposal 16928: BI - Phase II as an example:
The planned cost is $9,050,000 and the business value is $50,000,000. This is shown on the proposal detail page.
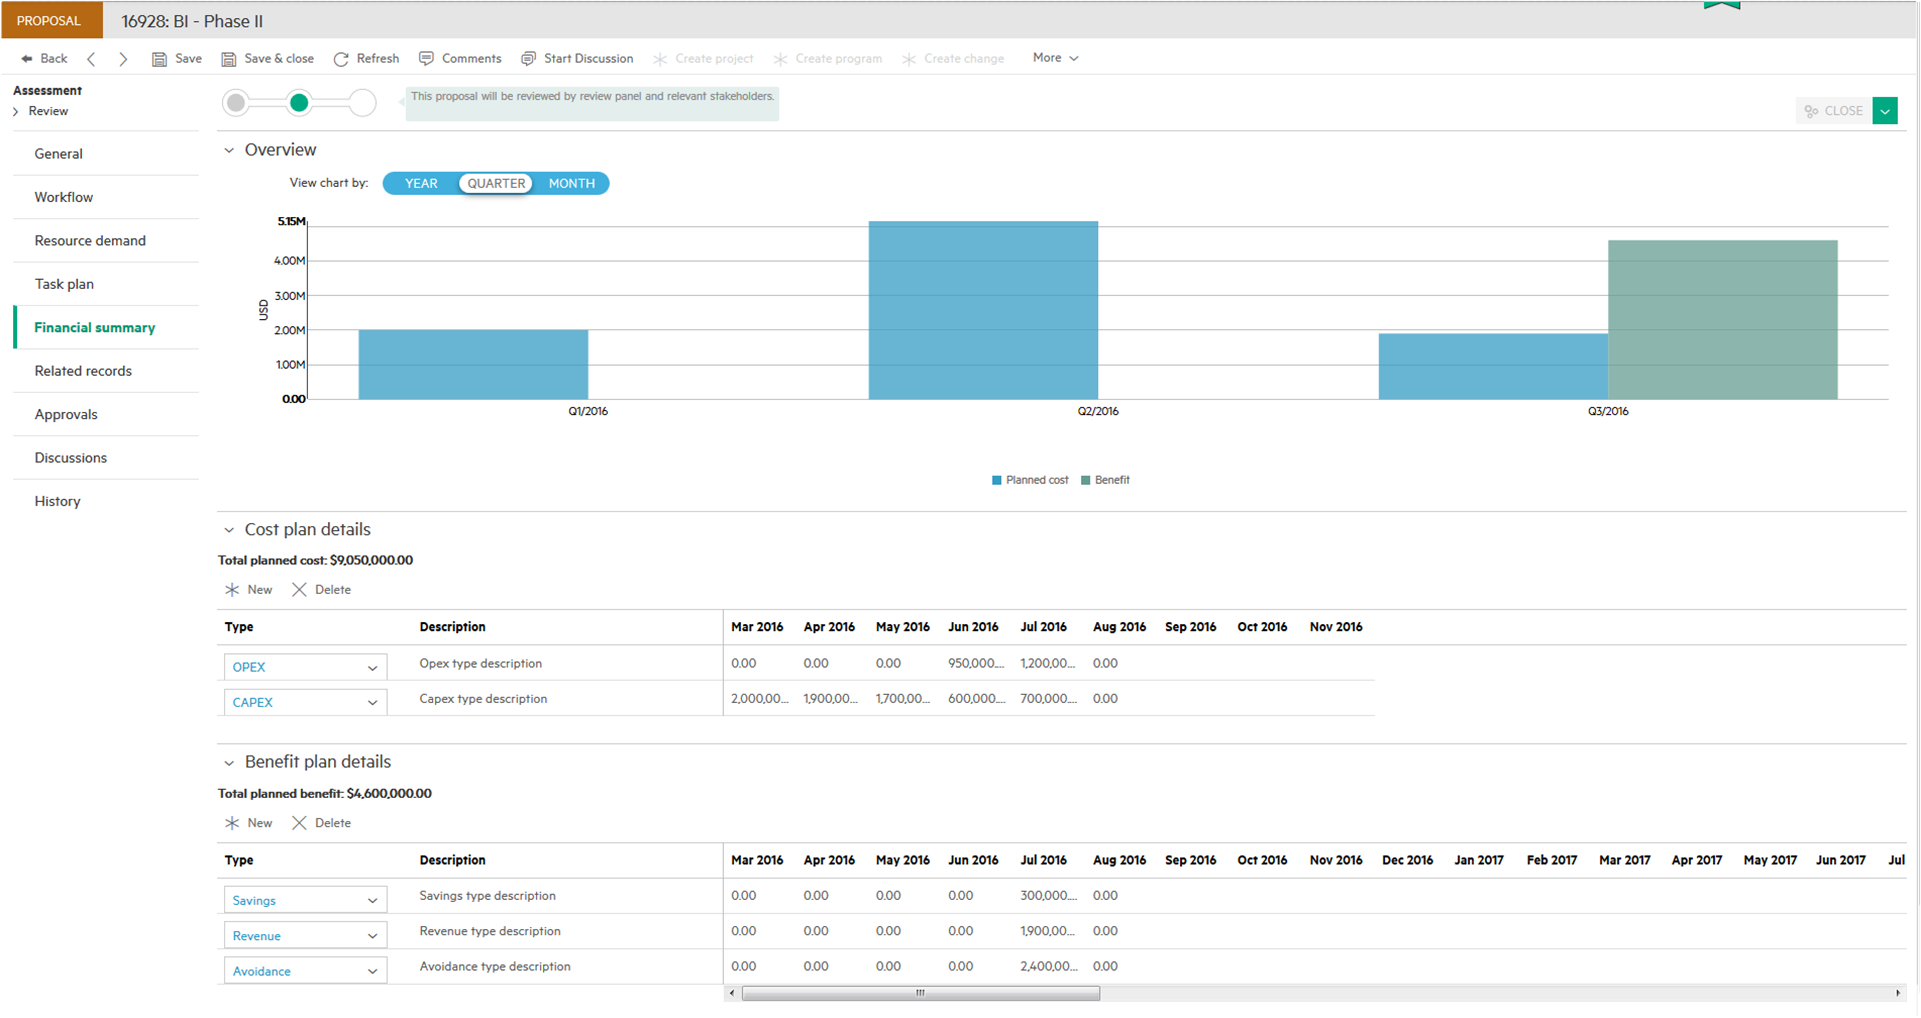
Carl can also see details in the Financial summary tab, such as planned cost per month.
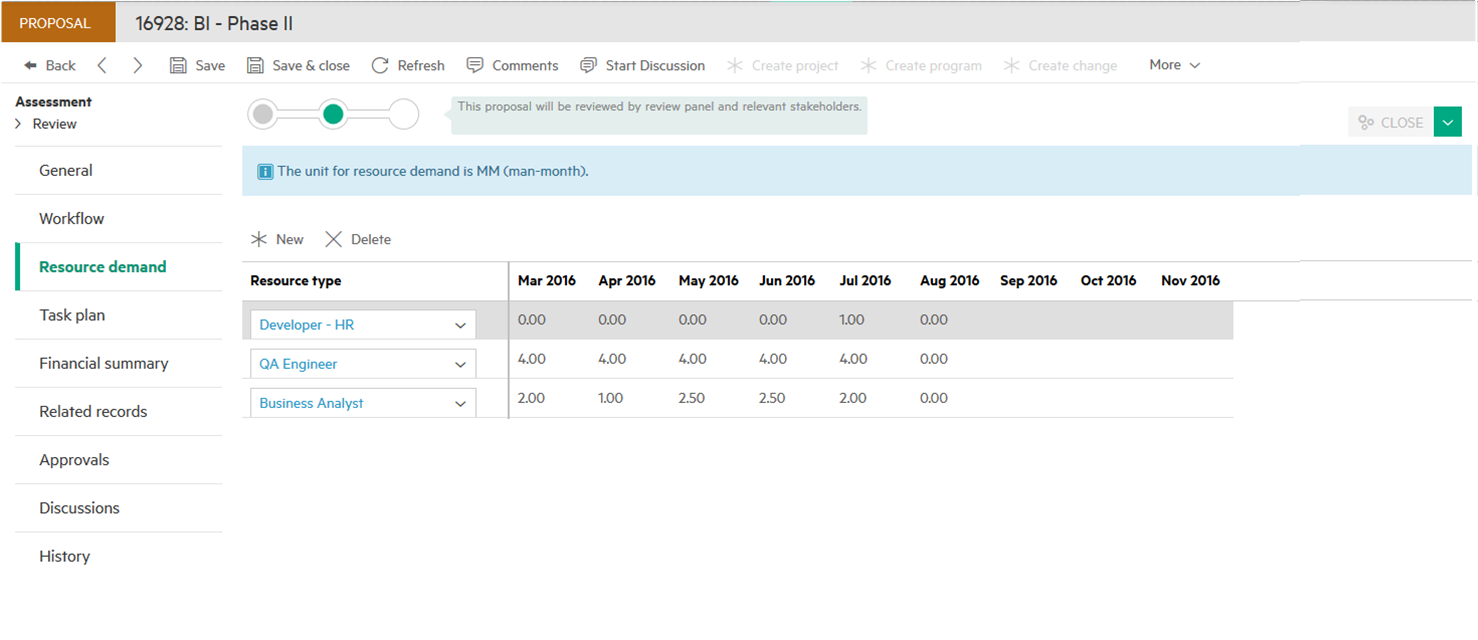
The proposal's resource demand is displayed on the Resource demand tab, showing the kinds of resources that are required to complete the proposal.
Carl has two budgets for his portfolio. One is for strategic investment, with a value of $30,000,000 that covers January 2016 through June 2016. The other budget is for rolling investment, with a value of $18,200,000, covering March 2016 through June 2016. This budget information is allocated in the Financial Management module, but is displayed in the Financial summary tab of the portfolio.

Each of the seven items in the portfolio have a specific value, resource demand, cost, and proposed schedule, and Carl doesn't have enough budget to cover all of them. He wants to choose the proposals that will bring the greatest business value to the company, while keeping within the defined budget. Carl is also curious about how he can schedule these items so that his resources and budget are best used.
Carl begins the optimization process by clicking the New button in the Scenarios tab. Note that only proposals that have a defined resource demand or planned cost and are in Review phase will be included in the optimization.
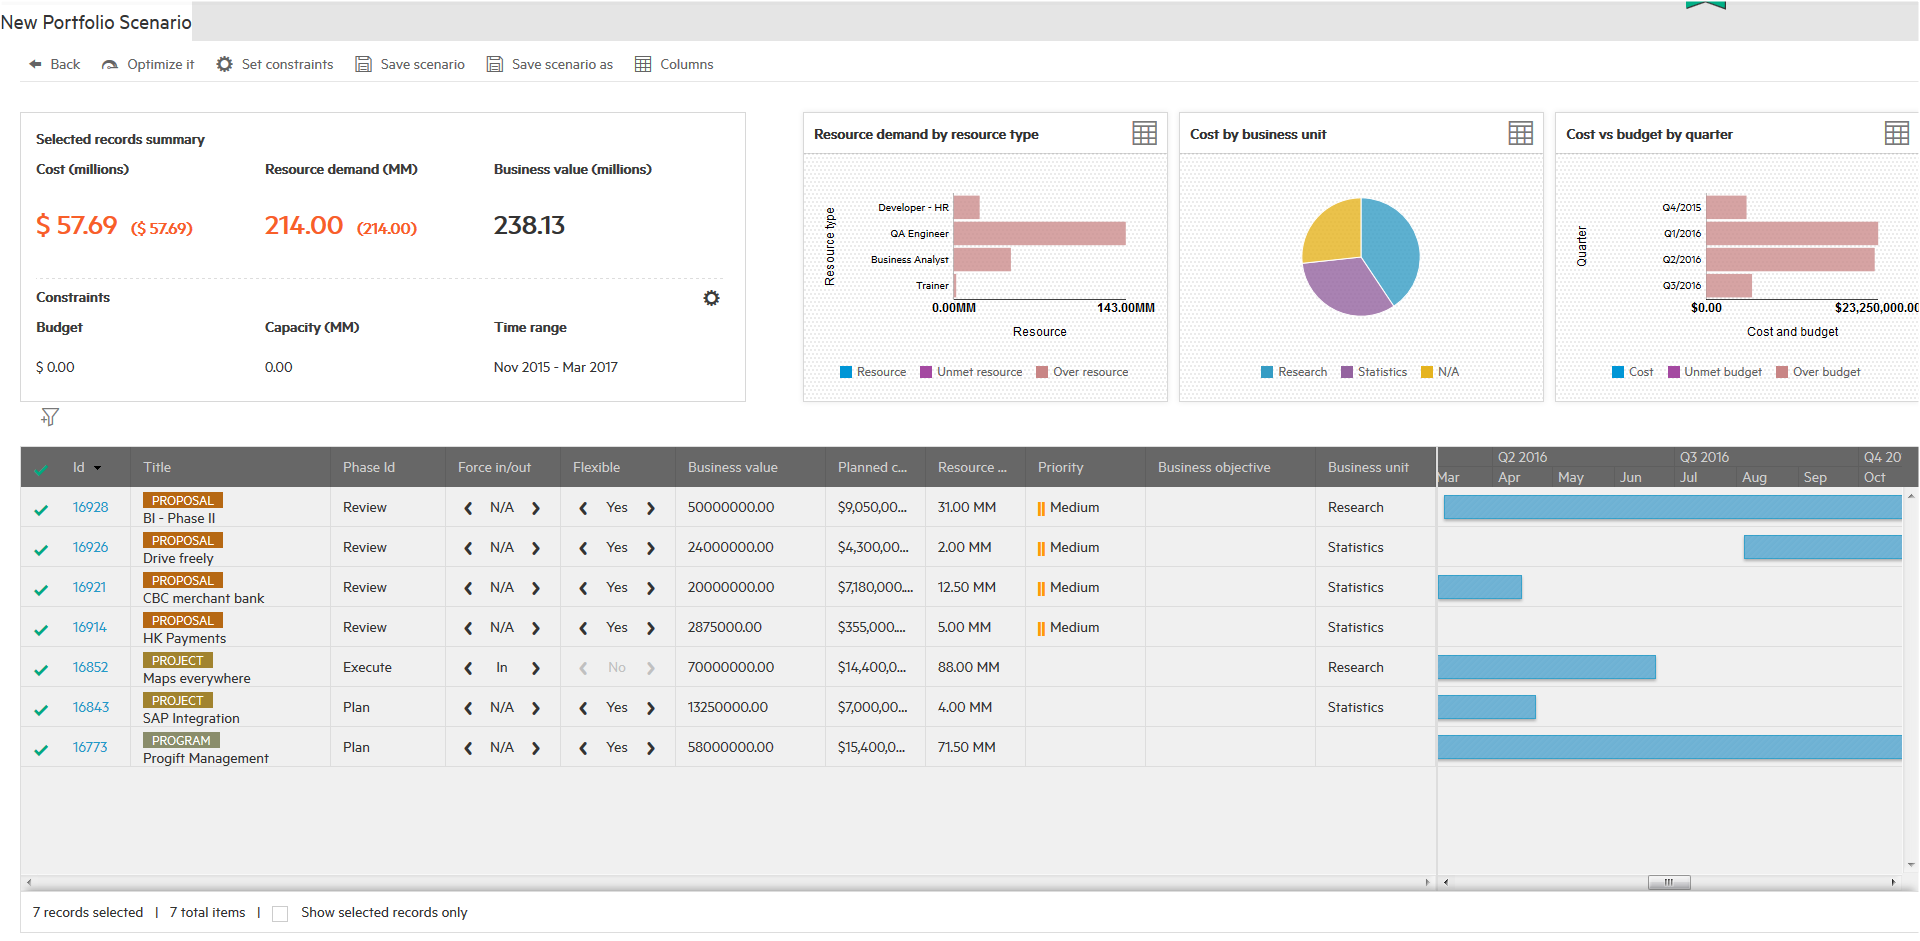
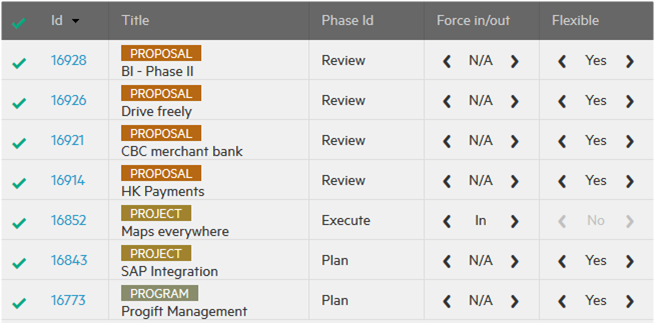
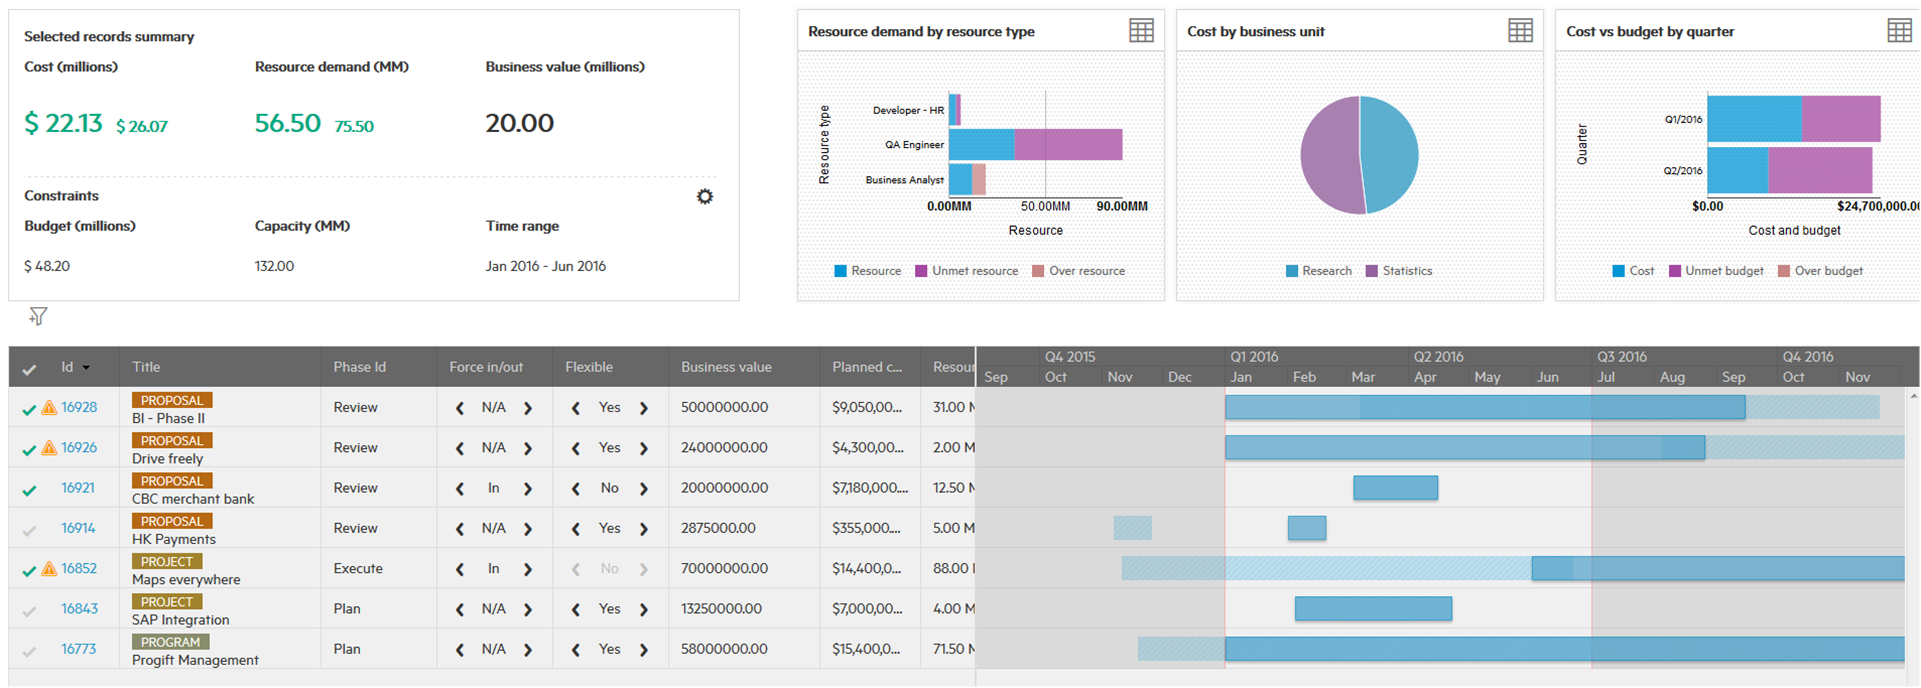
The bottom of the screen displays a table that includes all items in the portfolio that are relevant for the optimization. For each item, key information such as ID, Title, Business value, Planned cost, Resource demand, Priority, Business objective, and Business unit are included by default. Carl can click the checkmark to select or deselect an item.
An additional column (Force In/Out) is used for automatic optimization. Possible values are In (the item must be selected in the final optimization result), Out (the item must be excluded from the optimization result), or N/A (the optimization engine decides whether the item is included or excluded). Practically, if the project or program has begun, the item should be set to Force In as it would normally be expected to continue.
Next to Force In/Out is a column labeled Flexible, with values of Yes or No. Yes means the item is flexible in scheduling, so the start and end dates could be changed as long as the duration (End date minus Start date) is not changed. No means the item is not flexible in scheduling, so the item must begin at its start date. Practically if the proposal, project, or program has a committed start date or if the project or program has actually started, the item could be set to not flexible.
In Carl’s portfolio, project 16852: Maps everywhere is set to not flexible and forced in by default, as it is already in Execute phase.
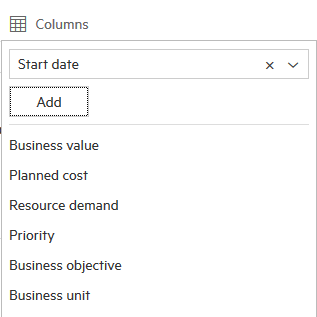
Carl wants to see the Start date and End date as well, as they are also important for the optimization. Carl clicks the Columns button in the top, selects the Start date column from the field list, and clicks Add to add it to the displayed columns. He does the same for the End date column.
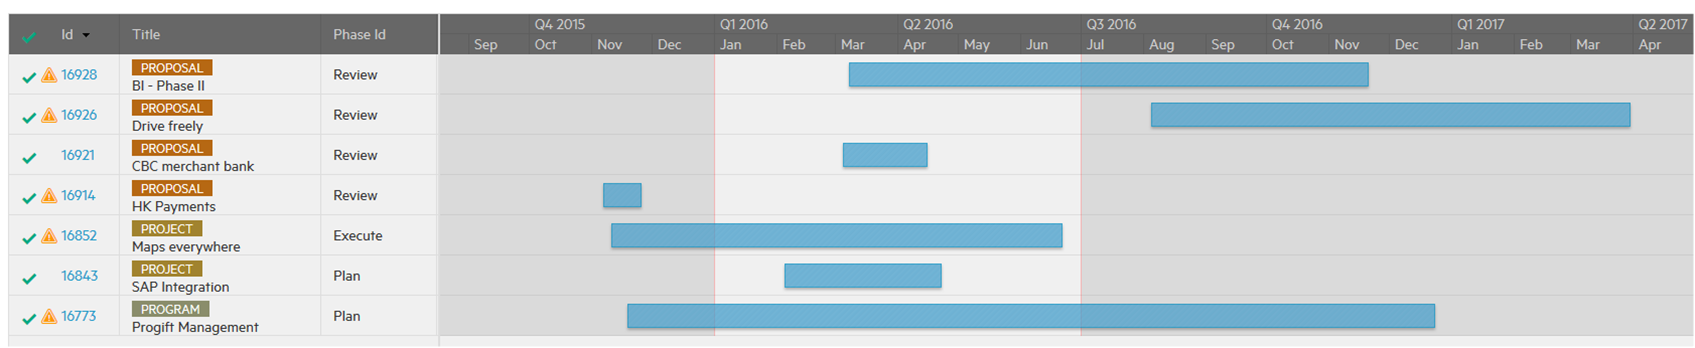
The Gantt chart in the right bottom section of the screen shows the current schedule of all suggested items. The total time span begins with the earliest start date of an item and ends with the latest end date of an item. This time range is also called the "optimization window".
The top left of the scenarios screen displays three key statistics:
-
Cost and budget
This displays the total cost within the time range for all the selected items in the table.
-
Resource demand and capacity
This item includes the total resource demand within the time range for all of the selected items in the table.
-
Business value and time range
This item shows the total business value within the time range for all of the selected items in the table.
Before making any changes, Carl sees the following:
- The total business value of all the items is $238.13 million.
- The time range is November 2015 to March 2017, which is the entire duration of all the items in the portfolio.
- The total cost is $57.69 million.
- The total resource demand is 214 man-months.
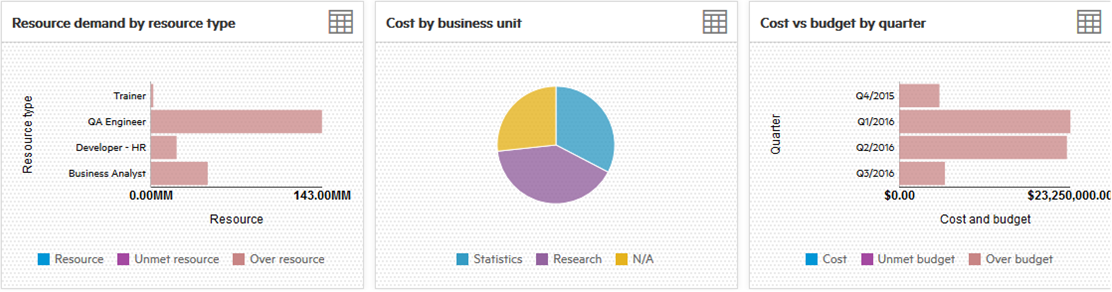
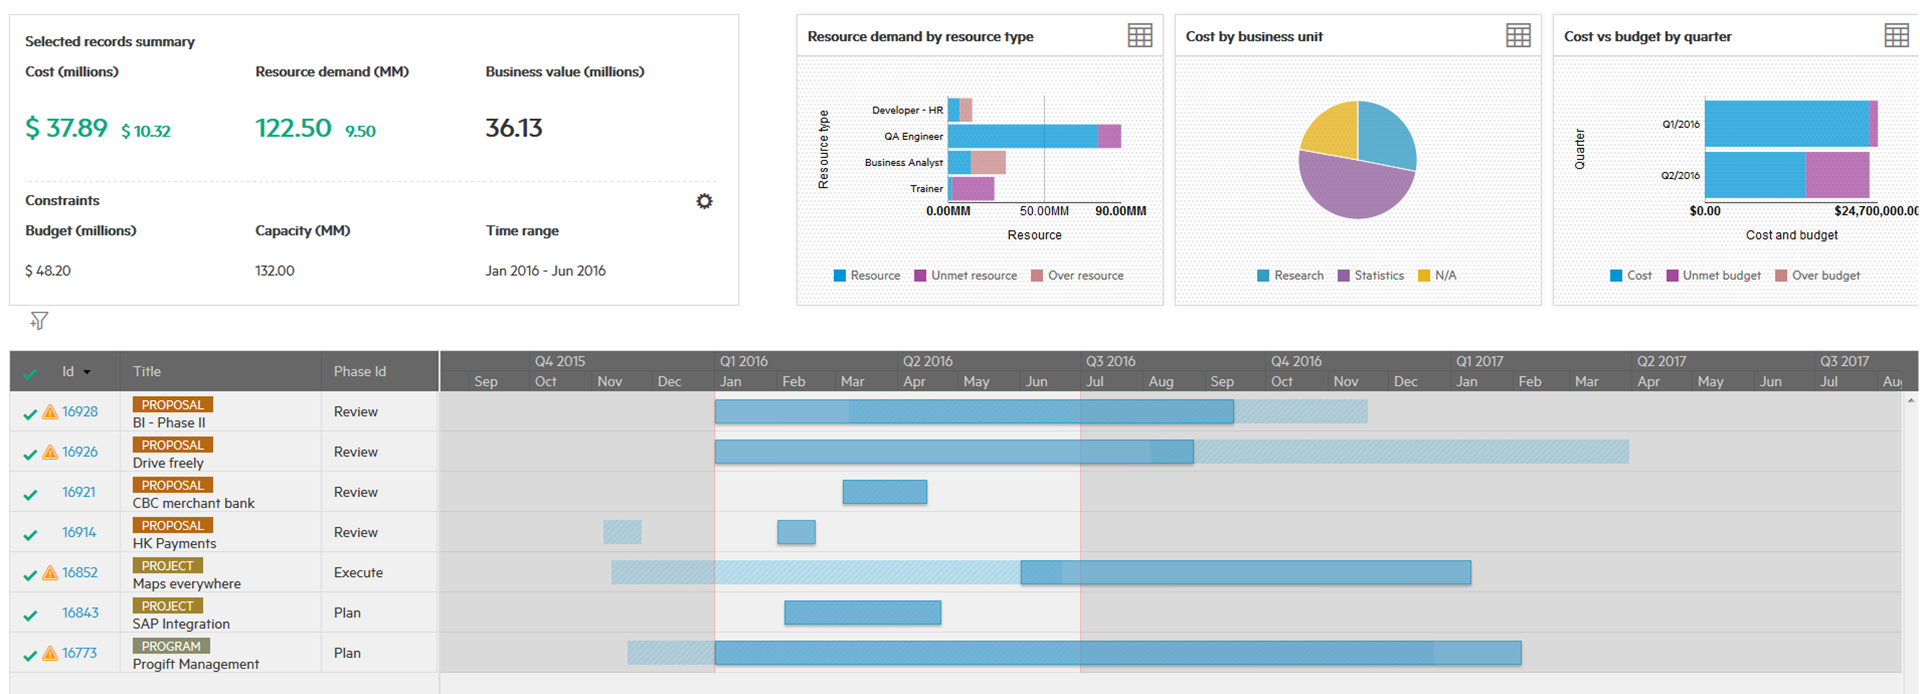
The top right of the scenarios screen displays three charts:
-
Resource demand by resource type
This chart shows the resource fulfillment status for each resource type.
-
Cost by business unit
This chart shows the cost distribution between different business units for all selected items.
-
Cost vs budget by quarter
This chart shows the budget and cost status for each quarter during the time range.
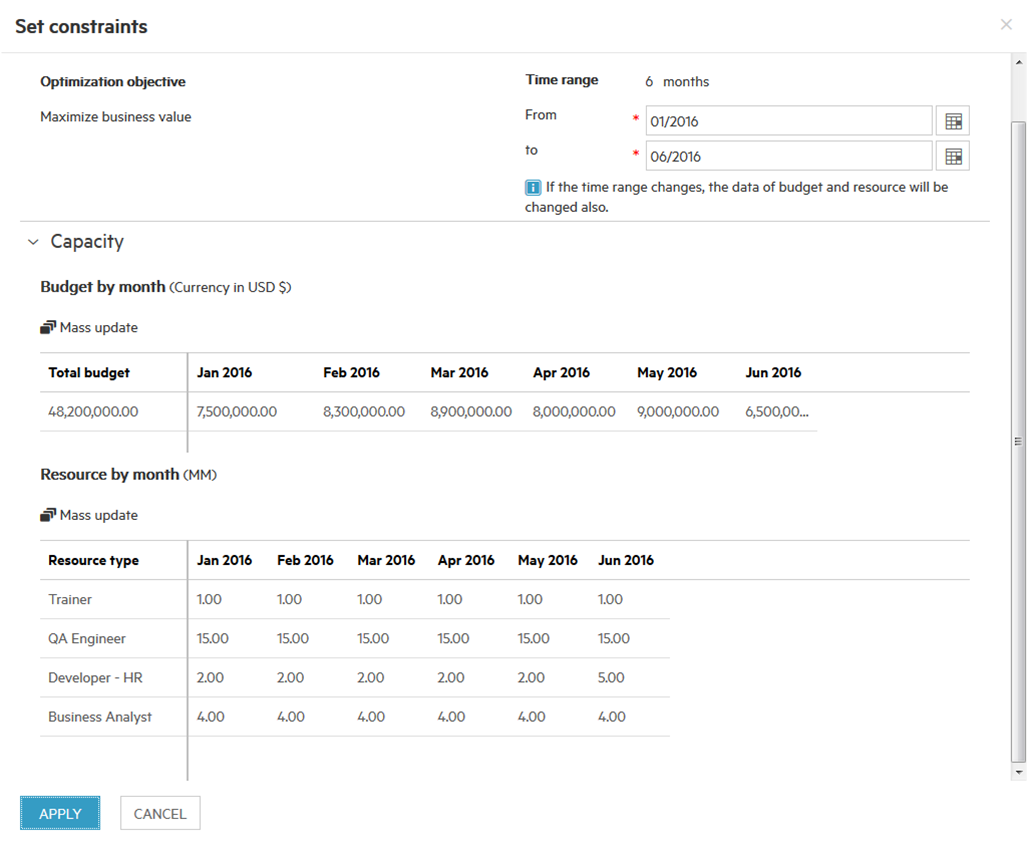
Carl's purpose for the optimization is to get the maximum business value for the first half of 2016, when he has the budget. So he clicks the Set constraints button and changes the time range to span from January 2016 through June 2016. Carl's total budget for this period is $48.2 million, and he also inputs the budget for each month.
Carl knows that his team's capacity is 15 QA engineers, 2 developers, 4 business analysts, and 1 trainer, so he assigns the correct capacity for each month in the Resource by month section.
Carl can use the Mass update option in this dialog box to update multiple items of budget or capacity at the same time. He wants to know what would happen if his budget is cut by 30% in Q1:

When Carl decides that he doesn't want to use the mass update option, he clicks the Reverse to last saved button to go back to the last version of the scenario that he saved.
Now Carl notices some changes:
-
First of all, the Gantt chart now shows the new time range, and some items are now out of the time range. So these items will show warnings next to the ID.
-
Secondly, with the budget and capacity set, the key statics and charts are also updated. Now, Carl sees that the budget can cover the total cost while the resource demand is over the capacity. The total business value is $103.25 million, showing Carl that he doesn’t have enough resources to complete the items within the time range.

Carl moves mouse over the warning icon before proposal 16914: HK Payments, indicating that the proposal does not fit within the time range. Carl knows this proposal is just in the planning stage and has a flexible start date, so he drags the start date of the proposal in the Gantt chart and to 1 February 2016. The warning before this proposal disappears.
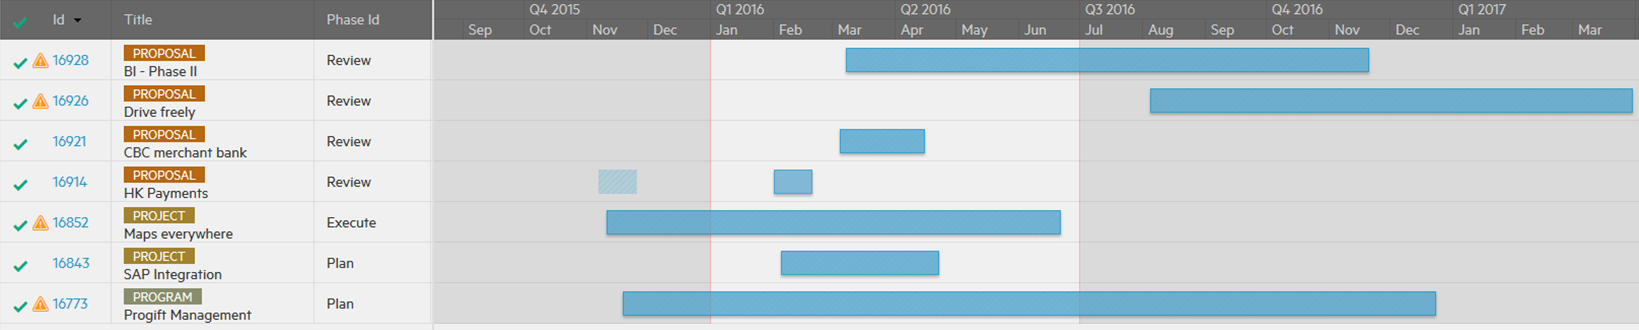
Continuing with his manual optimization, Carl moves the start date of proposal 16926: Drive freely to 1 January 2016 and does the same for proposal 16928: BI – Phrase II and program 16773: Progift Management. He also moves the start date of Project 16852: Maps everywhere to 1 June 2016. Now the total resource demand is also within the capacity.
Since both the budget and capacity are enough for the selected items, Carl is satisfied with his manual adjustments and saves this plan by clicking the Save scenario button. Since it is his first time saving this scenario, the Service Management asks for a name, and Carl calls it Manual result. After saving, Carl can open, view, and continue to edit this scenario at any time.
But Carl doesn’t know if the budget can cover the cost and the capacity can cover resource demand in each month. Carl also doesn’t know if this plan is the best possible plan. In addition, there is remaining budget and capacity. Carl wants to see if there are other possible selection that could achieve more business value.
Carl knows the proposal 16921: CBC merchant bank is critical and he wants this proposal in the final result, so he set this proposal to Force In. He also knows that this proposal is committed to start in March 2016, so he sets this proposal as not flexible.
When Carl clicks the ![]() Optimize it button, the tool tries to find the selection with the greatest business value.
Optimize it button, the tool tries to find the selection with the greatest business value.
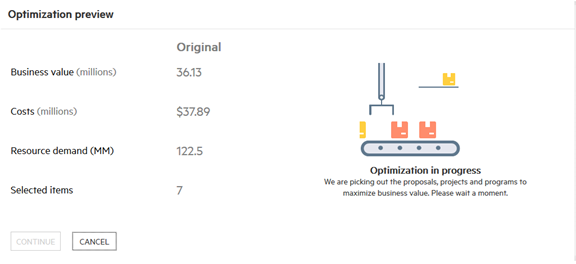
After running, the tool finds a selection that meets all constraints.
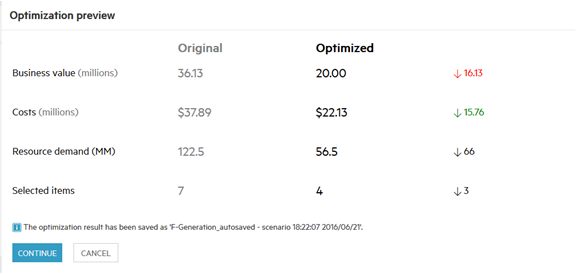
Carl accepts this result and clicks Continue. The selection is displayed in the UI, here proposals 16928, 16926, and 16921, as well as project 16852 are selected. All the budget and resource constraints are met. Note that in the automatic optimization, the optimization engine takes care of the resource demand and planned cost in each month to ensure they could be covered by budget and available capacity, which is much more difficult to do with manual optimization.
Carl wants to save this plan as well, so he clicks the Save scenario as button with the name Automatic result.
To compare these two results, Carl clicks the Portfolio scenarios tab and selects the F-Generation portfolio. It displays all of the scenarios for this portfolio, including key information such as total business value, cost, resource demand, and selected proposal numbers.

Carl selects the Manual result and Automatic result scenarios, and clicks  Compare scenarios. The tool shows the two selections next to each other, and Carl can compare the key statics and selections here.

Carl can now take these two options to his manager for review and to decide which plan to implement.
Related topics


