


Key concepts
HPE Operations Bridge Suite comes with a vast number of capabilities that enable and accelerate the transformation of your IT organization from a cost function to a value creator.
The following
- Dashboards and visualization
- Reporting
- Analytics
- Event management
- Monitoring
- Performance management
- Discovery
- ChatOps
Dashboards and visualization
Visualize your data and create dashboards to communicate information in a colorful, modern way. HPE Operations Bridge Suite enables you to create custom, flexible dashboards, and to display key performance indicator (KPI) and health indicator status data in a comprehensive way to provide a focused means to attract a team's attention to the right priorities.
By using dashboards and various visualization options, you can create visible business value while also increasing productivity with easy-to-use interfaces.
Business Value Dashboards bring your data to life. Create custom, flexible dashboards that visualize information from different sources in an informative and appealing way. In contrast to the more operational monitoring dashboards, which are used to efficiently monitor system health, business value dashboards help you understand the value driven by your IT environment. Your dashboards can be accessed anywhere, anytime, from any device. Incorporate your own graphics, add color to identify status, and receive real-time updates.

|
|
Anytime, Anywhere. Create real-time dashboards. You choose how often you send data to the dashboards and they display the data with no delay. You decide where you want to view your dashboards: PC, tablet, or phone. |
|
|
Simple, Colorful, Flexible. Design your dashboards using Microsoft Visio. A Visio stencil is provided, with shapes that later become the widgets in your dashboards. The shapes include widgets for drawing charts, coloring text or values, displaying information feeds, web pages (for example, video streams), and much more. Sample dashboards are provided to help you get started. |
|
|
Connect. Once uploaded, you connect your widgets to the data. You can set additional widget options, such as rules, that determine the visibility and status colors of the widgets, or you can link widgets to other dashboards to enable drill down. |
|
|
Integrate. Any kind of data can be processed as long as it is sent in JavaScript Object Notation (JSON), a language-independent, open data format. Operations Connector provides policies that automatically forward data collected from various sources. Alternatively, create your own integrations for any data source by writing an adapter. The adapter must convert the source data to JSON and send the JSON-enabled data to the data receiver. |
Enrich your dashboards and put your team's focus on the things that matter most to your organization by using customized health and key performance indicators. Ensure that you uphold your service level agreements (SLAs) by monitoring the relevant KPIs and tracking how they change over time. Dashboard topological views can be linked to health indicators to provide the best overview. This enables you to more quickly and easily prioritize and assign events that have the most impact.
When setting up a new monitored application, key performance indicators (KPIs) and health indicators (HIs) need to be considered first. The following are the key questions that must be answered:
-
If application availability and performance is important, how should those KPIs be measured?
-
What are the SLAs that might be breached if application availability and performance thresholds are not met?
The IT organization is not only responsible for ensuring that this application is available, but also that all associated resources perform according to user expectations. All of this information must be factored into the selection of KPIs and the definition of HIs.
Monitoring Dashboards provide you with an at-a-glance overview of the events from your monitored environment. They enable you to quickly assess the health of the environment and to identify areas that require your attention.
Monitoring Dashboards display status information by using widgets as building blocks (for example, stack and pie widgets). Each widget references an event filter, a view, or both, and displays only the status of those events that match the criteria of the filter and that are related to the CIs included in the referenced view, making it easy to customize.
Users can configure their own dashboards, or use default dashboards, including the 360° View dashboard, which provides a high-level overview of the status of CIs in a selected view, or the KPI Over Time dashboard, which shows the status or the value of selected KPIs and CIs over time. The Top View also enables users to see the business availability of system components at a glance.
The following figure shows a Monitoring Dashboard screen:

With event-based data, you can see which related CI is affected by an event. Additionally, health data, such as event type indicators (ETIs), health indicators (HIs), and KPIs, is used to evaluate the health of related CIs in the context of the event.
HIs provide fine-grained measurements on the CIs that represent your monitored applications and business services. Some HIs provide business metrics such as backlog and volume, while others monitor various aspects of performance and availability such as CPU load or disk space.
ETIs are categorizations of events. As multiple data collectors may send event samples regarding a single event to OMi, events are generalized into a common type.
For any device, such as a server, the severity of the problems directly associated with the server is collated and combined with the information about the devices associated with the server. The combined data is passed to calculation rules that evaluate and set the KPIs that indicate the overall health of the object.
The following figure shows part of a Health Perspective screen, in particular the Health Top View, which shows a hierarchical overview of the relationships among the objects associated with a selected event:

You can see the health status of an object, its KPIs, and HIs, and see how the health status of the selected object affects the health of related objects. For example, you can navigate to check the health of neighboring CIs. This information helps you analyze which events to focus on, and prioritize event handling to maximize availability and minimize negative impact on business services. Users can also select views to show only the events and CIs for which they are responsible.
Reporting
For organizations that value analytics-driven automated operations, intelligent reporting is crucial. The Operations Bridge Suite features Big Data model-driven reporting and forecasting with more than 250+ out-of-the-box reports.
Use cross-domain reporting to consolidate performance data and metrics from multiple collectors, and look into how log analytics can help to pinpoint the cause of problems in your IT network.
Address the challenges of reporting in dynamic IT environments by consolidating performance data and metrics from multiple collectors. HPEOperations Bridge Suite comes with a business service-driven IT reporting software that provides resource, event, and response time reporting across server, network, and application environments. This facilitates viewing data from a number of valuable and unique perspectives.
Cross-domain reporting consolidates resource metrics, event metrics, response time data, and business service topology data. This Big Data based enterprise reporting platform is the industry's only model-driven cross-domain and consolidated reporting tool.
Cross-domain reports display data from related domains to give an end-to-end picture of the health and performance of your IT infrastructure aligned with the business services. Individual reports are available, which display data from single domains. You can navigate to these individual reports for further analysis.

Analyze usage trends across domains by correlating service and infrastructure metrics. For example, if your organization experiences poor response times for the HR service, could this be part of a trend or do you have similar behavior in other areas? What do you need to change to improve these response times? These type of questions can be answered using the HPEOperations Bridge Suite.
By connecting the performance metrics to the underlying infrastructure metrics, you are able to easily determine which resources consistently present issues and plan ahead.
Apart from solving particular cases like the one described above, it is also increasingly important for organizations to be aware of changes in their infrastructure in order to react to those changes on time. The reporting software is updated by automated discovery to show you the changes in the infrastructure that supports the service. You are then able to follow your usage trends across changes in the topology. By doing this, you can easily manage the distribution of loads across your virtual environment.
Analytics
For organizations that value analytics-driven automated operations, intelligent reporting is crucial. The Operations Bridge Suite features Big Data model-driven reporting and forecasting with more than 250+ out-of-the-box reports.
Use cross-domain reporting to consolidate performance data and metrics from multiple collectors, and look into how log analytics can help to pinpoint the cause of problems in your IT network.
The Operations Bridge Suite helps your organization turn volumes of raw data into actionable insight by unifying search, reporting, alerting, and analysis across all types of IT data. Generate insights from the data in your IT environment that you choose to collect by using log analytics.
To find the root causes of problems, use the Operations Bridge Suite capabilities to prepare, predict, and pinpoint:
- Prepare. Collect and use all your data in a Big Data based system
- Predict. Identify trends as they happen by using predictive analysis
- Pinpoint. Pinpoint root causes of events that cause a problem in your IT network
Log analytics help to pinpoint — identify the root cause of a problem by creating a list of the top suspected log messages and displaying them visually in a pane.
To identify the root cause of a problem in your network, log analytics uses an algorithm to convert logs into metrics. The algorithm runs over a specific time range. Define this time range for a host or a user defined group of hosts. The algorithm uses a number of different parameters to calculate message and event significance, such as:
- Distance from problem time
- Severity
- Specific keywords
- Repetition and seasonality
- User feedback
Launch visual analysis directly from interesting metrics in log messages.
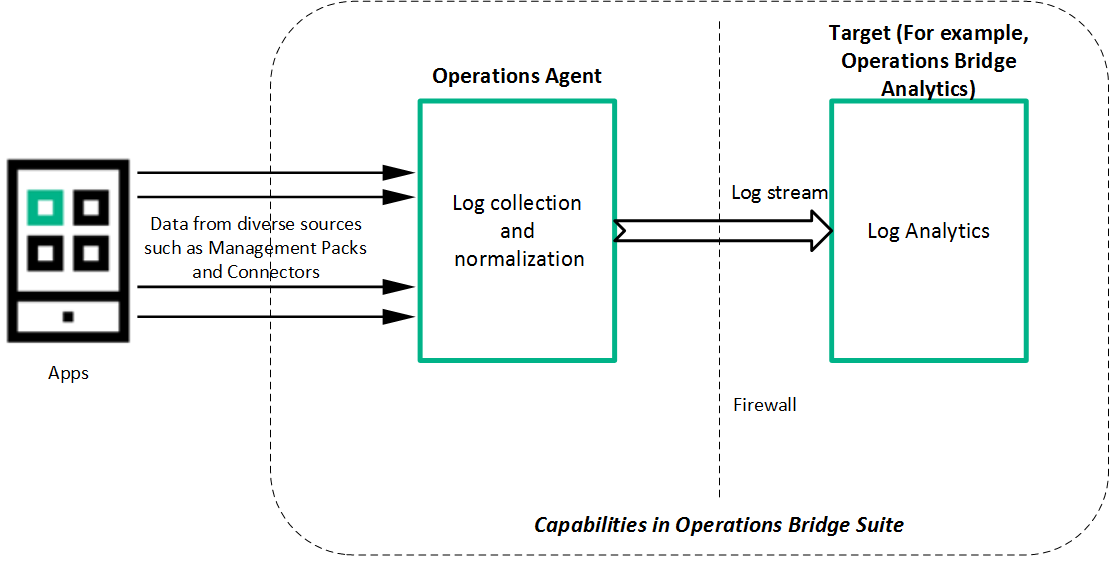
The Operations Bridge Suite offers you a unified and robust mechanism to collect, process, and stream application logs in your IT environment. You no longer need to use third-party systems to collect and stream logs. Operations Bridge can collect and stream logs to multiple targets, for example, Operations Bridge Analytics. Operations Bridge Analytics can use these logs to predict trends and pinpoint issues in your IT environment.
Enable Log Streaming to:
- Collect: Collect and consolidate data from diverse data sources.
- Process: Normalize the consolidated data. For example, with value maps.
- Stream: Forward the logs to the required target.
The following figure shows a high level work flow for log streaming:
Event management
For many organizations, one of the biggest challenges is how to manage the large number of events that originate from a variety of sources. HPEOperations Bridge solves this challenge by consolidating IT events from all of your domains into management activities. This consolidated view helps your IT operators to quickly identify the causes of IT incidents and rectify issues in less time.
Use event correlation in order to reduce the number of events in a quick and efficient way. You can suppress duplicate events, close related events automatically, use stream-based event correlation (SBEC) to identify commonly occurring events or a combination of events, or use topology-based event correlation (TBEC) to differentiate between events that are the root cause of the problem and events that are simply the symptom.
Identify and fix problems before they occur by using anomaly detection. IT operators receive notifications about metric anomalies before they become an issue, by using the HPEOperations Bridge capability for predictive analysis.
Automate remediation in order to decrease your operators' workload. As the manual resolution of incidents can be time consuming and error prone, automated problem resolution improves the application uptime and reduces costs.
The HPEOperations Bridge Suite gives you the tools to dynamically and automatically discover and correlate data, events, topology, and metrics. Events of all types from multiple sources are consolidated into a centralized console.
Perspectives provide operators with different levels of information about the events for which they are responsible.
Events report important occurrences in the managed IT environment. They are generated by domain managers and mapped to related configuration items (CIs) in the Run-time Service Model (RTSM). These events are assigned to operators for resolution. Operators can see a complete overview of all active events that must be worked on. They can see such things as the event severity, the type and category of the event, the source of the event, the time and location of the event, and the affected CI.
Events pass through a lifecycle, which is an informative way to display and monitor the status of an event. An operator’s workflow is based around the lifecycle of an event. The lifecycle state of an event represents the progress of the investigation into the problem that caused the event. An operator assigned to an event opens an investigation and works on finding a solution to the event’s underlying problem. Experts can then assess the proposed solution, verify that it solves the problem that caused the event, and close the event, which completes the lifecycle.
Operators can configure the user interface to suit the requirements of their typical workflows. The contents are filtered according to the selected view or CI. Operators can configure new filters or modify existing filters, according to their needs, to change the information displayed. Filtering the contents helps operators focus on the most useful information (for example, to identify the highest priority events and to determine which of these events should be worked on first to minimize their impact on business services). Administrators can also configure users and groups so that they can see only the events filtered by views associated with that user or group.
Operators can enrich events with additional information (for example, by adding annotations to the event to either aid further problem resolution or to document what action was taken).
Events that require special attention can be forwarded to the appropriate operators. For example, the system can be configured to route notifications to operators and escalations to the appropriate help desk operators who can concentrate on managing escalated events and fixing underlying problems.
In a large environment, one of the biggest challenges is how to manage the large number of events that originate from a variety of sources. The aim is to identify the events that have a significant impact on business services. While it is essential to minimize the number of events that appear, it is even more important to highlight the events that, if not managed properly, could cause a breach in service level agreements (SLAs) and generate incidents in your help desk system.
A new event may be a duplicate of an existing event. As a simple example, due to network stability problems, the same event is sent twice by the source domain manager because it did not receive an acknowledgment quickly enough for the first instance of the event. As new events are received, they are checked against existing events. If duplicates are found, new information, such as a change in severity, is used to update the existing event, and the new event is ignored. If duplicate event suppression is enabled, new events that are duplicates of an existing event are not retained and the original event is updated.
The advantage of correlating events using duplicate event suppression is that it reduces the number of events displayed in the console, but without losing any important information.
Suppressing duplicate events can result in additional correlations of the original event (both as a cause and as a symptom). When a duplicate is identified, the timestamp for the original event is updated to the time when the duplicate was received. The event is then correlated again and may now be related to other events which were not available for correlation when the original event was received.
A new event can automatically close one or more existing events. When a new event arrives, a search is made for existing related events. Some specific information contained in the new event is used to match the new event to any existing events, and the new event closes the existing event.
For example, an existing event may be a notification of a problem or abnormal condition (a bad event) for a particular device. The bad event could be SQL Query Performance SLOW. Consider a new event matching this existing related event which notifies that the abnormal condition no longer exists (a good event). The good event could be SQL Query Performance OK. The new (good) event closes the existing (bad) related event.
You can track related events that were closed automatically in the event history.
Stream-based event correlation (SBEC) uses rules and filters to identify commonly occurring events or combinations of events and helps simplify the handling of such events by automatically identifying the events that can be withheld, removed, or need a new event to be generated and displayed to the operators.
The following types of SBEC rules can be configured:
- Repetition Rules: Frequent repetitions of the same event may indicate a problem that requires attention.
- Combination Rules: A combination of different events occurring together or in a particular order indicates an issue and requires special treatment.
- Missing Recurrence Rules: A regularly recurring event is missing, for example, a regular heartbeat event does not arrive when expected.
The event management process is simplified not only by consolidating events from all sources in a central console, but also by categorizing events using topology-based event correlation (TBEC). Dependencies between events are analyzed to determine whether some events can be explained by other events. For example, consider a database server (DB Server) that is running on a server (Server1). If the CPUs of Server1 are persistently overloaded, the resulting event SLA for DB Server breached can be explained by the causal event Server1: CPU persistently overloaded (100% for more than 10 minutes).
The key is to pinpoint the underlying causal events that are responsible for other symptom events so that you can prioritize the resolution of these causal events based on the impact to your business.
If two events occur concurrently (within a configurable time span), TBEC correlation rules identify one event as the cause and the other event as the symptom. Rule-based event management enables you to manage large numbers of similar (related) symptom events in a large network.
When any combination of the cause and symptom events occurs in the monitored environment, the correlated events are flagged. You can configure the user interface to display the root cause event and a separate overview of all the symptom events, thus enabling you to drill down into the correlation process and browse through the hierarchy of correlated events.
Events can also be correlated across technical domains, such as databases, hardware, networks, and web applications. This comprehensive scope enables you to correlate events that, at first sight, might not seem to have any connection. The cross-domain functionality also increases productivity by reducing the amount of overlap between operators responsible for monitoring different technical areas. For example, by correlating events relating to database problems, network problems, and storage problems, you can avoid the scenario of operators from the different technical areas all separately investigating different events that are the symptoms of one root cause event.
TBEC offers a number of benefits related to resolving complex events:
- Reduces the number of events displayed in the console, without ignoring or losing important data that enables users to drill down through the hierarchy of related events.
- Supports event correlation across multiple domains to simplify the root cause analysis of events that generate symptom events.
- Changes to topological data do not require changes to correlation rules.
If a problem is experienced on a managed system that results in the generation of an abnormally high number of events within a relatively short period of time, this is known as an event storm. It is very probable that the root cause is already known and is being addressed. However, related events are also being generated. These events do not provide any useful information but may result in significantly increased loads on the servers. To avoid this situation, you can configure the software to look for event storms from managed systems and discard all subsequent events until the event storm condition for a particular system is over.
When an event storm is detected on a system, events from this system are discarded until the rate of incoming events drops below the event storm end threshold. You can configure exception rules to select events from a system under event storm conditions that match a filter and either display these events or close them. The event storm end event automatically closes the associated event storm begin event.
Remediation is the process of problem resolution. It is available either as guided problem resolution or as automated problem resolution. The built-in remediation capabilities of the Operations Bridge automatically perform remedial actions with simple scripts or powerful run book automation.
By using automated or guided remediation, you can speed up the process of problem solving, because the necessary processes are streamlined or automated.
You can use a variety of tools to add guided problem resolution to your IT operators' workflows:
- Create tools to help users perform common tasks, for example, to check the status of an infrastructure element.
- Define custom actions for the operator to use when resolving certain types of events.
- Embed event-specific resolution instructions in the event.
The manual resolution of incidents is time consuming, error prone, and can be a security risk. You can use automated problem resolution to relieve your IT operators of certain tasks, while also improving application uptime and reducing costs:
- Automate routine remediation tasks and processes.
- Ensure audit compliance through documentation generation and reporting.
Run book automation enables users to customize and automate actions at the CI and event level, allowing complex corrective actions to be run in a smooth and standard way.
Monitoring
Manage your operations through a single pane of glass that provides an end-to-end infrastructure monitoring view of the IT landscape.
Collect data from multiple agent-based or agentless sources to turn volumes of raw data into actionable insight. Use Monitoring Automation to detect new IT infrastructure resources, deploy best-practice-based monitoring templates and activate them. Virtualization monitoring helps to better organize, plan, and predict any changes in your virtual environment.
The Operations Bridge includes multiple connector mechanisms that allow data to be collected. Metrics, events, topology, and log file data is collected from a diverse set of sources.
The resulting analytical capabilities help your organization increase the added value of sorted information by unifying search, reporting, alerting, and analysis across all types of IT data. This insight enables your team to prepare, predict, and pinpoint emerging issues before they impact the organization.
The data is gathered from agent-based or agentless collectors and can be streamed in a performance dashboard for real-time graphing, alerts, and analytics. You can also collect data from third party domain managers. For details about performance dashboards, see Performance management.
Agent-based data collection is supplied by a wide variety of management packs that work through Operations Agent. The management packs are installed on target nodes. By leveraging management packs, you can further automate discovery and monitoring, create domain-specific rules and perform cross-domain reporting.
For a full list of the available Operations Bridge management packs, see the ITOM Marketplace.
Agentless data collection is supplied by SiteScope. SiteScope is a monitoring solution that enables you to remotely monitor the availability and performance of your IT infrastructure.
For more information about SiteScope, see the Using SiteScope Guide.
Operations Connector enables you to collect event, metric, and topology data from a third party domain manager and transfer it to OMi, Operations Bridge Reporter (OBR), and Operations Bridge Analytics (OBA).
For more information about Operations Connector, see the Operations Connector User Guide.
Monitoring Automation simplifies the configuration and deployment of monitoring for infrastructure and composite applications. Your team creates blueprints of your IT environment and desired monitoring configuration, and monitoring automation does the rest, from discovery, to updating the model, to deploying the right monitoring configuration at the right time.
Modeling and monitoring design. Monitoring automation enables you to predefine a standard model for a service or composite application and decide how to monitor it. These models and monitoring standards serve as the blueprint for automating the process of discovering and monitoring your constantly changing IT environment.
Automatic onboarding of servers and applications. Using the models you've already defined for the components of your environment, monitoring automation can automatically discover new IT infrastructure resources, add them to your model, and immediately deploy monitoring policies.
For example, an HPE Operations Agent is added to your environment, and a node is automatically created. An automatic assignment rule triggers the deployment of an Oracle discovery policy, which discovers an Oracle database. Another automatic assignment rule deploys an Oracle monitoring policy, without any operators having to get involved. This flow also works for more complex applications, where you might discover multiple servers, databases, and so on. In this case, monitoring for different components can also be deployed using an automatic assignment rule. Regardless of whether the monitoring tool used is agent-based or agentless, monitoring automation deploys the appropriate monitoring configuration to the target instances.
When you automate the process of discovering and monitoring your IT environment, you avoid the risk of not monitoring an important application or continuing to monitor an application that no longer exists.
Easy-to-tune monitoring. Users don't need a deep knowledge of the specific monitoring policies to tune the monitoring configuration. They just need to tune the parameters.
Analyze the performance trends of elements in virtualized environments with near-real-time and historical data analysis and interactive dashboards.
When monitoring virtualized environments, it is crucial to receive alerts when there is an unexpected change in the state of the Virtual Machines (VM). With HPEOperations Bridge, you can analyze and generate smart alerts for abnormalities in the environment.
Configure the VM states for which you would like to receive alerts. Stop the alert generation for some Virtual Machine states, for example when the VMs are part of a planned maintenance activity.
You can monitor and view different aspects of your Virtual Machines in dashboards:
- Monitor the environment performance – display the VMs and their states filtered by the alerts you receive about them, or filtered by the VM resource usage (CPU and memory).
- Monitor the environment capacity – display the capacity and usage data of entities in a summarized or detailed analysis of your existing infrastructure, in order to improve the efficiency of resources by optimal sizing and placements of the VMs.
- View forecast data – get an overview of the entities that reach their capacity in the next few days, and analyze the data to plan the resource allocation effectively.
- View alerts – display any alarming issues in the environment that need immediate attention in order to troubleshoot the problem or draw graphs for the particular metrics.
Performance management
Analyze and diagnose performance data to view trends, compare current metrics with historic data, diagnose issues, and compare multiple big data components simultaneously in the same graph.
You can choose to use out-of-the-box dashboards or customize your own for the configuration items (CIs) that you are using.
Additionally, the Performance Engine enables you to stream custom and system metrics in large scale environments.
The Operations Bridge also includes the capability of cloud capacity optimization – this allows you to maximize the efficiency and resource utilization of your cloud environment.
Use performance dashboards to visualize system metrics and custom application metrics. By default, out-of-the-box dashboards are available. In addition, you can create and customize performance dashboards for the CIs that you are monitoring.
Performance dashboards help you perform the following:
- Explore and visualize performance metrics of a host of components such as applications, systems, and network.
- Quickly visualize the performance of important CIs by using personalized favorites.
- Share user-defined favorites as public favorites.
-
Embed charts such as graphs, tables, texts, process tables, and pies into the performance dashboard.
- Embed performance dashboards or single charts into any UI mashup page.
-
Parameterize instances to manage multiple instances across systems.
-
Visualize event information in the performance dashboard through Event Overlay.
-
Visualize time-specific data in the Date Range Panel.
-
Assign performance dashboards to CI Types (CITs).
-
Enjoy real-time visualization of performance metrics.
- Forward critical performance metrics to Business Value Dashboards.
- Compare CIs that belong to similar CITs by using the CI Comparison dashboard.

To enrich and expand the performance management capability, you can install the OMi Performance Engine. The Performance Engine is an add-on component that provides streaming of custom metrics and system metrics in a large scale environment. It aggregates streamed data from different collectors, which receive data by using the RTCM-REST Web Service interface, and acts as the central store for all the data collected by these data collectors. The Operations Bridge Suite supports distributed stores of performance data in agents, as well as a centralized performance store.
Management Packs also use the Operations Agent REST Web Service interface to submit metrics data for metric streaming. By using the OpsBridgeStore datasource, you can visualize the metric data in your performance dashboards. If the collection and forwarding interval is configured for five seconds, then the cache will hold one hour of data. The metric data is stored for one hour and can be displayed as real-time data in your performance dashboards. If a Vertica database is installed and configured, you can also store metrics for longer than an hour and display them in your dashboards.
OMi Performance Engine comes with Transport Layer Security (TLS) support for PE Kafka message bus. Kafka TLS provides additional security by authenticating connections to Kafka brokers from clients (OMi Performance Engine producers and consumers) and other brokers. It also encrypts the data transferred between brokers and clients, and between Kafka brokers. If required, you can disable Kafka TLS either during installation or post installation. For more information about enabling and disabling Kafka TLS, see the OMi Performance Engine Installation and Configuration Guide.
Performance dashboards, in combination with the Performance Engine, provide the following capabilities for users:
- Visualize, investigate, and review the performance of specific system infrastructure metrics as well as custom application metrics in real-time.
- Aggregate and stream custom metric data and system metric data for more than 25000 data points/sec from managed nodes.
- Install the Performance Engine separately on an additional server to support additional real-time data sources and thus providing a scalable environment.
Maximize the efficiency and resource utilization of your cloud environment. Plan for growth and optimize placement with historical usage data, forecasting, and what-if-modeling.
Optimize the capacity of your cloud with the following information:
- Virtualization infrastructure overview. Identify the over- and under-utilized resources and idle virtual machines in your cloud.
- Sizing recommendation. Get recommendations on how to optimize your current resources without impacting the service levels or product performance. These recommendations are based on the historical resource usage, demand trends and available capacity.
- Entity usage overview. View the usage summary pages for each entity in your virtualization environment.
By using this information, you will be able to analyze the capacity, usage, and allocation trends for various resources in the cloud. You can draw reports based on the utilization and consumption of the resources and tune your infrastructure for maximum efficiency by reclaiming unused resources.
Forecast the resource utilization of entities in your environment and determine the use of underutilized resources. This way, you can efficiently plan the allocation of resources in your environment and determine the impact of adding additional resources.
Recommendations can help you uphold the health of the hosts and data stores, as well as resolve incorrect virtual machine sizing problems and achieve better virtual machine performance.
Get a cohesive view of the resource capacity, usage, allocation, remaining capacity, and opportunity to use the resources more effectively.
You can use horizontal bar charts and pie charts to represent the data graphically. These charts can show the allocation, usage, and capacity of the virtual machines' CPU, memory, or data store.
Example:
The example below shows a Right Sized pie chart which shows only the undersized and oversized VM CPU data.

Discovery
The Operations Bridge provides fast, accurate, and continuous discovery of your IT environment. Gain a real time understanding of application service models with Automatic Discovery. Discover topology information that relates objects and their dependencies in your IT landscape. Automated Service Modeling automatically discovers and models critical business services and business application in a top-down manner, starting from an entry point, such as the URL of the service.
This discovered information is used to build and continuously update a model of the IT environment that supports business services. This dynamically updated model, called the Run-time Service Model (RTSM), is an important differentiator for the Operations Bridge.
Discovery is enabled by agent-based and agentless data collectors, as well as third-party connectors that include identity and topology information from your existing legacy management tools. Discovery can also be driven by a specific discovery engine called Universal Discovery, with which the RTSM is compatible, accelerating the creation of that model.
Scenario: Validate the availability of your cloud provider.
Solution: Discover available Virtual Machines (VMs) to assure yourself that you are monitoring the appropriate VMs. In succession, manage your VMs by using Operations Bridge capabilities, for example a management pack. You can then display the KPI over time for server availability, the service and application performance and availability, and the metrics that are used by the management pack.
Scenario: You have a repetitive issue with one of the applications in your private cloud, and want to find out what the cause is.
Solution: Use discovery to relate the infrastructure of your IT environment to the monitored application. Alerts regarding the application issue are generated and shown as events in your monitoring environment. Event correlation then relates those events with the events detected on the infrastructure.
By using this solution, you will be able to see what the root cause is, and evaluate if the service provided by your cloud supplier is delivered as promised.
ChatOps
Use ChatOps with Operations Bridge to enable IT professionals to collaborate with the various systems they use. The collaboration is tied to the IT systems and processes, therefore making it more contextual, more efficient, more visible, and more traceable.
Automatically publish selected events into dedicated channels, execute tools directly from the chat, and benefit from the effects:
- Incidents are resolved faster
- Changes can be implemented with less risk
- Triage, remediation actions, and production changes are better audited
- End-users are introduced to a new medium with which they can interact with IT
- IT systems are more accessible through mobile devices
You can integrate Operations Bridge with a chat tool of your choice - multiple are available - in order to use ChatOps in the way best suited to the needs of your organization.
With ChatOps, you can further automate your monitoring environment while at the same time eliminate the barriers between your development and operations teams. This increases your IT's agility across the complete application lifecycle, which results in a faster time to market, higher quality applications, and reduced cost of application delivery.

For more information about the process and the released files, see Bot integration to OMi.