


Example – Create a Metrics Policy
This example describes how to create a metrics integration policy to capture and forward metrics from a third-party system to OMi.
For an overview of the tasks that are required when collecting metrics, see How to Collect Metrics topic.
-
Design stage
You have an application named
My Oracle Monitoring. This application writes various metrics from Oracle databases running on different computers to a log file.Each table row represents a line in a log file, where the entries are separated with the "|" sign.
Log File Line Number Data 11418724468|ORAPROD03;tungsten.elementary.com|tablespace_free_space[%]|39.3631591796875|tablespace_skew[%]|1.3631591796875|buffer_pool_hit_ratio[%]|98.3631591796875|in_memory_sort_ratio[%]|93.3631591796875|parse_to_execute_ratio[%]|999.363159179688|latch_hit_ratio [%]|89.363159179687521418724468|ORAPROD02;silver.elementary.com|tablespace_free_space[%]|39.4726257324219|tablespace_skew[%]|1.47262573242188|buffer_pool_hit_ratio[%]|98.4726257324219|in_memory_sort_ratio[%]|93.4726257324219|parse_to_execute_ratio[%]|999.472625732422|latch_hit_ratio [%]|89.472625732421931418724468|ORADEV;carbon.elementary.com|tablespace_free_space[%]|40.2490844726563|tablespace_skew[%]|2.24908447265625|buffer_pool_hit_ratio[%]|99.2490844726563|in_memory_sort_ratio[%]|94.2490844726563|parse_to_execute_ratio[%]|1000.24908447266|latch_hit_ratio [%]|90.249084472656341418724468|ORAPROD04;platinum.elementary.com|tablespace_free_space[%]|40.1240844726563|tablespace_skew[%]|2.12408447265625|buffer_pool_hit_ratio[%]|99.1240844726563|in_memory_sort_ratio[%]|94.1240844726563|parse_to_execute_ratio[%]|1000.12408447266|latch_hit_ratio [%]|90.124084472656351418724468|ORAPROD01;palladium.elementary.com|tablespace_free_space[%]|40.2179565429688|tablespace_skew[%]|2.21795654296875|buffer_pool_hit_ratio[%]|99.2179565429688|in_memory_sort_ratio[%]|94.2179565429688|parse_to_execute_ratio[%]|1000.21795654297|latch_hit_ratio [%]|90.2179565429688Entries in the log file have the following logical structure:
(
timestamp,entity_id,(performance_counter,counter_value){6}).Each line consists of two unique fields:
timestampandentity_id, followed by six repeating field pairs:performance_counterandcounter_value. -
To check the RTSM model for values that should be matched by the associated CIs, follow these steps:
-
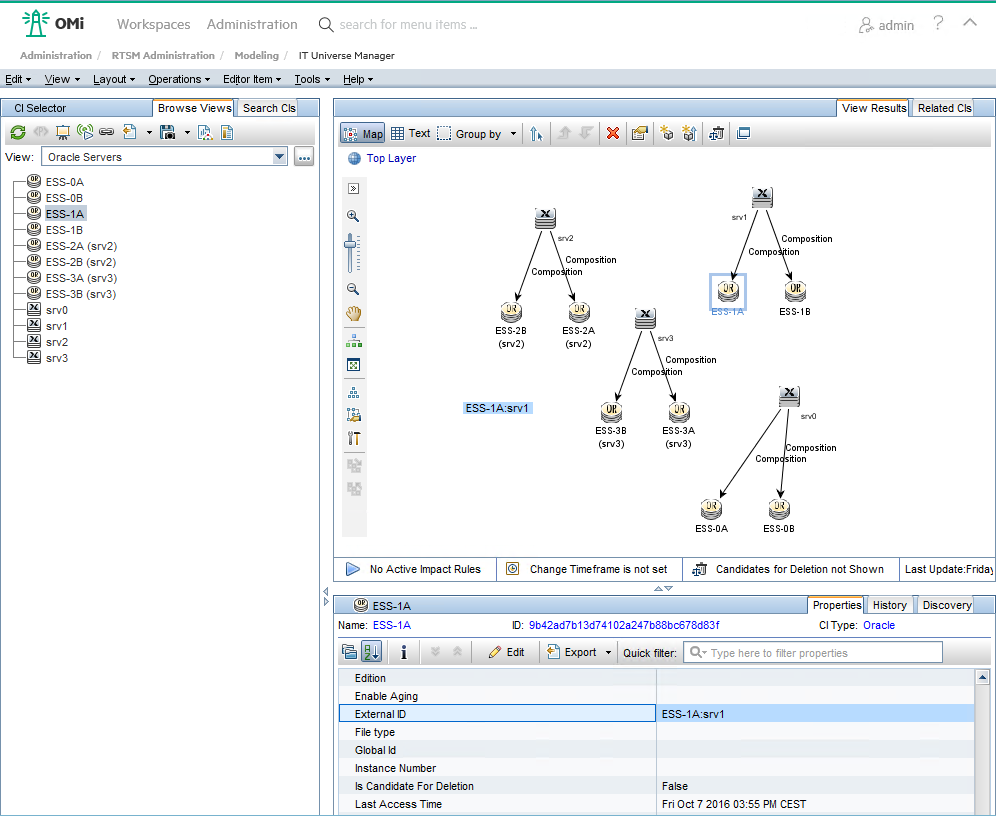
In OMi, select Administration > RTSM Administration > Modeling > IT Universe Manager. In the IT Universe Manager, select a view from the drop-down list provided on the Browse Views tab, and choose the one that you want to do the mapping for.
-
On Properties tab, Select
External IDand check its value because it is a link between the RTSM model and metrics stored in the OpsCx data store.Because
External Idis not visible in the list of attributes by default, set it to be visible as follows:-
In OMi, select Administration > Setup and Maintenance > Infrastructure Settings.
-
In the Infrastructure Settings, select the Foundations context and choose
RTSMfrom the provided drop-down list. -
In the RTSM - General Settings list, scroll down to the
Object Rootitem.
Click the button on the right side to open the editor and set the value of the object root to
 data. -
Select Administration > RTSM Administration > Modeling > CI Type Manager.
-
Select the CI Type data. On the Attributes tab, double click
External IDand enable theVisiblecheckbox from the Advanced tab. ClickOK.
The value of OpsCx metric attribute
Related CIin the OA datastore must match the value ofExternal IDin RTSM. To achieve this, either create mappings or define the rules in the Operations Connector appropriately, so that they match the values in the RTSM model. In this example, topology in RTMS is also created by theMy Oracle Monitoringapplication, thereforeRelated CImatchesExternal ID.
-
-
-
Create a structured log file policy for metrics integration
To create a structured log file policy for metrics integration, follow these steps:
For details about structured log file data policies, see How to Collect Metrics Data from Structured Log Files topic.
-
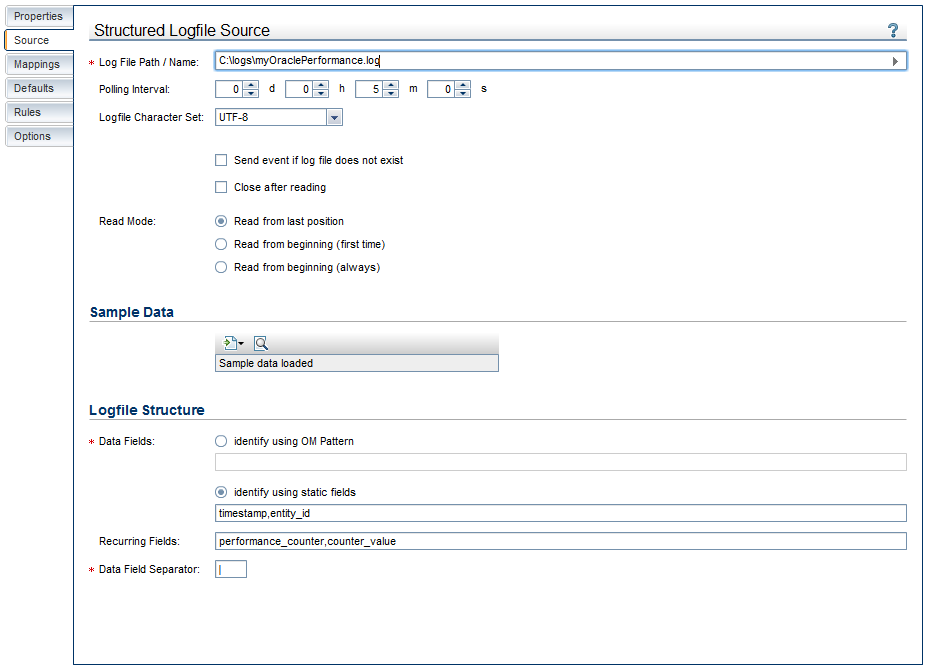
In the Source page, specify the full path to the log file on the Operations Connector system or a command that returns a path, and also define static and recurring fields according to the logical structure.

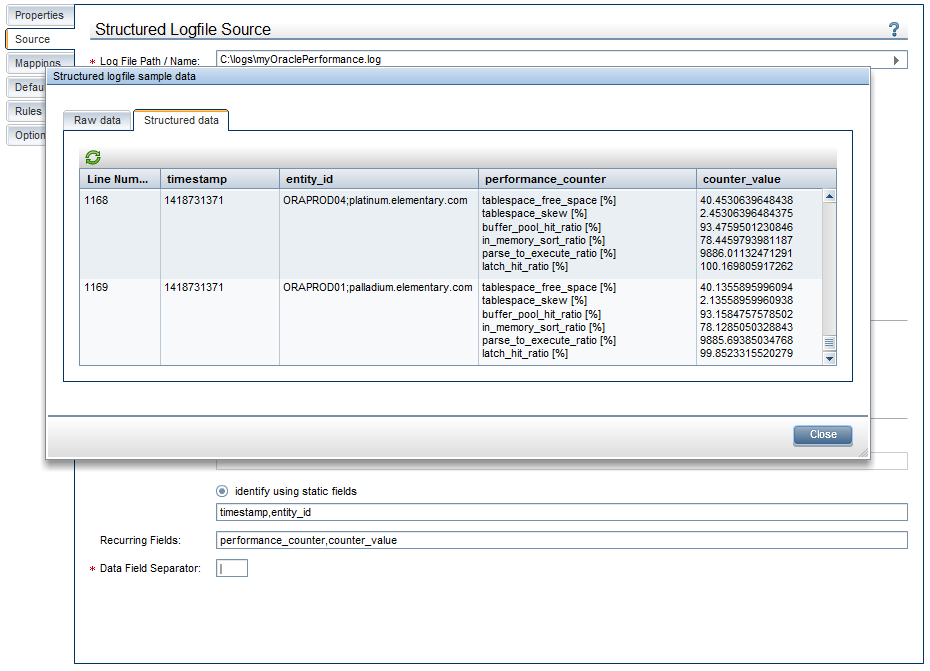
Check results with the view sample data feature (
 ) and apply the structure pattern definition by pressing the refresh button (
 ). For more information on the structured log file source page, see Configuring Data Source in Structured Log File Policies topic.
-
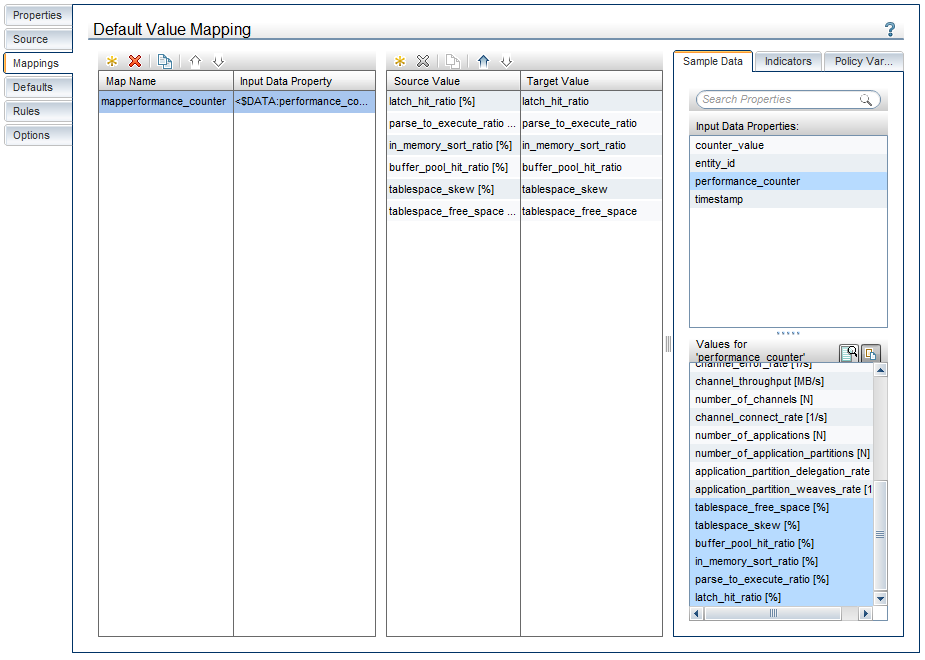
Define a mapping for the values of the field
performance_counterto strip the values of unnecessary information. You can drag the field from the Input Data Properties and drop it on the Default Value Mapping list. For more information on creating the mappings in the structured log file policies, see Configuring Mappings in Structured Log File Policies (Event and Metrics Only) topic.
-
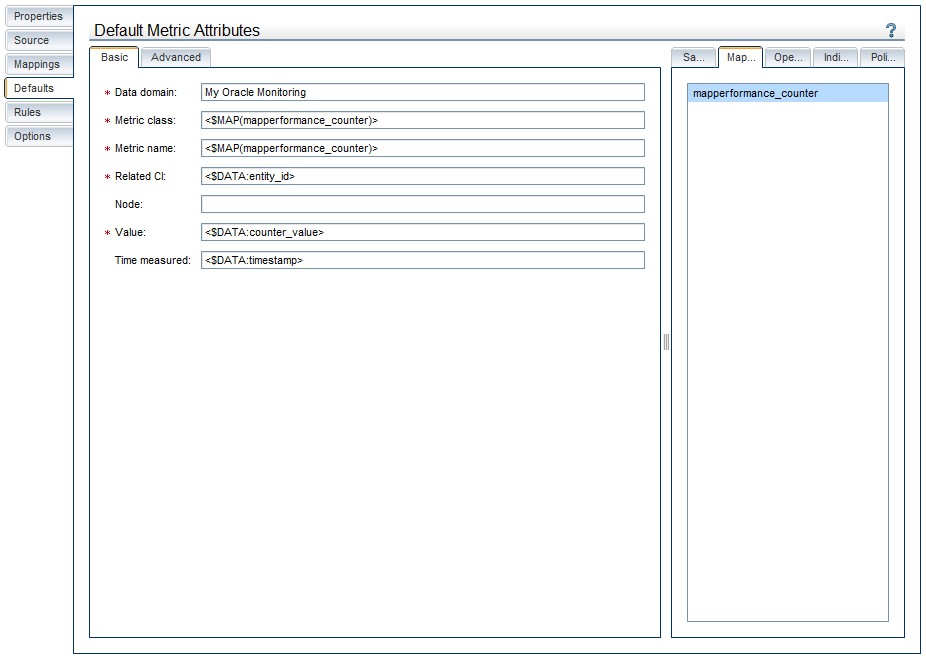
On the Defaults page, define defaults for the OpsCx metrics that are created from the policy configuration.
-
Data Domain attribute is set to
My Oracle Monitoring. -
Metric class and metric name are both set to the result of the value mapping (
<$MAP(mapperformance_counter)>) that is created when defining the mapping. Whenever incoming values that are structured by the field definitions are processed by the policy, the actual value is replaced according to the mapping definition. -
Related CI is set to values of the field
entity_iddirectly (<$DATA:entity_id>). -
Node is empty at this stage, it will be set when defining a rule.
-
Value is set directly by using the defined input data field
counter_value(<$DATA:counter_value>). -
The
timestampfield values from the input data are in the epoch time format, therefore you can set directly the Time measured field (<$DATA:timestamp>).

-
-
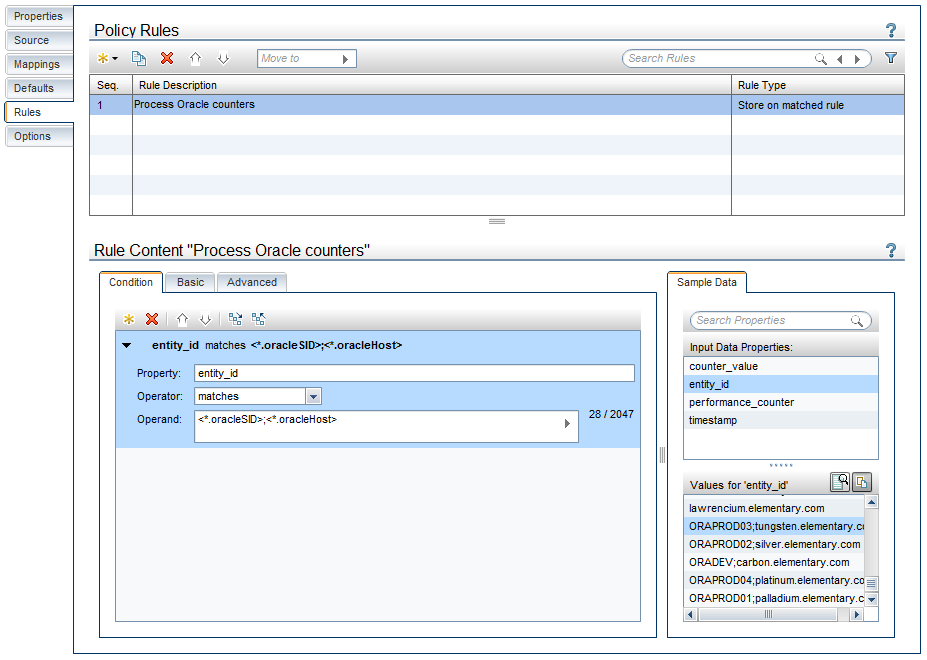
Create a rule to set the Node attribute, as follows:
Because the values of the incoming data field
entity_idcontain both Oracle SID and hostname, it is useful to create a policy rule for extracting the hostname. The rule condition uses OM Pattern Matching to perform the extraction to named OM Pattern Matching variables.-
In the Policy Rules section, click
 and select the "Store on matched rule" type.
 -
In the Rule Content section, click
to create a new condition. Click  to expand the new condition. Set the following:
-
In the Property field, specify
entity_id, or drag and drop this input data reference from the Input Data Properties list on the Sample Data tab to the Property field. -
Select the
matchesoperator. -
In the Operand field, type
<*.oracleSID>;<*.oracleHost>.
-

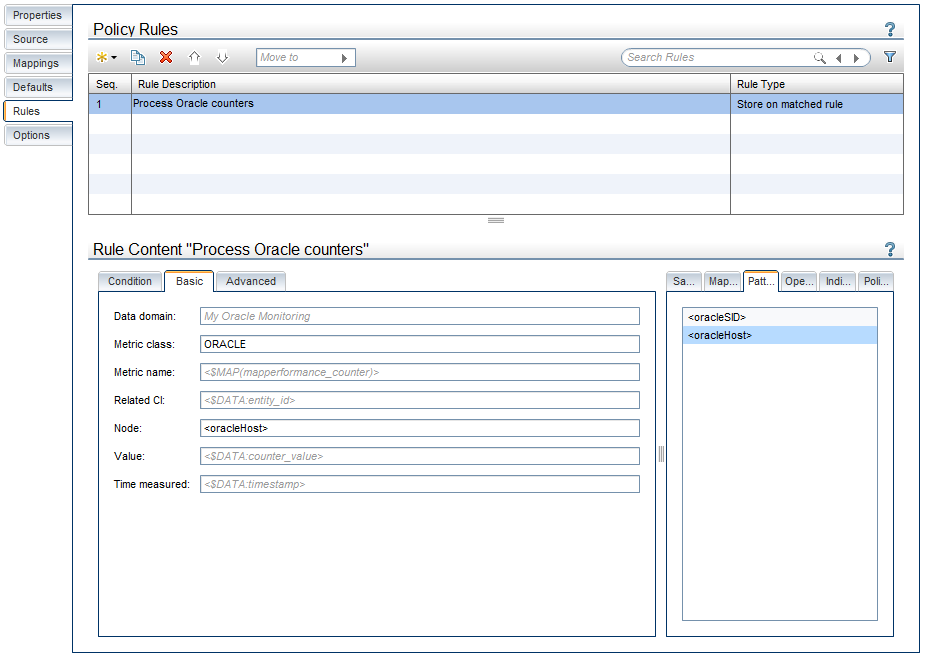
To set the Node attribute in this rule, override the default value. It might also be appropriate to set a common Metric class value specific for Oracle related counters in
My Oracle Monitoring.
-
-
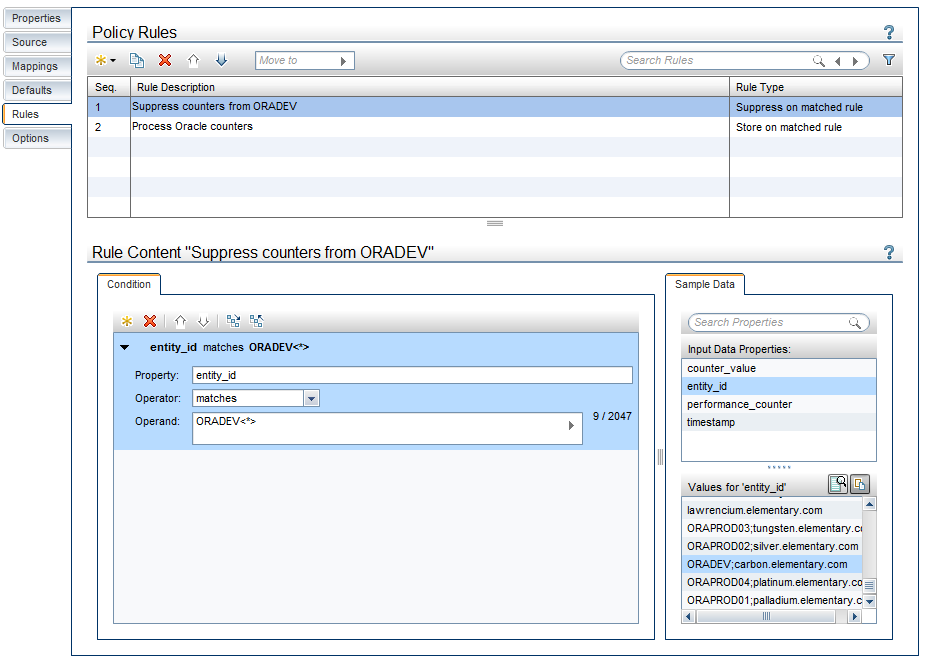
(Optionally) The log file from
My Oracle Monitoringcontains entries for an Oracle development system which should not be integrated at all. This Oracle system is denoted by its SIDORADEV. Create a rule of the "Suppress on matched rule" type and place it at the top of the rule list so that the policy skips entries in the log file for that specific instance.
For more information on creating the metric rules in the structured log file policies, see Configuring Metrics Rules in Structured Log File Policies topic.
-
Save and activate the policy.
-
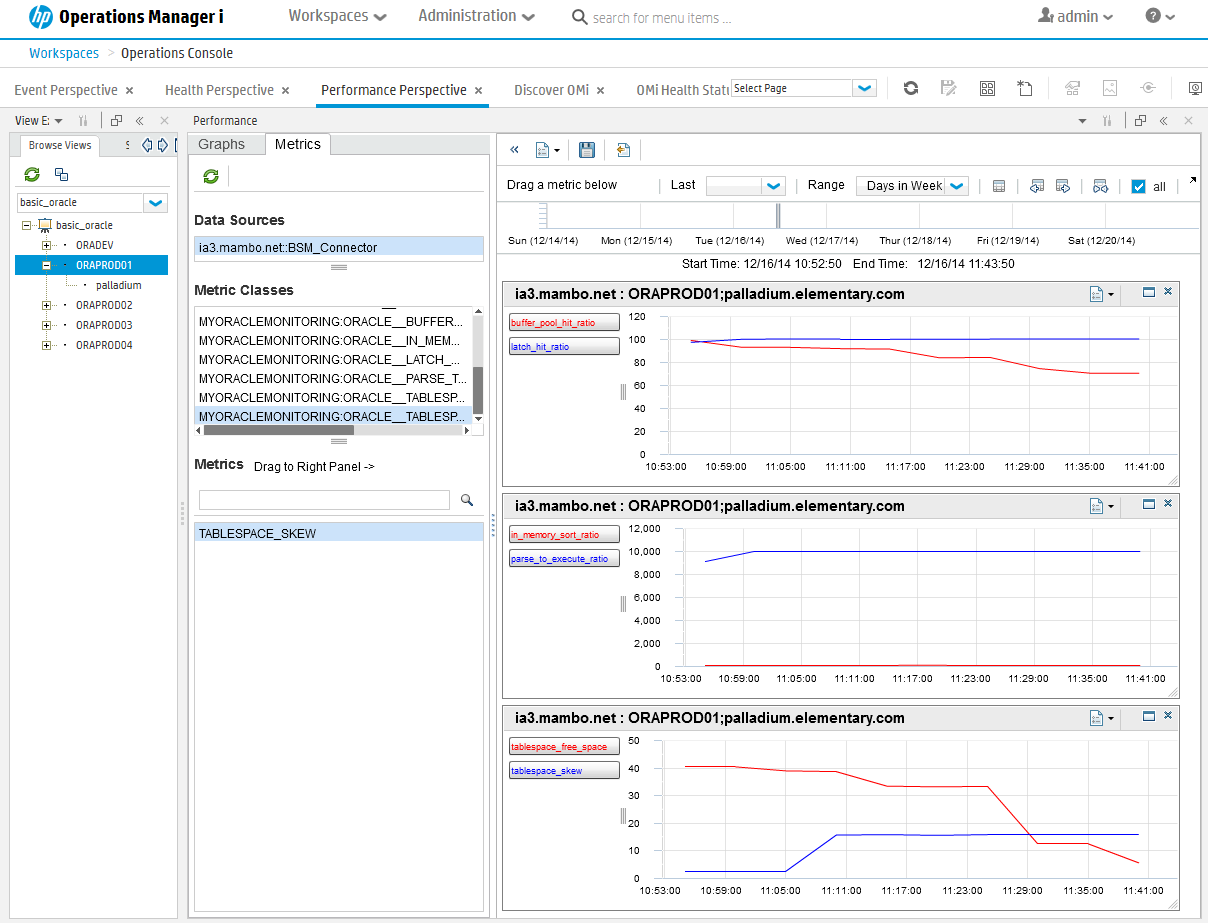
To view the contents of the performance data store in OMi, perform the following:
-
In OMi, select Workspaces > Operations Console > Performance Perspective.
-
In the View Explorer pane, select the desired view (that includes CI with metrics that you want to analyze) from the Browse Views tab, and then click the Metrics tab in the Performance pane.
If there is no CI with the External Id field that is identical to the Related CI field of the Operations Connector metric policy attribute, Metric Class is mapped to the Operations Connector host.
- Select the metric for which you want to check the performance and drag it to the subtab on the right to see the graph that shows the values for this metric.
Related topics
How to Collect Metrics Data from Structured Log Files
Configuring Data Source in Structured Log File Policies
Configuring Mappings in Structured Log File Policies (Event and Metrics Only)
Configuring Mappings in Structured Log File Policies (Event and Metrics Only)