


Use cases
After you have successfully configured SA-NA Integration, the following capabilities are available:
- Connections between network devices and servers
- Network Device Information in SA
- Viewing network interfaces
- Viewing Network Ports
- Network Device Information in NA
- Duplex Mismatch
- Network Reports
- NA and the SA Global Shell
- Inferred Physical Connections
- Device Groups and NA
Connections between network devices and servers
The NA/SA integration features are based on layer 2 connections and inferred layer 1 connections of the OSI Seven Layer Model.
OSI seven layer model
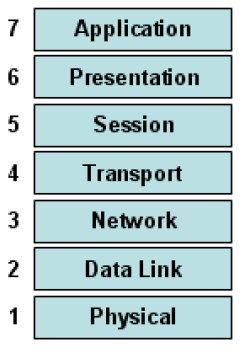
The NA/SA integration feature includes functionality that detects Data Link (layer 2) connections and reports on physical (layer 1) and data link connections. These data link connections include switches that are directly connected to a managed server and switches that are indirectly connected through other switches. These connections are discovered by correlating the MAC addresses reported by the device with the known MAC addresses for servers and switches.
The Physical connections are inferred from the Data Link connections (see Inferred physical connections. Physical connections represent direct connections (cables) between server and switches.
In the SA Client, you can see Physical connections in the Server Explorer, the Network Device Explorer and in detailed layout diagrams in Service Automation Visualizer (SAV). In the NA diagramming feature, you can see physical, data link or network (layer 3) connections.
Network device information in SA
In addition to basic hardware details about managed servers and network devices, the NA/SA integration feature also reports the following information about network interfaces and network ports:
- On the server side, network interfaces have the following properties:
- MAC address
- Subnet mask
- interface type
- IP address
- DHCP setting
- Connected switch port
- Speed
- Duplex (excluding Windows)
- On the network device side, network ports have the following properties:
- Port name
- Speed
- Duplex settings
- Devices connected
- Interface type.
Note For most devices, auto-negotiation works best when both sides of the connection (server and network device) are set to auto-negotiate mode. For example, a duplex policy could specify that a port should be set to full, half, or auto, and not to full (auto). A full (auto) duplex setting indicates that the port was set to auto-negotiate and it negotiated to full duplex.
The following tasks describe how you can access detailed hardware information for servers and network devices directly in SA. See Network device information in NA for instructions on how to access hardware information about network devices directly in NA.
Viewing network interfaces
To view hardware information about a server, including network interfaces:
- Log in to the SA Client.
- From the Navigation pane, select Devices All Managed Servers.
- From the View drop-down list, select Network.
- Double-click on a server in the Content pane to display hardware details in the Server Explorer (see the following figure ).
Hardware view in the Server Explorer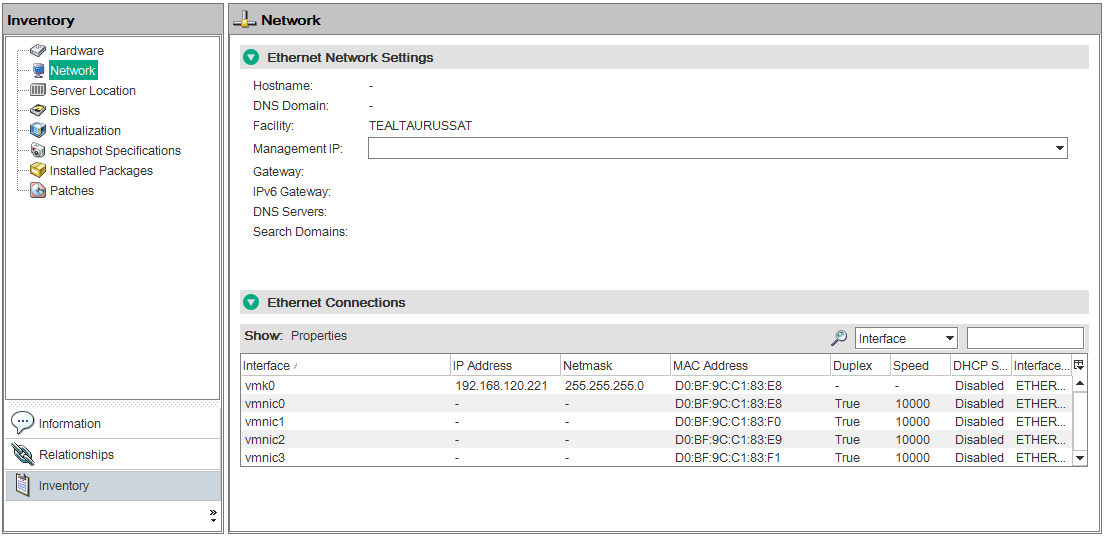
Viewing network ports
To view hardware information about a network device, including network ports:
- Log in to the SA Client.
- From the Navigation pane, select Devices > Device Groups > Public and then select a device group.
- Double-click on a network device in the Content pane to display the Network Device Explorer.
- In the Views pane, select Hardware to display information about the selected network device. See the following figure.
Hardware view in the Network Device Explorer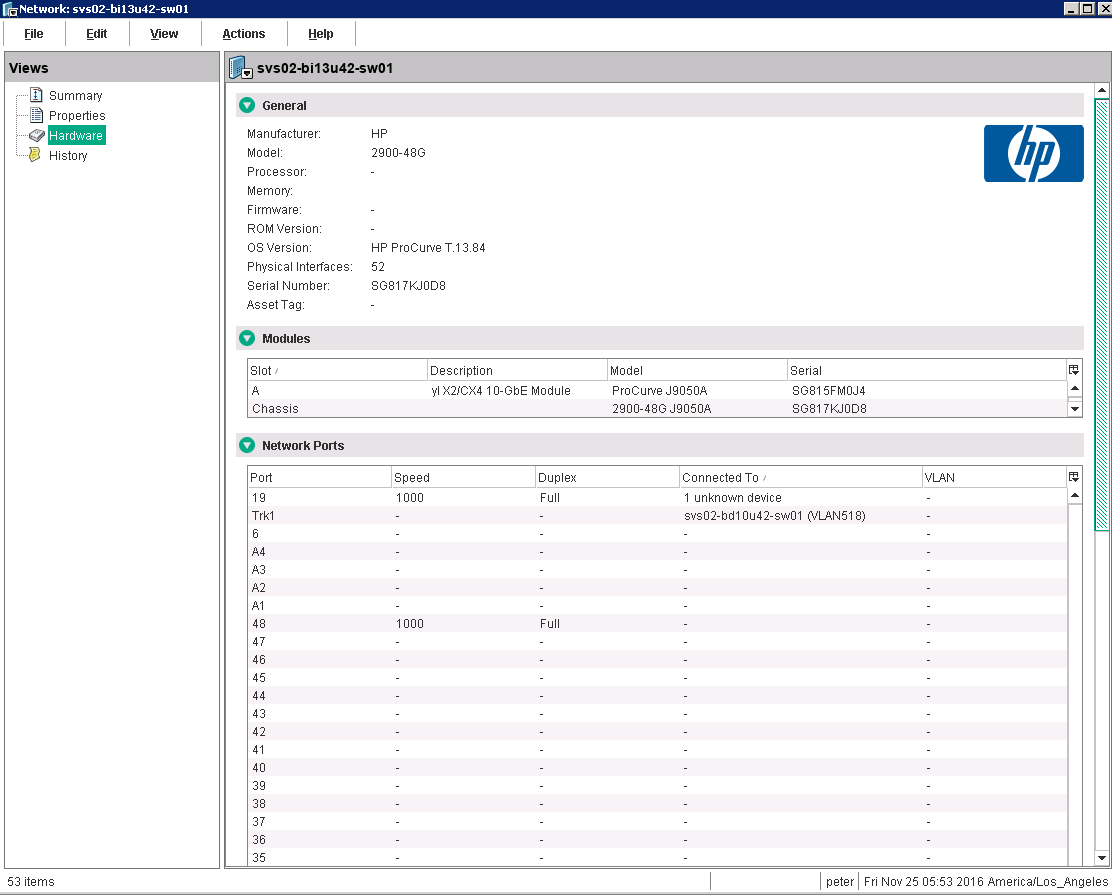
Network device information in NA
To help you with troubleshooting tasks that involve network devices in your environment, you can examine additional network device details and network device event history by logging directly in to NA. The NA/SA integration feature provides a login option to access detailed information about network devices and their event history as recorded in NA.
- From the Navigation pane, select Devices > Device Group > Public.
- In the Content pane, select a network device.
Network device details in NA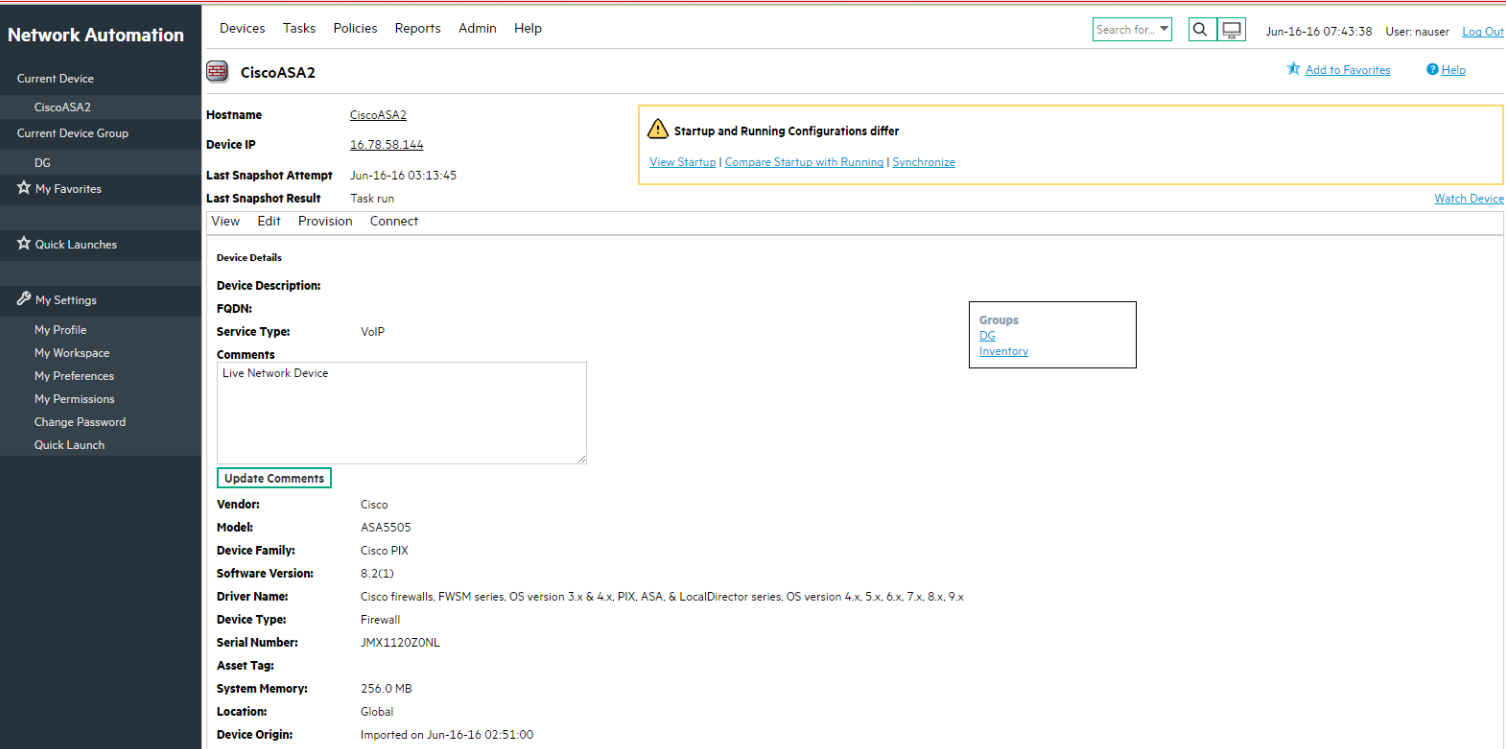
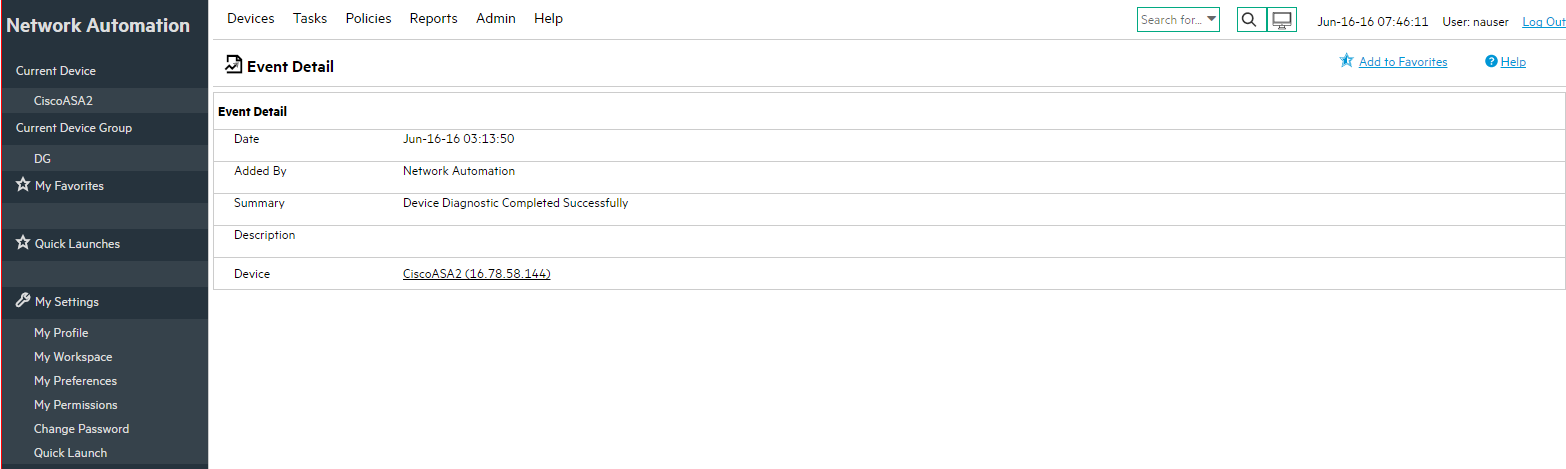
Viewing event history
In the Event Details window, click on the Device link to view additional information, such as timestamps for when the device was added, the last snapshot and the last configuration change.
Event details for a network device in NA
Duplex mismatch
The NA/SA integration feature provides automatic detection of duplex mismatches. A duplex mismatch is a configuration mismatch between the speed and duplex of a managed server and a connected network device.
For servers’ network interfaces, speed and duplex information is gathered during every hardware registration, which occurs every 24 hours.
Due to the lack of a device independent method of determining duplex for servers running a Windows operating system, the Server Agent for Windows does not report duplex settings out-of-the-box. A custom script can be added to the Server Agent to collect and report the speed and duplex setting for a certain network interface. For instructions on how to create and integrate the script with the Agent, contact your support representative.
Speed and duplex information for servers is not updated when you select View Refresh or press F5 in the SA Client. This data gets updated when the NA Duplex Data Gathering diagnostic runs. See NA duplex data gathering diagnostic.
For network devices, speed and duplex is gathered by the NA Duplex Data Gathering diagnostic, which runs according to a schedule that you define. To ensure that you have the latest speed and duplex information about network devices, it is recommended that you set up a recurring schedule that runs the diagnostic. See the SA
If the network interface information (speed and duplex) for a server does not match the network port information (speed and duplex) for a connected network device, the device is considered to be non-compliant.
In the NA/SA integration feature, you can see duplex mismatches identified at a top level by using the Dashboard. You can also see duplex mismatches identified by server and network device by using the Server Explorer and Network Device Explorer, respectively.
Viewing duplex mismatches in the dashboard
See the SA
Viewing duplex mismatches by server
To view duplex mismatches using the Server Explorer:
- From the Navigation pane, select Devices > All Managed Servers.
- In the Content pane, select a server.
- Double-click on the server to display the Server Explorer.
- In the Views pane, select Hardware.
- In the Network Interfaces section, review the Duplex column for detected mismatches. Mismatches are identified by an
 icon that precedes the duplex setting (Full, Half, Auto), in the Duplex column.
Viewing duplex mismatches by network device
To view duplex mismatches using the Network Device Explorer:
- From the Navigation pane, select Devices > Device Groups > Public.
- In the Content pane, select a network device.
- Double-click on the network device to display the Network Device Explorer.
- In the Views pane, select Hardware.
- In the Network Ports section, review the Duplex column for detected mismatches. Mismatches are identified by an icon that precedes the duplex setting (Full, Half, Auto), in the Duplex column.
Network reports
To help troubleshoot problems that involve physical connections and duplex compliance, you can run and examine network reports. By using the Reports feature in the SA Client, you can produce the following network reports that identify layer 1 connections between managed servers and network devices in your environment:
This report lists all physical connections to a selected network device.
This report lists all physical connections to a selected managed server.
Note See the SA
Network diagrams
You can use Service Automation Visualizer (SAV) functions in SA and the Diagramming feature in NA to create detailed diagrams that illustrate managed servers, network devices, and layer 2 and layer 1 connections in your environment. You can also export these network diagrams to .png, .png, and .svg files, annotate, and use them in other applications.
Launching HPE Server Automation Visualizer
To access SAV, perform the following steps:
- From the Navigation pane, select Devices > All Managed Servers.
- In the Content pane, select one or more servers.
- From the Tools menu, select HPE Server Automation Visualizer and then select one of the following options:
- Select New to open the SAV window.
- Select Open to open a previously saved topology.
- To create and export topology diagrams, see the procedures for using HPE Server Automation Visualizer in the SA
See the SA
NA and the SA Global Shell
You can use the SA Global File System (OGFS) to navigate between servers and connected network devices by tracing their physical connections in the /opsw/Servers/@ and /opsw/Network/@ directories in the OGFS.
You can also run three types of NA scripts in the OGFS:
- Command
- Advanced
- Diagnostic
These scripts correspond to the three directories in the OGFS under /opsw/Scripts/Network. See Network Directories in the SA
You can also write Bourne shell and Python scripts that can perform the following tasks when run in the OGFS:
- Find servers and network devices.
- Find all servers that are connected to a specified switch.
- Find servers with a duplex mismatch.
- Display the network interfaces of a specified server.
- Get the IP addresses of all devices.
- Compare two files to identify changes in a network device's configuration.
- Change device details, such as the
snmp-location.
To access the OGFS in the Global Shell feature:
- From the Tools menu, select Global Shell to launch a terminal window. See the SA
- To navigate between servers and connected network devices, use the guidelines described in the SA Global Shell and OGFS Directories sections in Use.
The rosh utility enables you to log in to devices (servers and network devices) and run native commands. You invoke rosh from within a Global Shell session. You can run rosh and enter native commands interactively, or you can specify the native commands as an option of rosh. For example, you can log in to a switch with rosh and run the show vlan command to view all VLAN details.
See the SA rosh utility.
Inferred physical connections
The NA/SA integration feature also includes functionality that detects and reports on inferred physical (layer 1) connections. These connections are inferred from data (such MAC addresses that are seen by switches), captured, and then added to the SA data model.
These physical connections (inferred layer 1 data) are based on heuristics. In the OSI model, each layer is an abstraction designed to hide the layer below. Therefore, the layer 2 data gathered from devices cannot generate 100% accurate layer 1 data. In particular, layer 1 data may be incorrect if any of the following conditions exist:
- The device does not return the port number where MAC addresses are seen.
- There was no traffic between the devices within a few minutes of when NA gathered the topology data (where MAC addresses are seen).
- There is an unmanaged device between two managed devices.
- There is a hub between two managed devices.
In the SA Client, you can see inferred layer 1 connections by navigating network device directories in Global Shell.
Device groups and NA
A device group helps you categorize your devices (servers and network devices) in ways that make sense for your organization. For example, you can group devices by customer, facility, usage, application, and so on, and then perform actions on all of the devices in the group.
In SA, a device group can contain managed servers and network devices, or only managed servers. In NA, a device group contains only network devices. You create and edit network device groups only in NA. See the SA rosh utility.
To monitor an application that is running on multiple servers and relies on multiple network devices in your environment, HPE recommends that you model it as a device group that contains all servers and network devices the application runs on. This enables you to troubleshoot the application by using SA.
When you associate a public device group in SA with a device group in NA, you will be able to monitor information about all servers and network devices that you are interested in. You associate device groups by using identical group names.
Associated device groups have the following requirements:
- The SA device group is public.
- The SA device group is static.
- The names of the associated NA and SA device groups are identical.
To associate device groups in SA and NA:
- From the Navigation pane, select Devices > Device Groups > Public.
- In the Content pane, select a device group.
- Right-click on the device group and then select Open to display the Device Group Explorer.
- From the View drop-down list, select Properties.
- Check the “Associate with a NA device group of the same name” check box to enable this functionality.
- From the File menu, select Save.