


Explore servers and device groups in the SA Client
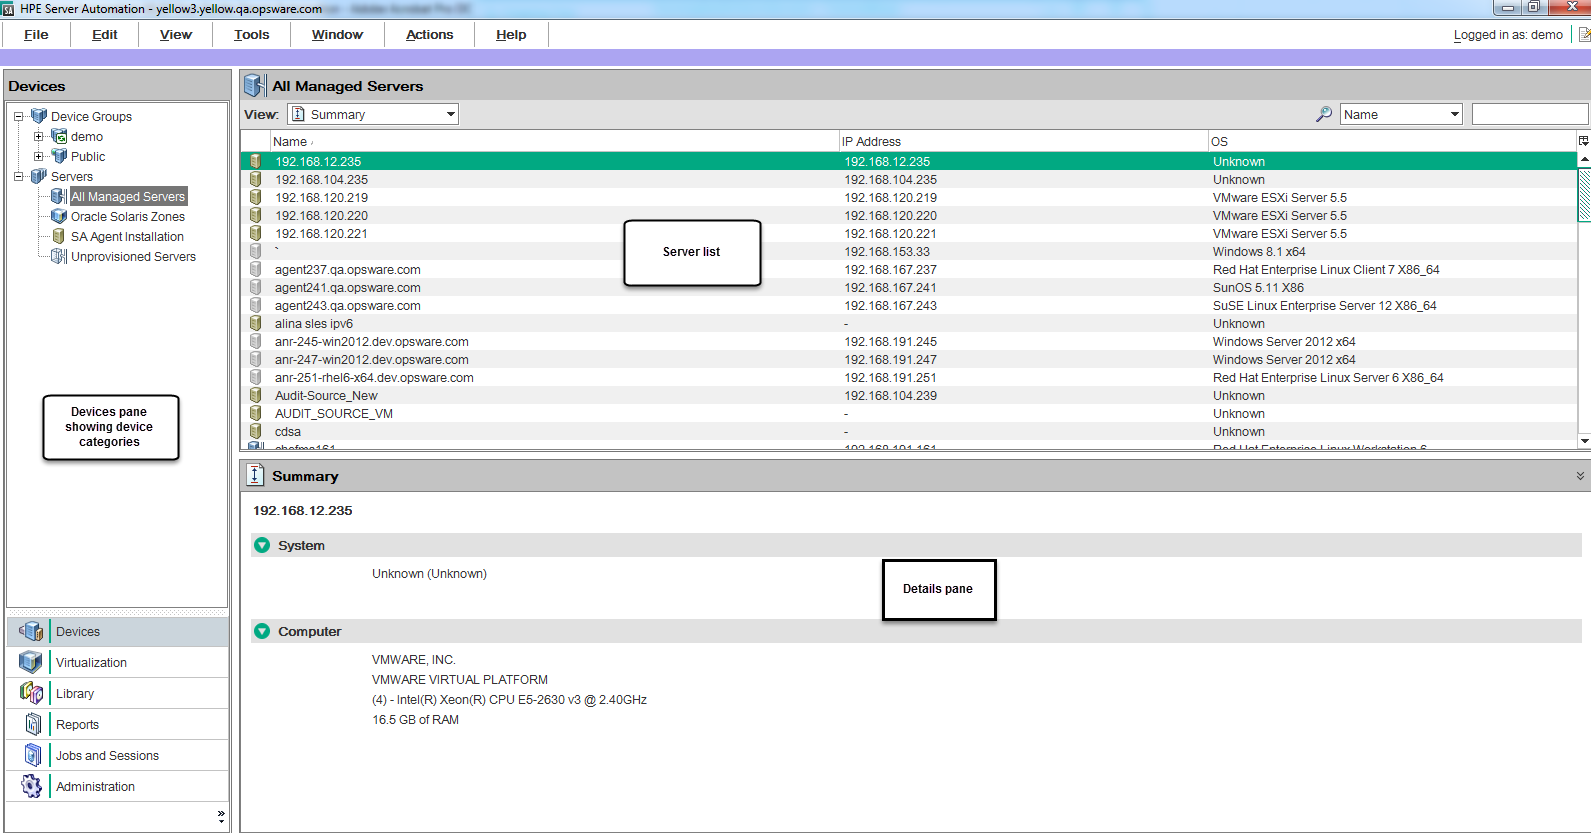
The SA Client allows you to view a list of all your servers in your data center, which can exist in various states of SA management. All your servers can be accessed from the Devices pane in the main SA Client interface, as shown in theServers in the Devices panel figure.
To visualize networking information with Network Automation (NA) inside of the SA Client, you must have both a licensed version of NA integrated with your SA core, plus an additional license for NA.
Server status icons
In the SA Client, you can determine the status of a server by the type of icon next to the server, as defined in the Server status iIcons in SA table. See the Server List in Servers in the Devices panel.
|
Server icon |
Description |
|---|---|
|
|
Planned Indicates that a device record has been created for the server, but an OS Build Agent has not yet been installed on it. Servers in this stage cannot be provisioned until the OS Build Agent is installed. In the SA Client, appears in the Unprovisioned Server list. |
|
|
Unprovisioned — Unreachable Indicates a server that has been registered with the core via the OS Build Agent, but has not reported as ready for provisioning recently. This may be due to networking problems between the server and the SA core or the server having been disconnected or powered off. In the SA Client, appears in the Unprovisioned Server list. |
|
|
Unprovisioned — Reachable Indicates a server that has been registered with the core via the OS Build Agent and is available to have a target OS installed on it. In the SA Client, appears in the Unprovisioned Server list. |
|
|
Provisioning — Unreachable Indicates a server on which the OS Provisioning feature was in the process of installing the target OS, but for some reason stopped because the server is unable to communicate with the SA core. In the SA Client, appears in the Unprovisioned Server list. |
|
|
Provisioning — Reachable Indicates a server on which the OS Provisioning feature is in the process of installing the target OS. In the SA Client, appears in the Unprovisioned Server list. |
|
|
Provisioning Failed — Unreachable Indicates an available server on which an error occurred while the OS Provisioning Subsystem was installing a target OS, and that the server is not able to communicate with the SA core. In the SA Client, appears in the Unprovisioned Server list. |
|
|
Provisioning Failed — Reachable Indicates an available server on which an error occurred while the OS Provisioning Subsystem was installing a target OS. In the SA Client, appears in the Unprovisioned Server list. |
|
|
Agent Managed — Reachable Indicates a server has a Server Agent is running on it and that it is able to communicate with the SA core. In the SA Client, appears in the All Managed Servers list, Virtualization tab, and Oracle Solaris Zones. |
|
|
Agent Managed — Unreachable Indicates a managed server cannot communicate with the SA core (it is Not Reachable). If you want to discover reasons why the managed server is unreachable, you can run a Communication Test. See Run server communication tests for more information. In the SA Client, appears in the All Managed Servers list, Virtualization tab, and Oracle Solaris Zones. |
|
|
Agentless Indicates the server does not have a Server Agent installed on it. For virtual servers, this means that someone created a virtual machine (VM) outside of SA so it does not have a Server Agent installed on it. For virtual servers, this state could also mean that the VM has not yet been provisioned, or that your user belongs to a group that does not have permissions to perform operations on this virtual server. For more information on installing a Server Agent on an unmanaged server, see Manage the Server Agent. |
|
|
Deactivated Indicates a server that was deactivated in Server Automation by deactivating its SA Agent so that it is currently not managed and is no longer reachable. Appears in the Manage Servers list and in the server lists in the SA wizards (however, it is not selectable in the wizards). |
|
|
Scheduled Indicates a server that is scheduled for an operation (install software, uninstall software, and so forth). In the SA Client, appears in the Job Logs list. |
|
|
Error Indicates a managed server on which an error occurred while Server Automation was installing or uninstalling software. |
|
|
Warning Indicates a managed server on which a warning occurred while Server Automation was installing or uninstalling software. |
|
|
Application Configuration Out of Sync Indicates a managed server on which the configuration file on the server is out of sync with the Application Configuration Template (SA model). Appears only in the Application Configuration feature and the server list in the SA Client. |


Device group status icons
Device groups let you gather servers into logical sets to make performing actions on groups of servers easier and more efficient. The following table shows the icons displayed for device groups. See About device groups for more information.
|
Device group icon |
Description |
|---|---|
|
|
Static Device Group Indicates a static server group. The same states that apply to single servers apply to groups. See About device groups for more information about the different types of server groups. |
|
|
Dynamic Device Group Indicates a dynamic server group. The same states that apply to single servers apply to groups. |
|
|
Public Static Device Group Indicates a public and static server group. The same states that apply to single servers apply to groups. |
|
|
Public Dynamic Device Group Indicates a public and dynamic server group. The same states that apply to single servers apply to groups. |


VM template status icons
The following table shows the icons displayed for virtual machine (VM) templates. VM templates are only visible and manageable from the Virtualization tab of the SA Client. For complete details, see Virtualization management.
|
VM template icon |
Description |
|---|---|
|
|
Agent-Managed VM Template This template includes the SA agent. When you deploy a VM from this type of VM template, the resulting VM will be agent-managed. As a best practice, always use agent-managed VM templates and agent-managed VMs. |
|
|
Agentless VM Template This template does not include the SA agent. When you deploy a VM from this type of VM template, the resulting VM will not be agent-managed. |


Running server communication tests
You can run a set of communication tests to assess the connection between the SA core and your managed servers.
Ways to use the Device Explorer
The Device Explorer allows you to browse and manage servers, devices (such as network), and groups of servers in your environment.
Using the Device Explorer you can perform the following actions on individual servers:
- Browse basic device system information, such as device, operating system, memory, Server Agent version, and more.
- View device compliance information and view the details of any policies attached to the server, such as all audits, patch policies, software policies, as well as any application configurations attached to the server.
- Run audits of the server, remediate any software policies attached to the server, and push application configurations on to a server.
- Browse live and up to date information about a server’s file system, registry, hardware inventory, hardware, ethernet and SAN connections, installed software and patch lists, runtime state, user and user group membership, services, snapshots, and more
- View server group membership.
- View virtual server hypervisors and virtual machines (VMware, Solaris, and Microsoft Hyper-V).
- Add and delete custom attributes.
Note
Some Device Explorer features are not available for VMware ESXi servers because SA does not install a Server Agent on ESXi servers. For more information on ESXi servers, see see Virtualization management. For more information on Server Agents, see Manage the Server Agent.
Network devices in the Device Explorer
For more information on the types of information you can view in the Device Explorer for network devices, see the SA
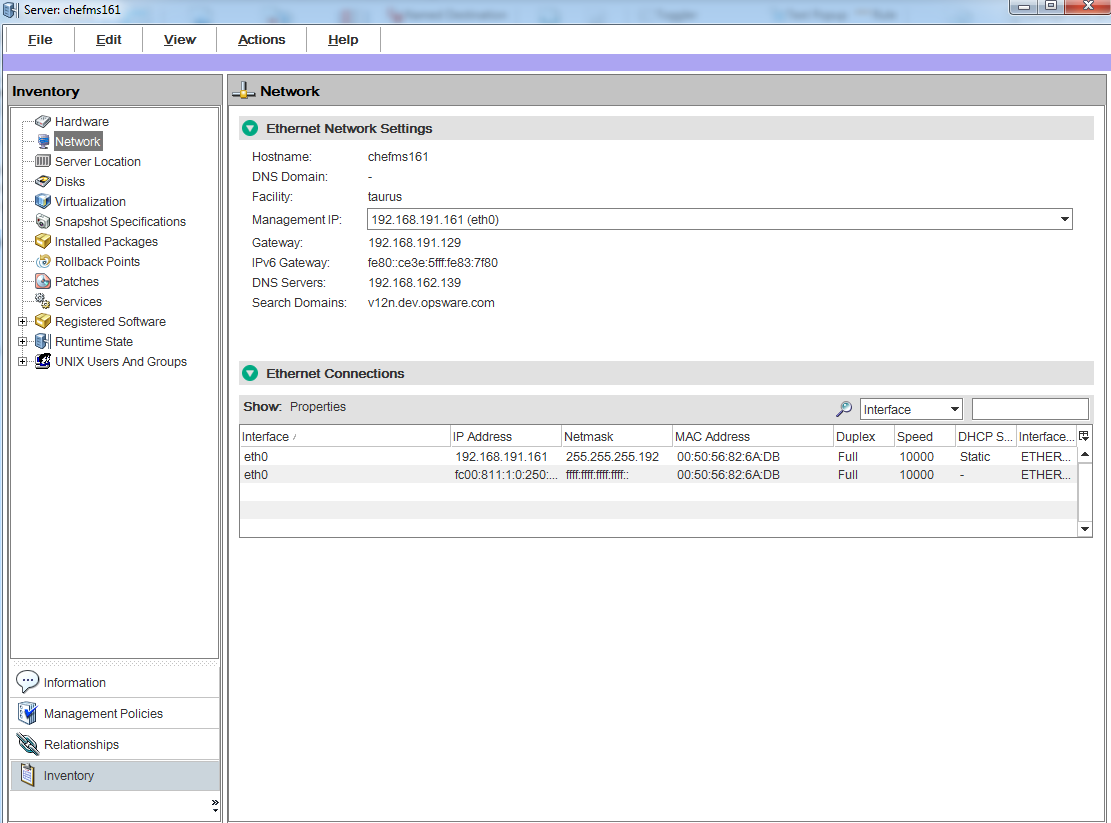
Device Explorer interface
The Device Explorer consists of two main sections: the Views pane and the Content pane. The Views pane lists server objects from the managed server, and the Content pane displays content for each of the server’s objects. When you select a server object in the Views pane, its corresponding content appears in the Content pane. See the following figure.
The Device Explorer Views tabs organize four different types of information about your device:
- About servers: Shows general property and system information, such as computer manufacturer, hardware type, system, processor and memory, OS version, Server Agent version and status (for those managed servers that have a Server Agent installed), SA customer assignment, history of changes to the server, and more.
- Server management policies: Displays a roll up of all compliance policies attached to the server, as well as compliance for individual compliance policies, such as audits, software and patch policies, application configurations, and any custom user-create policies. It also shows any custom attributes created on the server.
- Relationships with other devices: Shows all groups that the selected server is a member of and allows you to modify group membership (if your user has sufficient permissions).
- Inventory of server information: Displays a list of live server configuration objects and server modules captured directly from the server, such as registered hardware, network connections, snapshots taken of the server, installed packages, patches, discovered software, runtime information about processes running on a server, local security settings, users and groups memberships, and so on.
To access the Device Explorer:
- Launch the SA Client and then from the Navigation pane, select Devices > All Managed Servers.
- A list of servers will display in the Content pane.
If the list of servers is long, use the filter tool to locate a server (upper right corner) by name, IP address, OS, customer, facility, or description. If you filter by user name, the text entry is case insensitive.
You can also sort the list by clicking a column heading, such as name, IP address, OS, customer, and so on. To reverse sort, click the column heading a second time. - Open a server from the Content pane. This opens the Device Explorer. From the Actions menu, you can perform many types of operations, such as:
- Open in Service Automation Visualizer (SAV) if your core is licensed to run SAV
- Run a script on the server
- Create or run an audit or snapshot of the server
- Scan software, application configuration, or patch compliance
- Add to a device group
- Export patch information to a .csv file, and so on.
Action menu items change according to the server object selected.
For example, if you select the Configured Applications object from the server object tree, then from the Actions menu, you can add, remove, or open an application configuration, create a package, and so on.
Note
For VMware ESXi servers, some actions are not available because the SA Server Agent is not deployed on VMware ESXi servers. For more information on ESXi servers, see "Virtualization management" in Use. For more information on Server Agents, see Manage the Server Agent.
To open a remote terminal and log in to any managed server:
- From the SA Client Navigation pane, select Devices > All Managed Servers.
- Select a managed server.
- Select the Actions menu or right click and select Open With > Remote Terminal.
- Log in to the remote server.
See also the Server status icons.