


Jobs screen
The following topics are discussed in this section:
Jobs screen
The Jobs screen enables you to view a cumulative log of Application Deployment jobs. The following figure shows the right panel of the Jobs screen.

The Job Logs section contains a list of all the Application Deployment jobs that match the filter criteria that you specify. You can filter based on a certain time window, job status, job type, or a specific Job ID.
If you selected “Show job status when deployment starts” when you started a Deployment job, the Job Logs automatically gets filtered to show only your job. The following box appears at the top of the Job Logs area:

You can clear this filter by selecting the “Clear Search” button ![]() located at the top.
located at the top.
When you select a row in the Job Logs section, the steps for that job are shown in the lower section. In the example shown here, note the following.
- None of the steps have a check mark
 indicating that they were successfully completed.
 - Steps 1 and 2 have failed:

- Steps 3 and 8-13 are still scheduled:

- Steps 4 through 7 will be skipped:

If a single step in a Deployment job fails, the entire job is automatically rolled back, and the target servers are returned to the state they were in just prior to the deployment.
An automatic Rollback job is always created. If there is nothing to roll back, the job will have no steps, and its description will indicate why.
|
Icon |
Status |
Meaning |
|---|---|---|
|
|
Succeeded |
The step or job has completed successfully. |
|
|
Failed |
The step or job has failed. |
|
|
Scheduled |
The step or job is scheduled to run. |
|
|
Skip |
This step will be skipped, because either the component or server to which it pertains was not selected in the debugger. See Debug a deployment job. |
|
|
Skipped |
This step was already skipped, because either the component or server to which it pertains was not selected in the debugger. See Debug a deployment job. |
|
|
In Progress |
The step or job is currently running. For a job with numerous steps, a green progress bar is displayed in the Status column as the steps are being executed. |
|
|
Attention Required |
The job has failed, and it is now in a suspended state to facilitate debugging. See Debug a deployment job. |
|
Paused |
The job has been paused. |
|
|
Paused (pending) |
The “Pause” button has been pressed, but the job has not yet paused. The steps that are currently executing must finish before the job can be paused. |
|
|
|
Cancelled |
The job has been cancelled. |
|
Cancelled (pending) |
The “Cancel” button has been pressed, but the job has not yet been cancelled. The steps that are currently executing must finish before the job can be cancelled. |
If Application Deployment (the “da” component of SA) is stopped and then restarted while a job is In Progress, it carefully examines the status of each job step to determine the status of the job. If all job steps have successfully completed, the job status is set to Succeeded. If any job step is In Progress, that step will be marked Failed, an error will be logged to that step’s output, and the job will also be marked Failed.
By default, the first In Progress step of the job selected in the Job Logs table is highlighted. When that step finishes and a new step starts, the highlight moves to the new step. If you want to prevent the highlight from moving, you can use the “Scroll Lock” ![]() button.
button.
To view more information about a job, double-click the row corresponding to that job in the Job Logs table. A new window opens, as shown here:
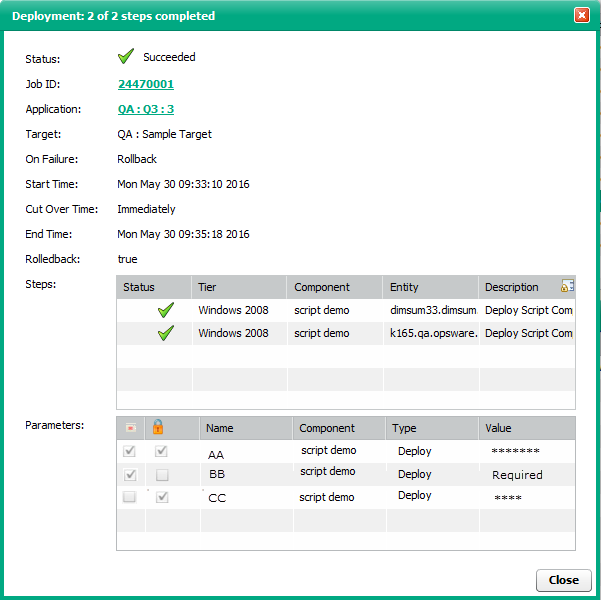
If you double-click a row in the Steps table, you can view more detail about how that step transpired. In the following example, the details for step 4 are shown.
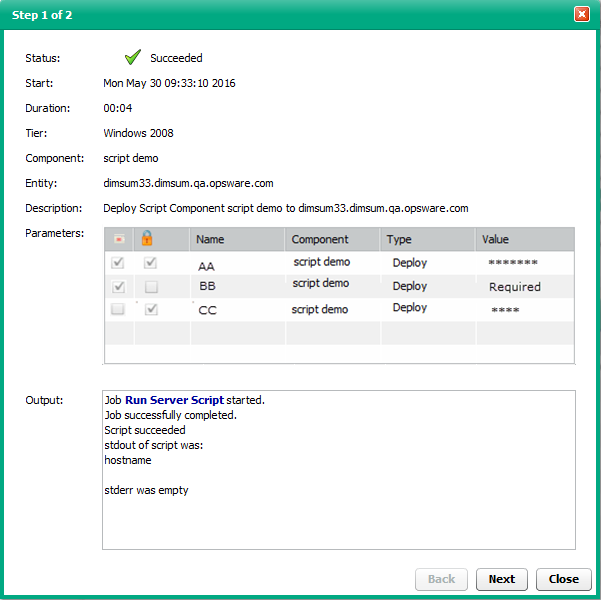
In this simple example, a Script component called “script demo” echoes the value of each of its three parameters to stdout. As shown in the Output box, the values of the four parameters were echoed to stdout, and the script successfully completed.
In the Step detail window, any text that appears in the Output box in a bold, blue font is a link to more detailed information presented in an SA “Deploy Application” job window. In the following example, the Run Server Script link was clicked.
Deploy Application Job window
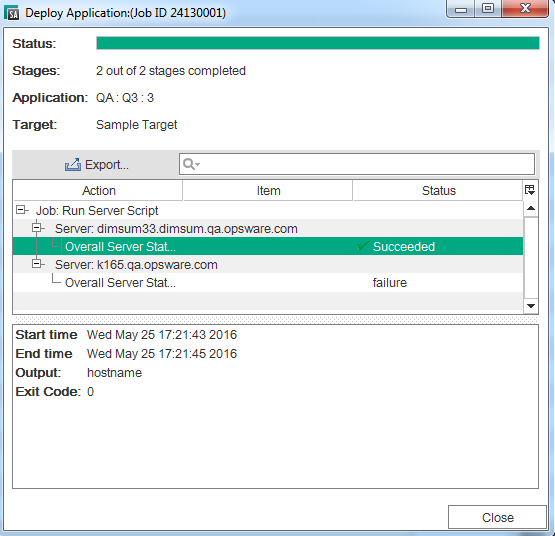
The information in this window is organized by server, and each server in the target is listed. Each “Overall Server Status” row corresponds to a single step that was performed on a particular server in the original Application Deployment job. Click one of these rows to view detailed information about the execution of that step on a specific server.
You can also open this window by clicking the Job ID in the Application Deployment Job detail window.
Blocked jobs
If Require Approval is selected for a particular type of job (on the Job Blocking page on the Administration tab in the SA Client), Application Deployment will display a message that the job is blocked pending approval.
A blocked job that is pending approval must be approved or cancelled on the Jobs and Sessions tab in the SA client. It cannot be cancelled from the Application Deployment Jobs screen.
If a blocked job is cancelled in the SA client, the Application Deployment Jobs screen will indicate that this job has failed.
For more information, see the Job Approval Integration section in Developer .