SAV user interface
The SAV user interface shows a business application and all its related processes, connections, and devices. It does so by providing the following user interface elements:
- Maps that display the physical and logical and virtual layouts of applications — see SAV maps.
- Trees that display the physical and logical layouts of applications — see Tiers tree and Devices tree.
- Properties panes that provide granular information about a selected object, signature, process, or connection — see SAV properties.
- Detailed tables for comparison of objects — see Compare snapshots.
- Dynamic tool bars and detailed tooltips to provide more information about tree and map objects.
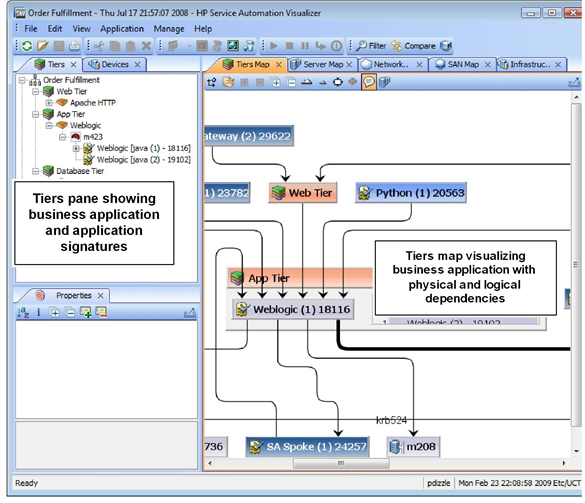
The following figure shows the types of information that the SAV displays.