


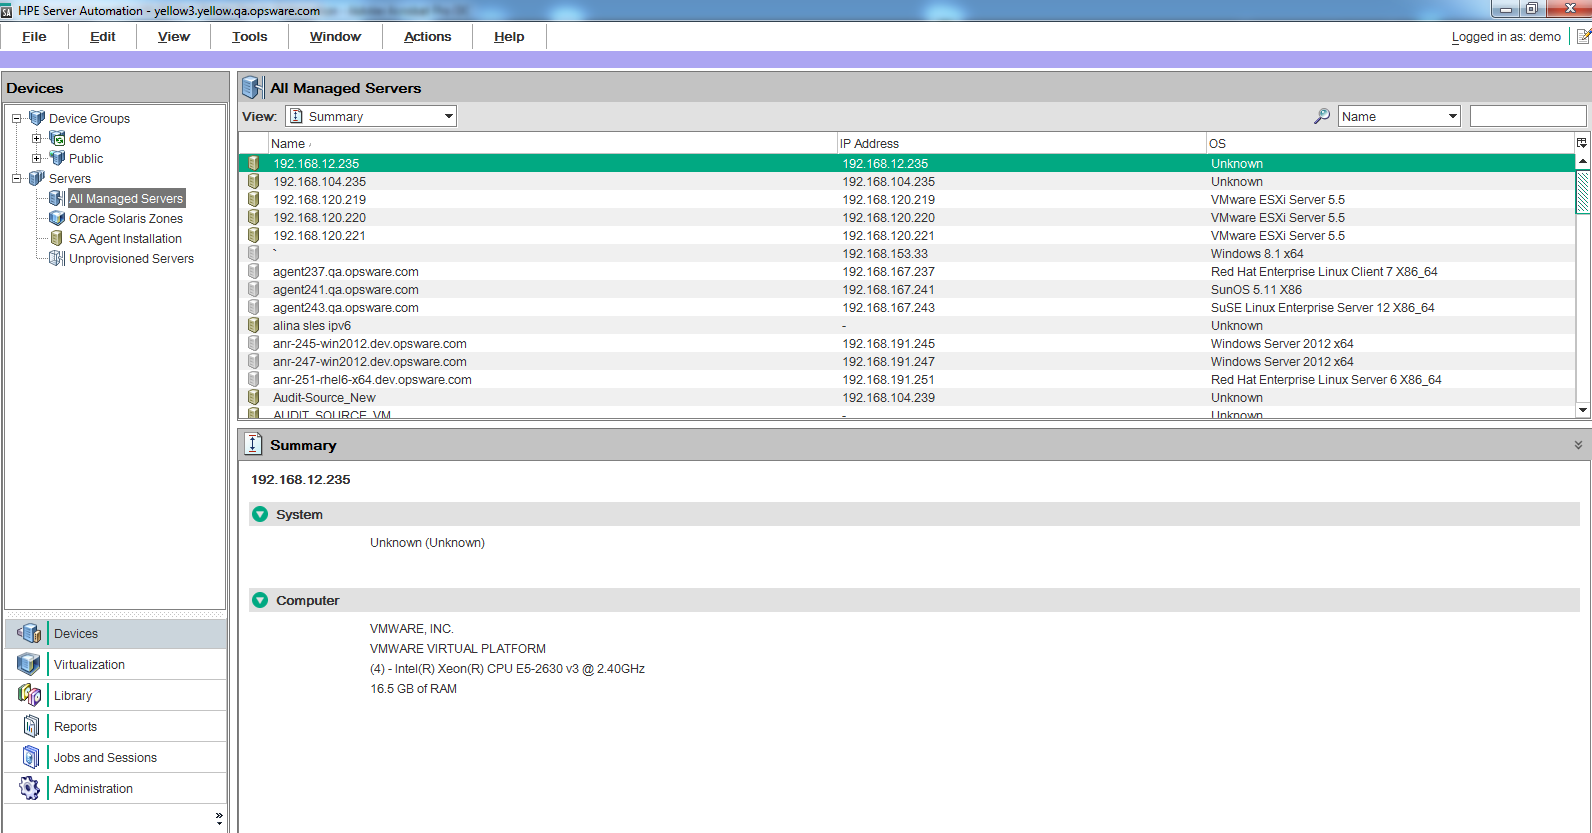
SA Client user interface
The SA Client user interface has six main areas as shown in the following figure.
Menus
The SA Client includes the following menus:
- File: This enables you to open a new SA Client window, or close the current window, or exit all open SA Client windows.
- Edit: This enables you to cut, copy, paste, delete text, and copy SA Client URLs.
- View: This refreshes the current view and shows the latest information from the core that you are currently logged into (such as compliance test information for the compliance dashboard). You can also access SA Client features in the Navigation pane, such as Devices (groups of devices, managed and unmanaged servers), Reports (Compliance Dashboard, Reports) Software Library (application configuration, patch management), Jobs and Sessions (job logs and shell sessions), and Administration (patch settings and patch compliance rules). This also allows you to show or hide the Search pane and the Details pane.
- Tools: This enables you to open a Global Shell session, open the Service Automation Visualizer, or access the SA Client options.
- Window: This enables you to access multiple instances of SA Client windows, if more than one window is open.
- Actions: Depending on the feature that you have selected in the Navigation pane, this menu enables you to perform numerous functions related to all main SA Client features.
- Help: This menu provides help for the SA Client. Help F1 provides context-sensitive help relevant to the current feature window selected or opened (same as pressing the F1 key). The contents and index will open the SA Client help system to the main table of contents. (Select About HPE Server Automation to see version and system information.)
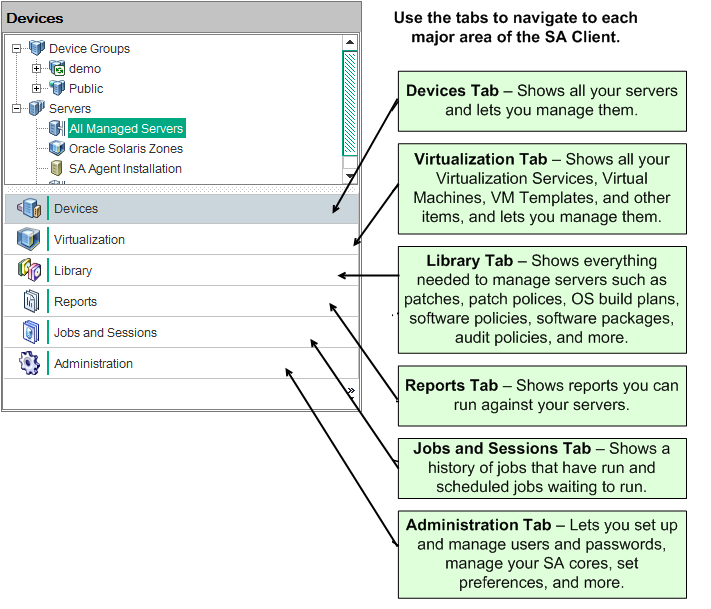
Navigation pane
The Navigation pane shown in the following figure shows the tabs in the SA Client navigation pane. Each tab gives you access to one of the major areas of the SA Client. When you select an object, its contents appear in the top of the navigation pane and in the content pane. You can perform tasks related to the object with the right click menu and the Actions menu.
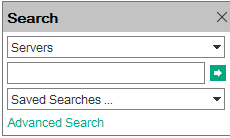
Search pane
The Search pane allows you to search for any information in Server Automation, such as servers, device groups, folders in the SA library, jobs, software and software policies, patches and patch policies, application configurations, database audits, and snapshot results.
You can show or hide the Search pane by selecting the View > Search Pane menu item.
For more information on how to use the search tool, see Search for objects with the SA Client.
Search in the SA Client
Content pane
Depending on the selection in the Navigation pane – Devices, Virtualization, Library, Reports, Jobs and Sessions, Administration – the Content pane lists the following information:
- All managed servers and device groups, including agentless servers — both physical and virtual
- Virtualization Services and the virtualization inventory under them
- Agent installation information
- Application Configurations and configuration templates
- Software Policies
- Audit and Remediation audits, audit policies, and snapshots
- Patches and patch policies
- OS Build Plans
- Packages
- Reports and the Compliance Dashboard
- Custom attributes
- Jobs that the user has run
- Access to the Global Shell sessions
- Patch configuration and patch compliance rules
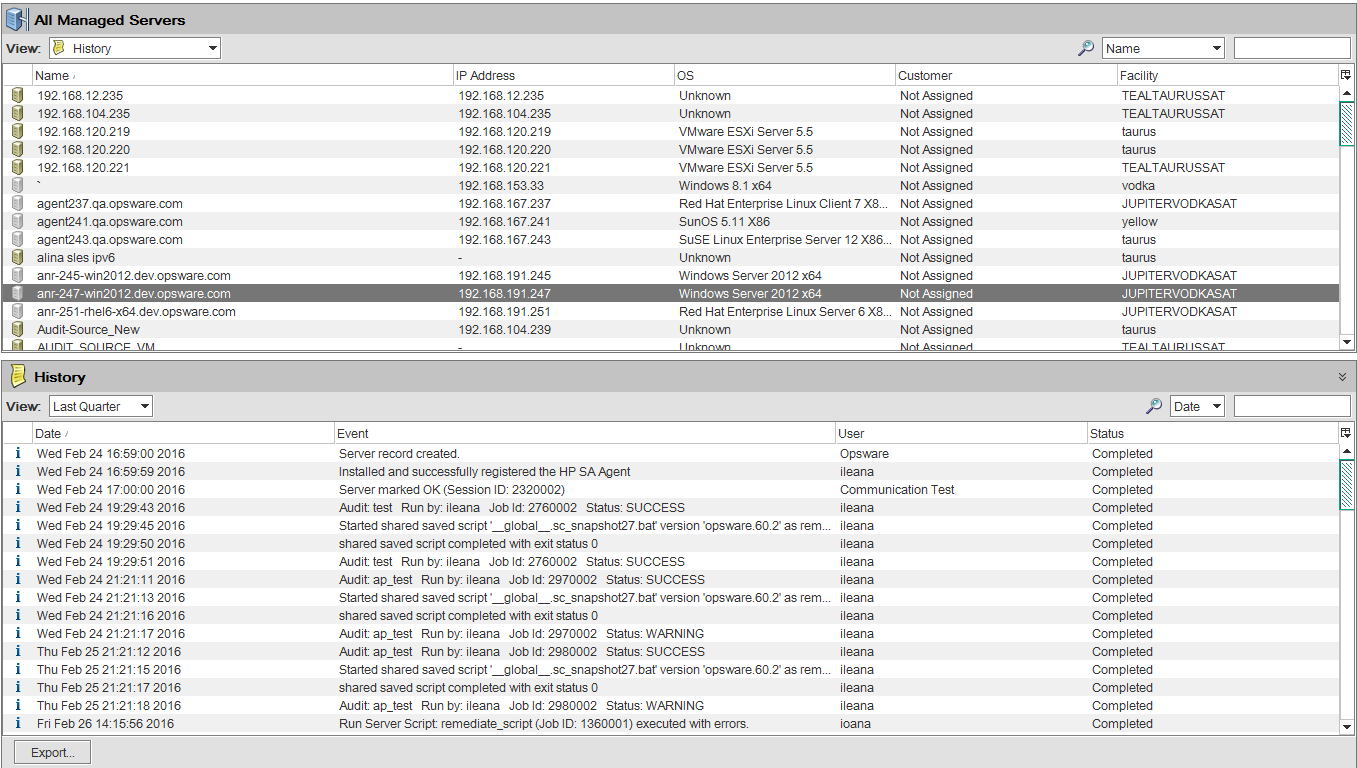
The following figure is an example of the Content pane for managed servers. You can perform actions on features in the Content area using the Action Menu, or you can right-click to perform various actions or double-click to open.
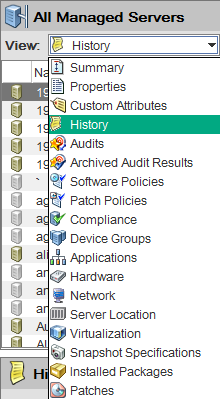
Content pane showing the Server History view
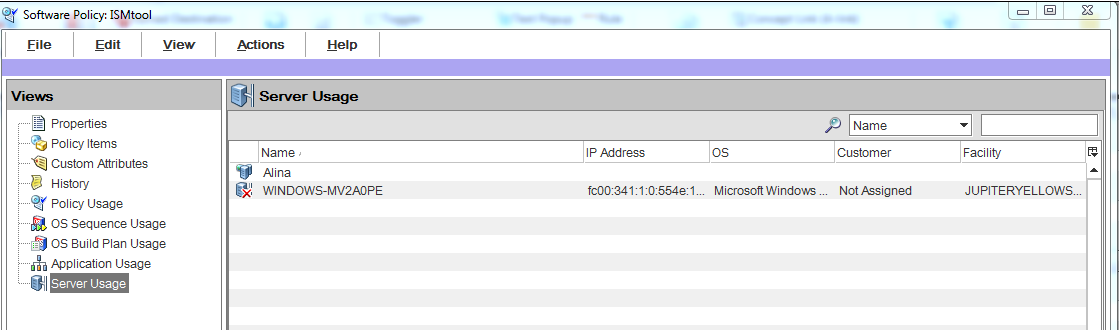
With the View drop-down list in the SA Client content pane, you can change the view of a selected feature. For example, you can select a server from the Content pane, and then from the View drop-down list, choose Software Policies. This shows all software policies attached to the server, as shown in the following figure.
You can click the column headings of the Content pane to sort data about a server. For example, for a managed server, you can sort by Hostname, IP address, Summary, OS, and so on. You can sort by additional columns by pressing the Ctrl key on the keyboard while clicking another column.
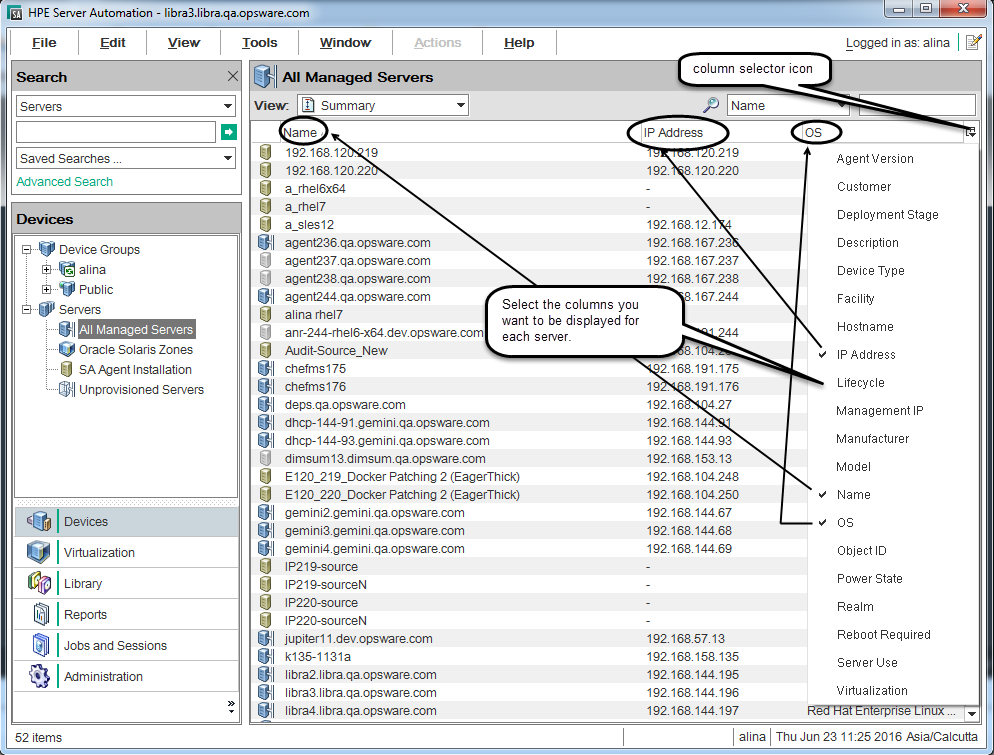
You can display more columns of information about the selected server by clicking the column selector and choosing the columns you want to display or hide, as shown in the following figure.
Column selector - Columns displayed for each server
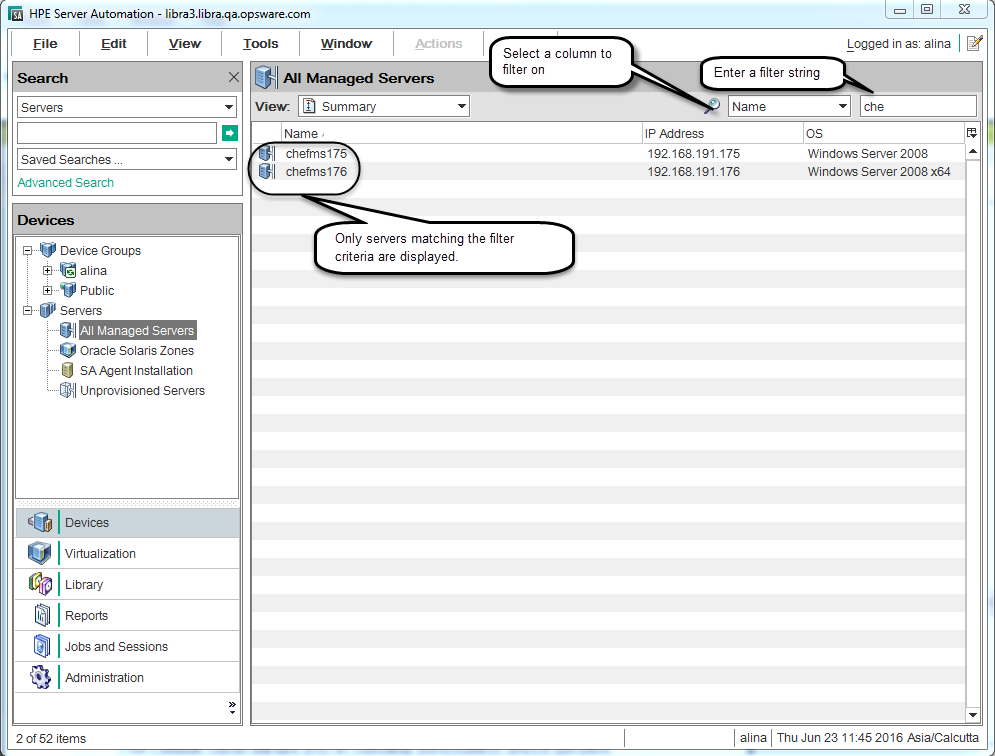
Filter tool in the Content pane
With the SA Client filter tool, you can filter the information shown on the content pane by filtering on a single column with a substring search, as shown in following figure.
Details pane
The Details pane allows you to preview information about servers, device groups, patches, and patch policies selected in the Content pane without having to open a new window.
You can use the Details pane to perform the following actions:
- Preview information about a server, device group, patch, or patch policy. To do so, select it in the Content pane.
- Select the type of information you view in the Details pane. From the top of the content area, choose a view from the View drop-down list.
- Deactivate the Details pane. To do so, from the View menu, select Details PaneMinimize.
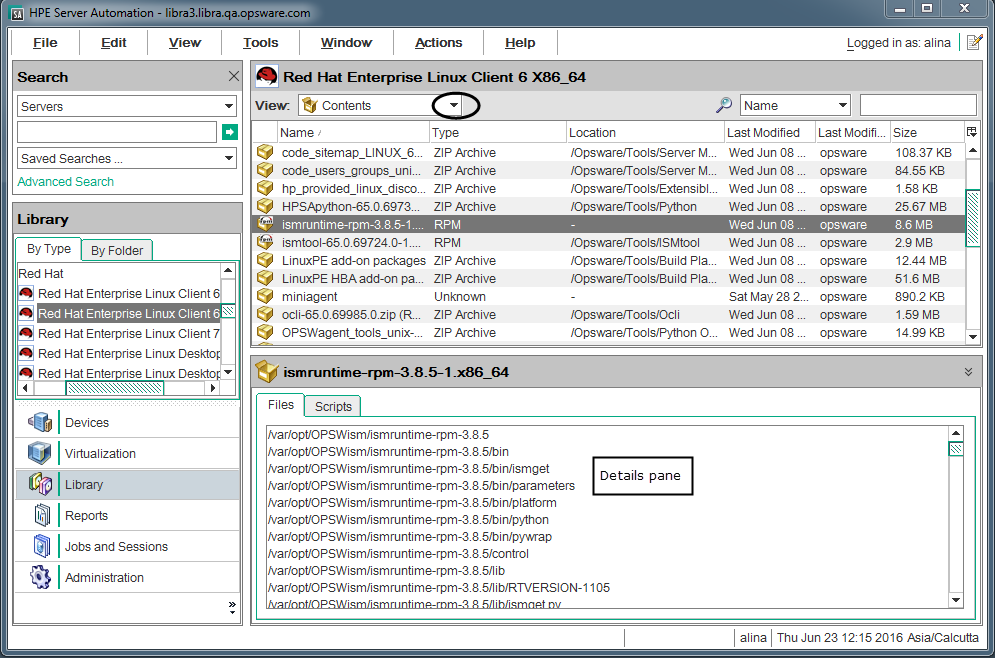
For example, if you are viewing Windows 2003 patches from the Library, you can select a patch in the Content pane and see information about the patch in the Details pane. This is shown in the SA Client showing package Contents view in the Details pane figure.
SA Client showing package Contents view in the Details pane
To view other types of information about the selected patch, from the View drop-down list, choose a view.
Some features displayed in the Details pane allow you to further filter the feature. Using the Show drop-down list, you can choose different views of the feature.
For example, if you are viewing all of the servers that the patch policy is attached to, in the Details pane, you can filter either Servers with Policies Attached or Servers with Policies Not Attached, as shown in the following figure.
Details pane show drop-down list
Status bar
At the bottom of the SA Client window, the status bar provides the following information:
- Information about the selected object
- A progress bar that shows progress on retrieving information from the core
- Your user ID
- The current time
SA Client Status bar
