Browse job logs
To view information about jobs that have run, select the Jobs and Sessions tab in the SA Client. This displays jobs that have run as well as jobs scheduled to run in the future.
A job is any major process run by the SA Client, such as Audit Servers, Create Snapshot, Create Virtual Zone, Deploy Application, Install Software, Push Configurations, Run Communication Test, Scan Configuration Compliance, Uninstall Patch, and so on.
The Job Logs window shows all jobs that the user is configured to see, based on his permissions. It also displays jobs scheduled to run, including the job ID, the job type, the start and end times, the number of servers and groups affected by the job, the status of the job, the ticket ID, and the user name of the person who ran the job.
If the job status is Pending Approval, then the job is blocked until it is approved by a process that is external to Server Automation. If jobs are blocked indefinitely, the SA Administrator should check the settings of the Approval Integration window or the configuration of the backend connector.
The format of the Start Time and End Time for a job is determined by the original user preferences set in the SA Client. These preference may be different than those of the current user.
Tip If you are working in multiple time zones, make sure the preferences for Start Time and End Time are set to include the time zone in the date display.
To see the details of a finished job or recurring (scheduled to be run) job, open the job.You will only be able to modify a scheduled job if you created the job or have Edit or Cancel Any Job permissions. To obtain these permissions, contact your SA Administrator. See the SA
To view a job, select it, right-click, and select Open.
To cancel a non-recurring job, from the Job Logs window, right-click the job and select End Job. You cannot cancel a job while it is running (that is, when the job status is In Progress).
To cancel a recurring (scheduled) job, from the Recurring Schedules window, right-click the job and select Delete Schedule.
Note
In order to view a job in the SA Client, you must have permissions to run or execute the feature action. For example, if you wanted to view Application Configuration Push jobs in the SA Client and you had the Manage Application Configurations permission set to Read, but not Write, you would not be able to see any Application Configuration Push jobs in the SA Client.
At the top of the Job Logs window, you can filter jobs by specifying the following criteria:
- Job Time Frame: Enables you to limit the search for a job by a time restriction, such as jobs run anytime, in the last 24 hours, last week, last month, last quarter, and so on. Or, for scheduled jobs, you can filter the jobs list by those jobs scheduled to run in the next 24 hours, next week, and so on.
- Job Status: Enables you to search based on the status of a job, such as Succeeded
 , Warning
  , Failed
  , Pending Approval, Cancelled, and so on.
 - Job Type: Enables you to search for jobs by type, such as Audit Servers, Modify Virtual Zone, Reboot Server, Remediate Policies, Run OGFS Script, and so on. These are jobs that have already run or are scheduled to run.
- Job ID: Enables you to search by the job ID.
- Ticket ID: Enables you to search by the ticket ID, if one was given for the job.
- User: Enables you to enter a username to see only those jobs a certain user has run. Only users with the View All Jobs or Edit or Cancel Any Job permissions will be able to view jobs in the core. If you do not have these permissions, this filter will not appear.
You must click Search to update the list based on the current filter settings.
After setting the filter criteria, click the Search button to filter the job table.
To perform an advanced search, click drop-down list on the Search button and select Advanced Search. For more information, see Perform an advanced search or Search for objects with the SA Client.
This section also provides information about the following topics:
- Recurring job schedules
- Viewing and deleting recurring job schedules
- Job notification emails
- Finding information in job results
- Combined device history log
Recurring job schedules
The recurring schedules window shows all jobs that are scheduled to run on a recurring basis. You can choose to view all recurring jobs or filter the list of recurring jobs by specifying the following criteria:
- Job Status: Enables you to search for scheduled jobs by their status, such as Any Status, jobs that have been Cancelled, jobs that are Pending Approval, or all jobs that are Recurring.
- Job Type: Enables you to search scheduled jobs by their job type, such as Audit Servers, Create Snapshot, Push Configurations, and so on.
- Job ID: Enables you to search for recurring jobs by their job ID.
- Ticket ID: Enables you to search by the ticket ID, if one was given for the job.
-
User: Enables you to enter a username to see only those jobs that a certain user has scheduled to run on a recurring basis. If a user is not specified, all recurring jobs will display.
Note
Only users with View All Jobs or Edit or Cancel Any Job permissions will be able to view all jobs in the core. If you do not have these permissions, you will not be able to see all jobs.
- Search: Enables you to perform a search query of scheduled recurring jobs. Click Search to display the detailed results.
Viewing and deleting recurring job schedules
To view a recurring job schedule, select it, right-click, and select Open.
To delete a recurring job, select it, right-click, and select Delete Schedule.
Job notification emails
If a job was configured to send an email notification to a recipient when the job has finished, either on success, failure, or both, the email provides the following information:
- Job Information: Provides data about the job, such as the Job ID, Status, and start and end time.
- Job Type Information: Provides data relevant to the specific job type that was run. For example, if the job run was an Audit, the job notification email will provide information, such as Audit task ID and audit results ID.
- Job Results URL: The job results URL launches the specific job type window. For example, if the job was an audit, the job type URL launches the audit results window. Other information in the notification email provides job results details, such as number of differences found in the audit results, source and target server information, and so on.
Finding information in job results
To easily find key information in the Jobs and Sessions tab, you can filter, group, sort, search for, and highlight information in detailed job results.
- Filtering the display
- Grouping and ungrouping columns
- Expanding and collapsing information in columns
- Resizing columns
- Sorting columns
- Finding and highlighting
Filtering enables you to control what displays in the Jobs and Sessions tab. You can narrow or expand the detailed job results. In the Jobs and Sessions tab, in the filter box, click on the filter menu to display a list of filtering criteria. The filter menu options display in the following 5 sections:
- The first section is a list of the column names you can select to filter on. Depending on the Job type, the column names will vary. Select a column heading that you want to filter:
- All
- Item
Status
Only the following job types are filterable:
- Audit Servers
- Create Snapshot
- Deploy Application
- Install Software
- Push Configurations
- Remediate Audit Results
- Remediate Policies
- Reboot Server
- Restore Configurations
- Rollback Application
- Undeploy Application
- Uninstall Software
- The next section is a list that specifies whether you want to filter with case sensitivity on or off:
- Case sensitive
- Case insensitive
- This section specifies whether you want to filter using wildcards:
Use wildcards
If you enable wildcards, enter a string, using different wildcards, in the filter box. A wildcard is any character, including alpha, numeric, and special characters.
- + — The plus sign wildcard can be substituted for one or more of any character.
- * — The asterisk wildcard character can be substituted for zero or more characters.
- ? — The question mark wildcard character can be substituted for one character.
- This section specifies where in the field to match the string:
- Match from start
- Match exactly (This means you want to match the entire line.)
- Match anywhere
- This section specifies how to keep the grouping when it filters a string. If neither is selected, it just keeps the rows that have the string:
- Keep parent row if any of the children match — This will display the parent row along with all the children rows that contain the string that the filter requested.
- Keep the children if any of their ancestors match — This will display the children rows along with all the parent rows that contain the string that the filter requested.
Grouping and ungrouping columns
You can group any one or multiple columns. When you group multiple columns, you create nested groups.
- Right-click on the column heading you want to create a group of and then select Group This Column.
- To ungroup a column, right-click on any column heading and then select Ungroup Column <name>.
Expanding and collapsing information in columns
You can expand or collapse information in a column.
- Right-click on a column heading and then select Expand All.
- Right-click on a column heading and then select Collapse All.
You can auto resize one or all columns in the display.
- To auto resize one column, right-click on the column heading and then select Auto Resize This Column.
- To auto resize all columns, right-click on any column heading and then select Auto Resize All Columns.
- (Optional) Double-click on the edge of a column heading in the job results display. This action will auto resize the column width to fit the data.
- (Optional) You can also drag the vertical line between column headings to resize them.
- (Optional) You can also drag-and-drop a column heading to change its horizontal position.
You can sort information displayed in a column.
- To sort column information, click on the column heading.
- To reverse sort column information, click on the column heading again.
- To add a secondary, tertiary (and so on) sort, press CTL-Click.
You can use the Find tool to narrow your search and highlight what you see in the table or in the details pane.
- To find key information in the table view, click in the table and then press CTRL-F to open the Find bar. Enter any string in the Find text box. This action finds the string you entered, whether it is an entire string or part of a string.
- To find key information in the details pane, select a row in the table to open the details pane. Click in the details pane and then press CTRL-F to open the Find bar.
Example:- Enter “ORA” in the Find text box. This will highlight the first occurrence of “ora” in the details pane.
If you enter text that does not have any matches, “Phrase not found” will display next to the Find bar. - (Optional) You can have either one or both Find bars open at the same time. If you have both Find bars open simultaneously, one displays at the bottom of the table and the other one displays at the bottom of the details pane.
- (Optional) Click Highlight to highlight all occurrences of “ora”.
- (Optional) Click Find Next or Find Previous to jump forwards or backwards to the next occurrence of “ora” and highlight it.
- (Optional) Click Match Case to narrow the find to “ORA” database errors in this example.
- Enter “ORA” in the Find text box. This will highlight the first occurrence of “ora” in the details pane.
- To close the Find bar, click the X in front of the Find text box or position the cursor in the Find text box and then press Esc.
Combined device history log
The combined device history log records events performed on servers and network devices in your environment. These events are recorded in detail as actions performed on a certain date, by a certain user, on a certain server, or on a certain network device.
In many troubleshooting tasks, this type of information is critical because some of these actions (changes) might be the root cause of problems. This log provides detailed information, such as the date the action occurred, the name and type of the device that the action was performed on, and a description of the action, that can help you perform root cause analysis, capacity planning, and compliance remediation tasks.
For example, if an application in your environment has suddenly stopped running and you know exactly when it was previously running, you need to examine a combined event history log for the affected servers and network devices, for that time period. This information can help you determine why the application stopped working.
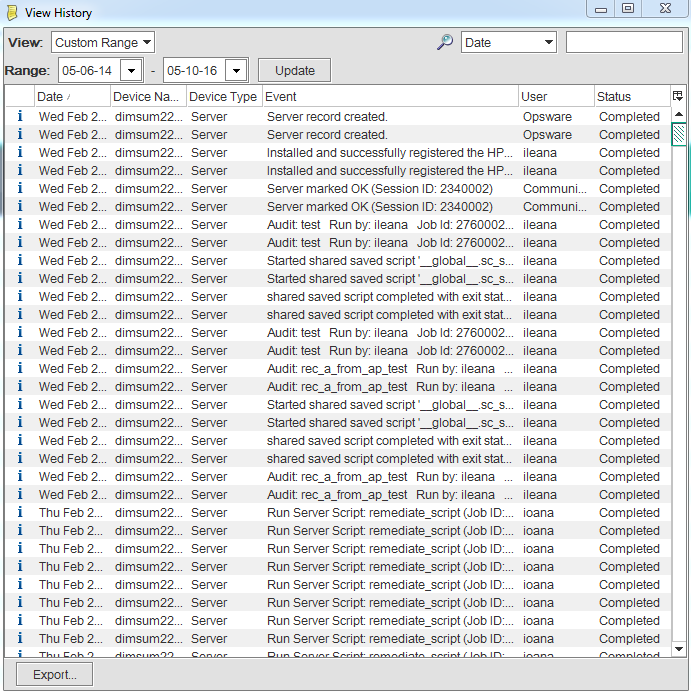
Viewing a combined device event history log
You can view a detailed list of events that occurred on a server or network device, such as all changes made to an application. You can narrow the time frame of the log display to see changes that occurred daily, weekly, monthly, quarterly, or in a custom range of dates. You can also dynamically filter the display of events by a certain date, device name, device type, event type, or by user name.
You can view a combined device history log for one or more managed servers or for a device group that contains managed servers and network devices.
To view a combined device history log for a device group:
- From the Navigation pane, select Devices Device Group, and select a device group.
- In the Content pane, select one or more devices in the group.
- Right-click and then select View Event History to list events that occurred on the selected devices.
Combined Device Event History