


Debug tool
The Debug tool enables you to debug issues that arise in the workflow of a record. When you perform an action within a debug session, all the steps of the action are recorded in a debug file. For each step in the flow, such as the evaluation of a condition or Expression Language phrase within the rule, there is a row representing the start and end of the step. For Expression Language phrases composed of multiple sub-expressions, there is a separate row for each sub-expression.
For example, if an error occurs due to a business rule that was not defined properly, the debug tool can help you identify the specific rule and parameter causing the problem. If you are unable to determine the source of the issue by reading the debug file, contact Support for assistance in debugging the issue.
To run the Debug tool:
-
From the login drop-down, select Start debug.
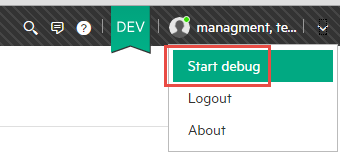
A message appears at the top of the screen that the debug session has started.
- Proceed with the required action. For example, create a new record.
- At any point, click Stop to stop the debug session. An Excel file is automatically downloaded with details of your debug session.
- Open the file to review all the actions that occurred during the workflow.
The following table describes some of the columns in the debug file which provide important information for each step of the action:
| Column name | Description |
|---|---|
| Timestamp | The time of the action. |
| Severity |
|
| Component |
|
| Message | Description of the action. |
| Workflow action | The type of action. For example, Start condition evaluation or End condition evaluation. |
| Duration | The duration of the action in milliseconds. Only relevant for ending actions. |
| Process event | The process event under which the business rule is defined. |
| Rule path | The full path of the location of the business rule (Record type, process, metaphase, phase). |
| Business rule source |
The source of the business rule. It could be a user-defined rule for the record type, or a system rule, not editable by the user. Alternatively, it could be a rule defined for the model on which the record is based, such as a rule defined for an offering which runs on the requests based on that offering. |
| Operation |
|
Note
-
To run the debug tool, you must have the Tenant Admin role. For more information about this role, see Default roles.
-
The debug tool is available for actions performed by business rules only. You cannot perform other actions, such as workflow configuration changes, while running a debug session.
- The maximum duration of a debug session is 15 minutes. After that time, the session automatically ends and the debug file is downloaded.
- The debug file is limited to a maximum of 25,000 rows. Beyond that point, the session continues but no data is recorded.
- Two users on the same tenant can open separate debug sessions at the same time. Each tenant is limited to two simultaneous debug sessions.
- There is an option to include the workflow simulation in the debug file. If you select this option, when you perform an action on a record without clicking Save, the steps of the action are recorded as a simulation. When you click Save, the same steps are recorded again as an actual operation. To select this option, go to the Application Settings, select Include simulation in debug report, and select True.
- By default, the debug file does not include performance data. If you want to add performance data to the debug file, submit a request to Micro Focus Support. The performance data consists of additional rows for the different elements involved in the evaluation of an Expression Language phrase which provide the duration of each element.


