Generate report based on PostgreSQL views
SMAX built-in reports and dashboards provide a quick and useful way to define many simple operational and analytic reports. Meanwhile, complex reporting and KPI needs such as queries involving many-to-many relations can be better addressed with BI Tools crafted specifically for this purpose.
PostgreSQL view generation
PostgreSQL views are generated during the platform start-up. By connecting a third-party tool such as Microsoft Power BI and Tableau directly to your SMAX data, PostgreSQL views can be utilized by a Service Management database user to generate database reports.
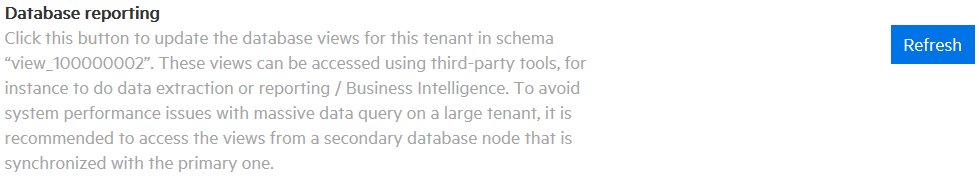
Note: You do not need to generate or refresh views to get the latest data updates. However, if the data model changes, for example, a new custom field is added, the views need to be refreshed manually by clicking the Refresh button in the Application Settings menu, as shown below.
PostgreSQL reporting with a mirrored data store
It is recommended to set up a replicated reporting store to properly support complex reporting in production environments. There are many public resources with information about PostgreSQL replication. Replication, Clustering, and Connection Pooling is a good overview of resources and projects providing PG replication options.
At the moment, pgpool II is our primary validated solution. The solution is recommended as:
-
PG stream replication in the production is for both high availability and load balance.
-
PG pool is used in production for load balance and read/write splitting.
-
PG pool or repmgr is used for automatic failover.
For reference, see http://jensd.be/591/linux/setup-a-redundant-postgresql-database-with-repmgr-and-pgpool.
Views and SMAX tenants
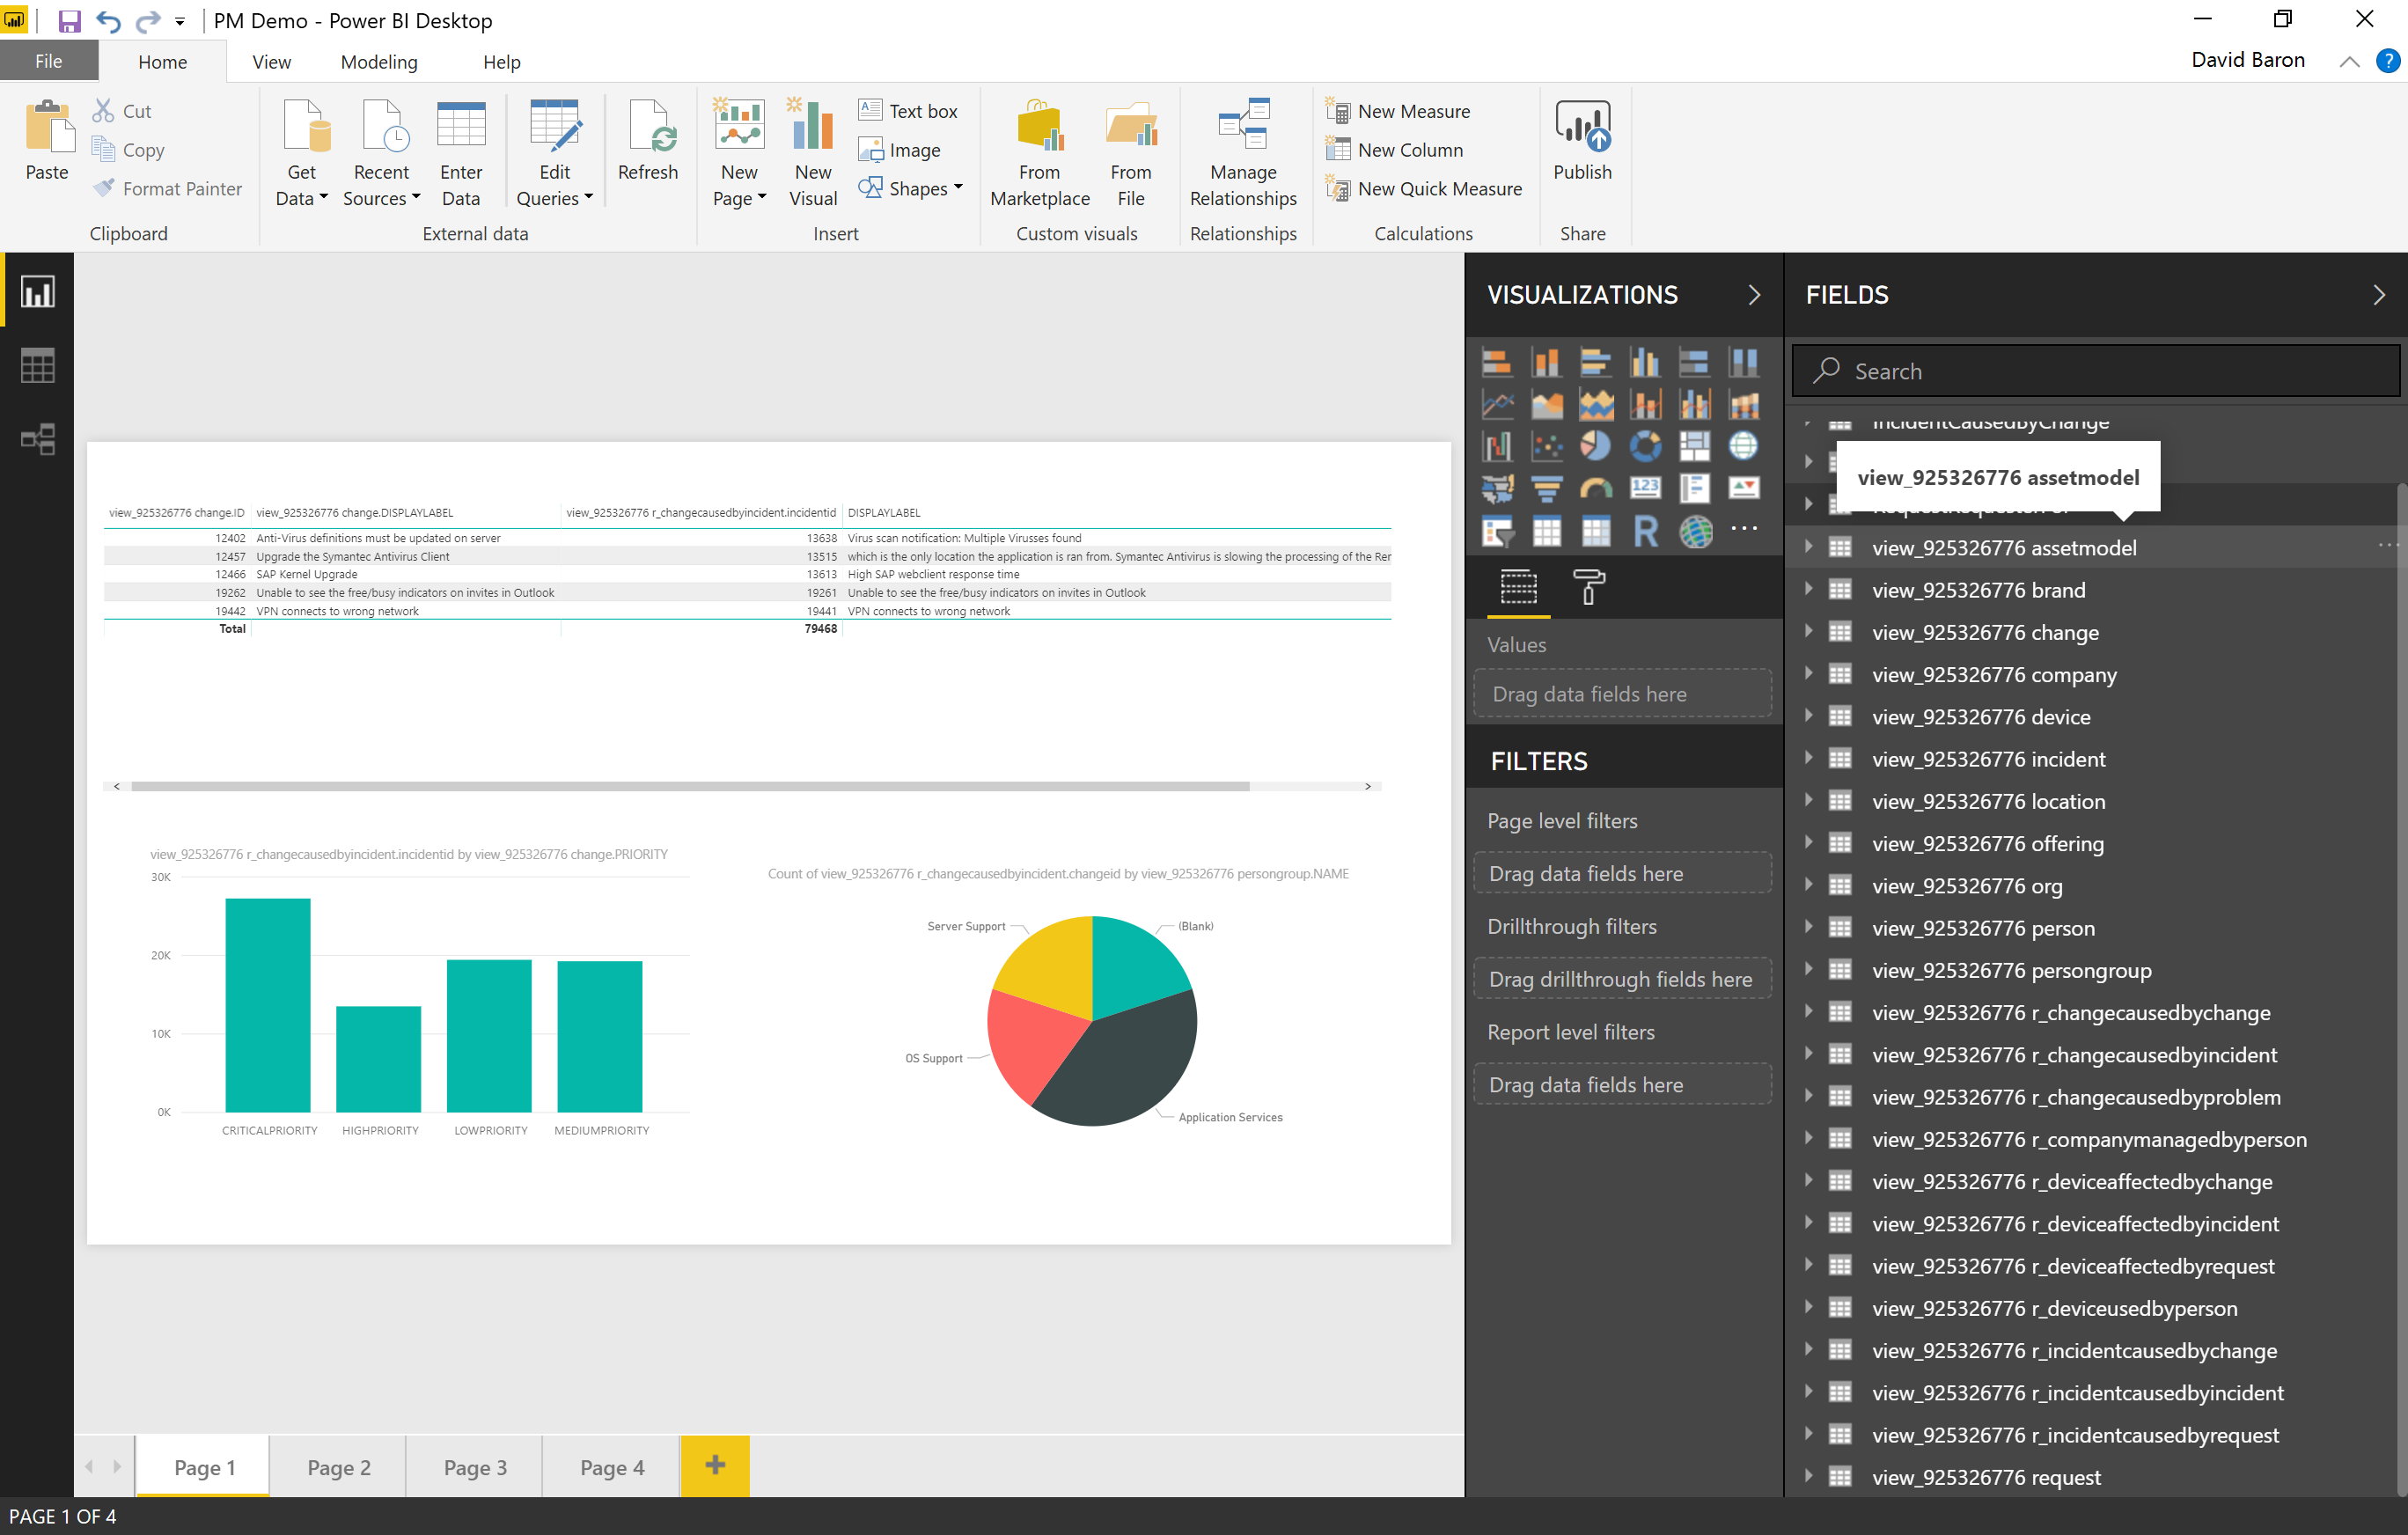
A separate set of views is generated for each tenant in an SMAX deployment instance. Each set contains views representing all relevant record types in the SMAX data model. The naming convention of each view indicates to which tenant it belongs. You can find the views for any given tenants by filtering with a prefix “view_[TenantID],” then select several views as needed to create reports. More views can be added at any point.
In addition, if you have production, development, and staging tenants, there will be views for each.
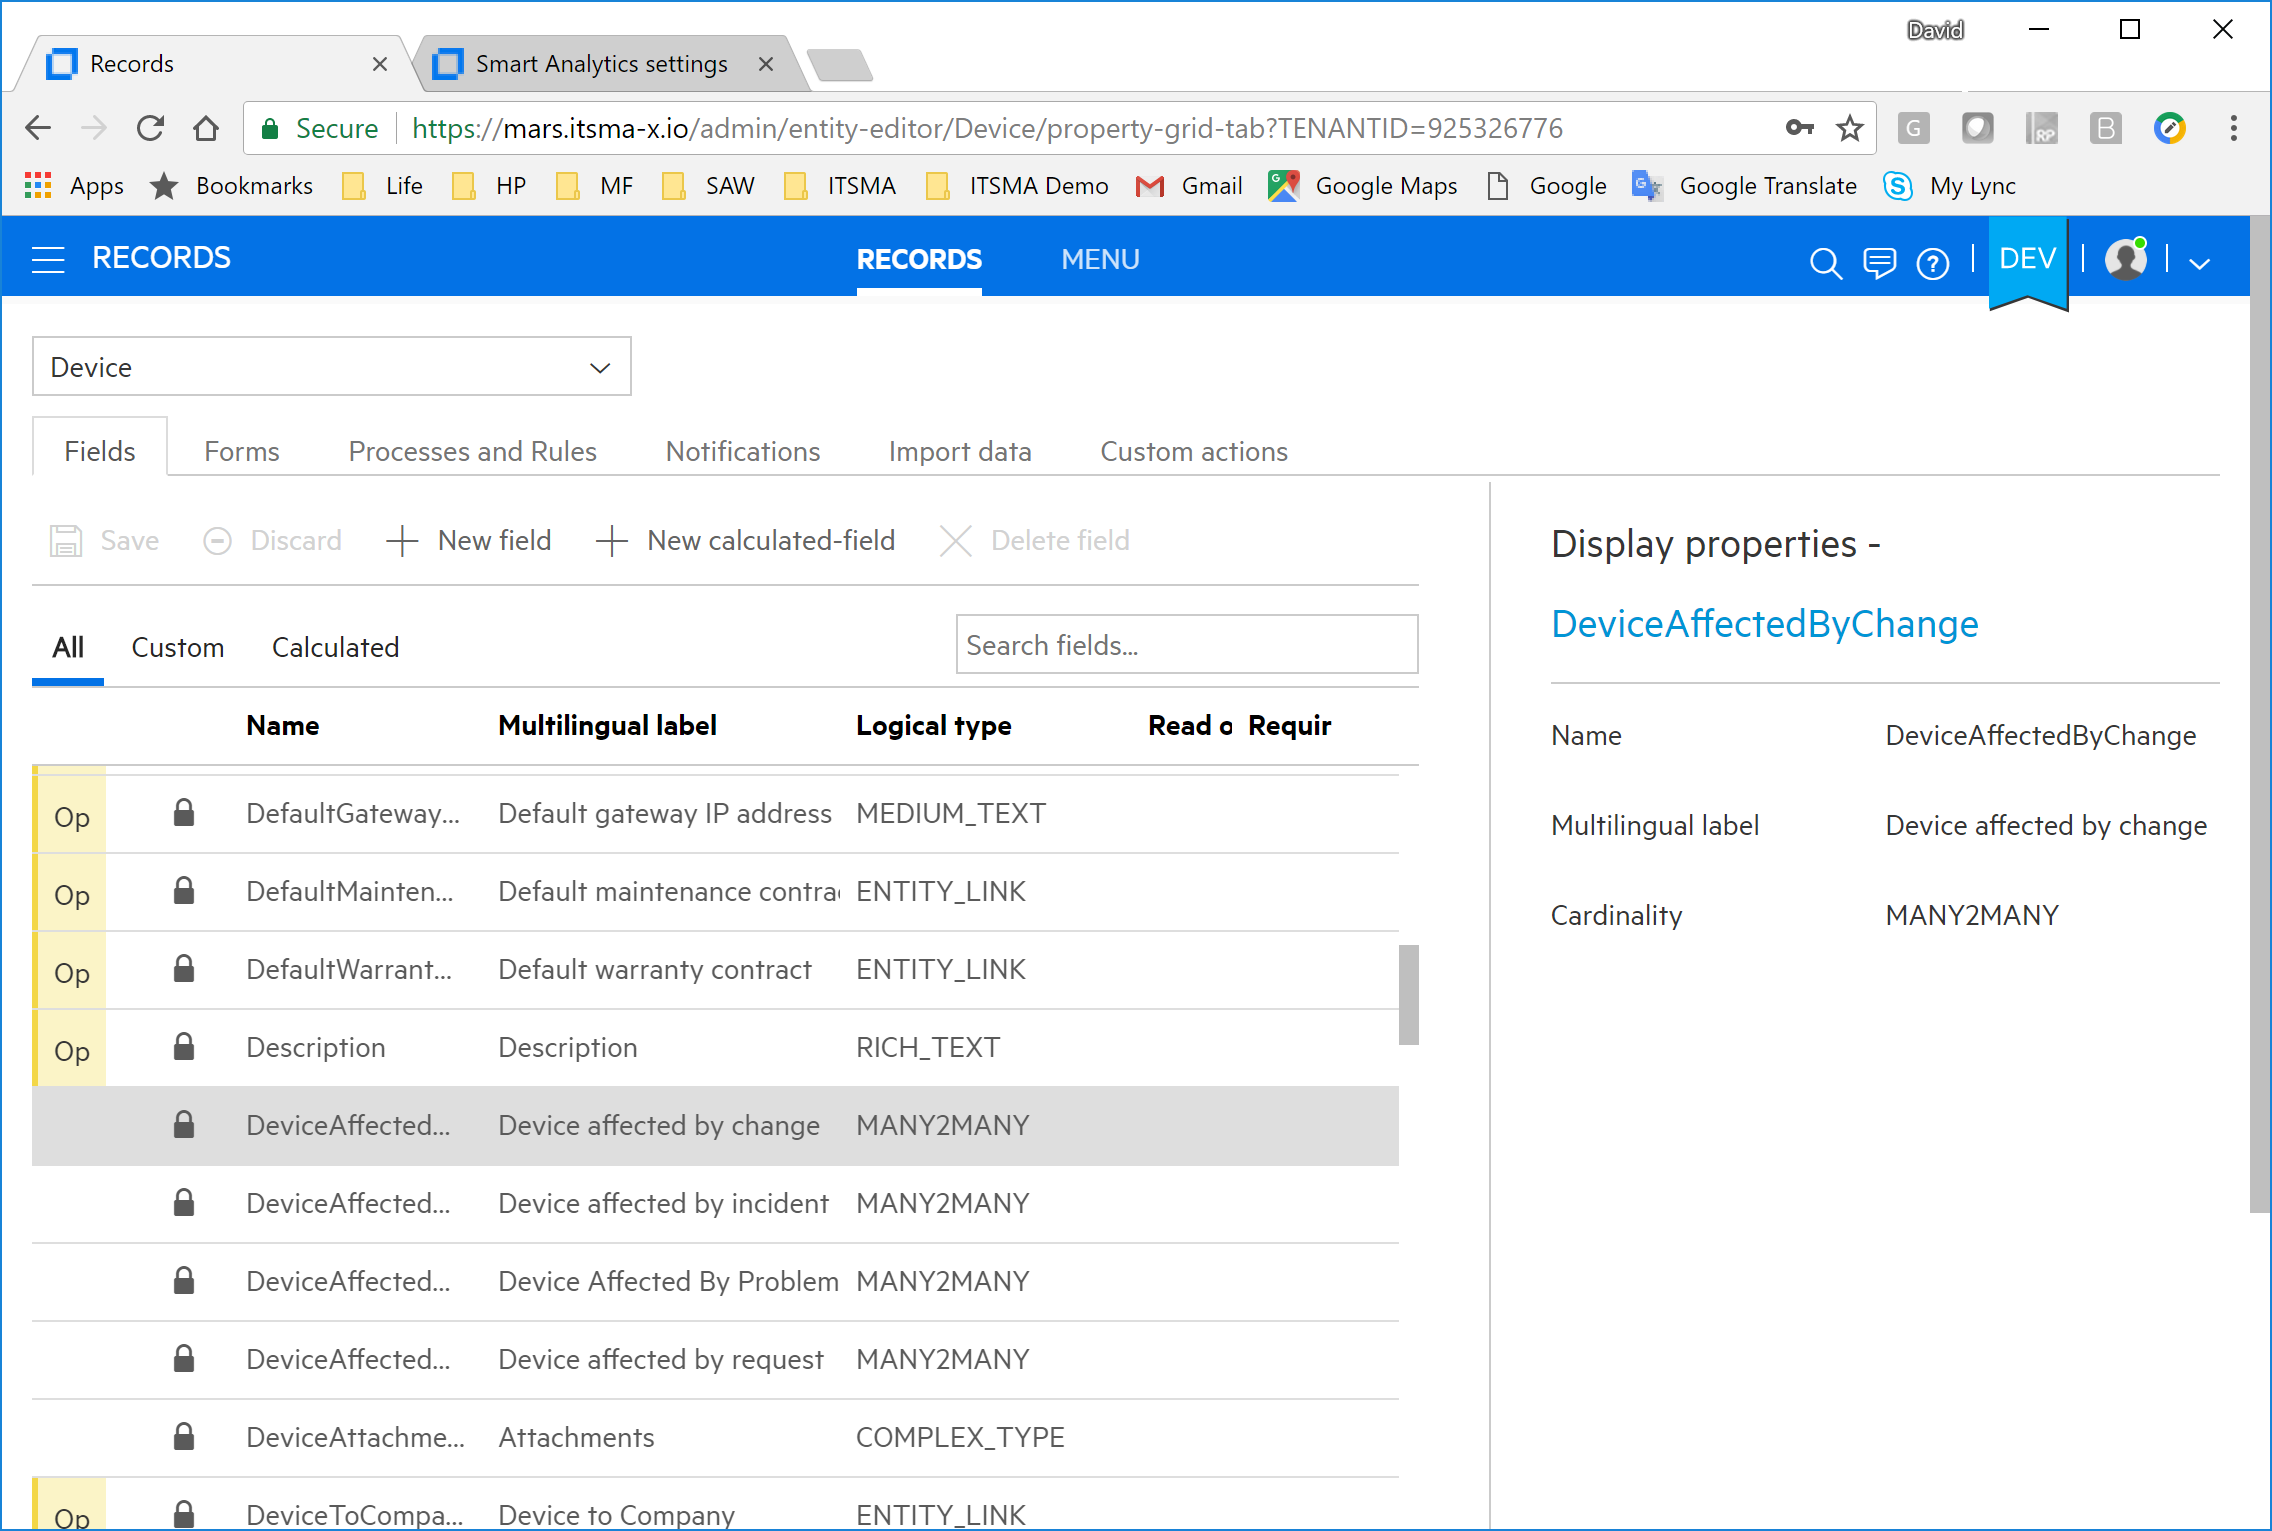
PostgreSQL view and SMAX data model
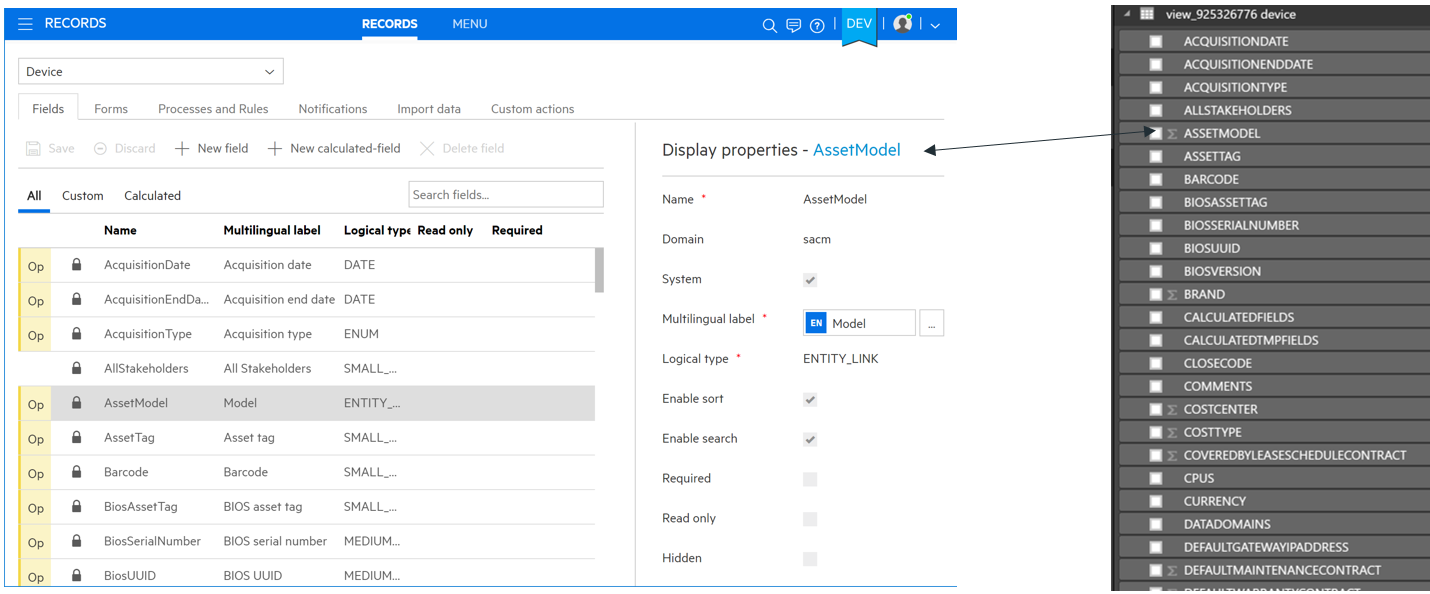
As shown in the figure above, each record type has a corresponding view of the same name. The Studio definition in SMAX is used as a reference for fields in the record model. Note that ENTITY_LINK fields point to related tables (one-to-many relationships).
The following figure demonstrates many-to-many associations. A specific many-to-many association table view is generated for each many-to-many association listed in an SMAX record model. You can use these association views to generate queries that join records from both tables.
Example: Generating reports with Microsoft Power BI
This section provides an example tutorial for creating reports using Microsoft Power BI. You will need a Power BI license or a trial version to apply the steps in this section.
Note: This type of report can also be created using other BI tools, which may also suit your business needs.
To generate the report based on the PostgreSQL view using Microsoft Power BI, follow these steps.
-
Download and install Power BI Desktop from Microsoft website.
-
Install Npgsql-3.2.7 on the local computer.
-
Enable a certificate for Power BI to communicate with PostgreSQL through an SSL connection.
-
Download the certificate stores https://s3.amazonaws.com/rds-downloads/rds-combined-ca-bundle.pem.
-
Convert pem to crt:
openssl x509 -outform der -in rds-combined-ca-bundle.pem -out rds-combined-ca-bundle.crt
-
Import the certificates into windows certificate store. http://www.cs.virginia.edu/~gsw2c/GridToolsDir/Documentation/ImportTrustedCertificates.htm can be used as a reference.
-
-
Get data from the PostgreSQL view.
-
Click Get Data under the Home tab.
-
Select data source type PostgreSql.
-
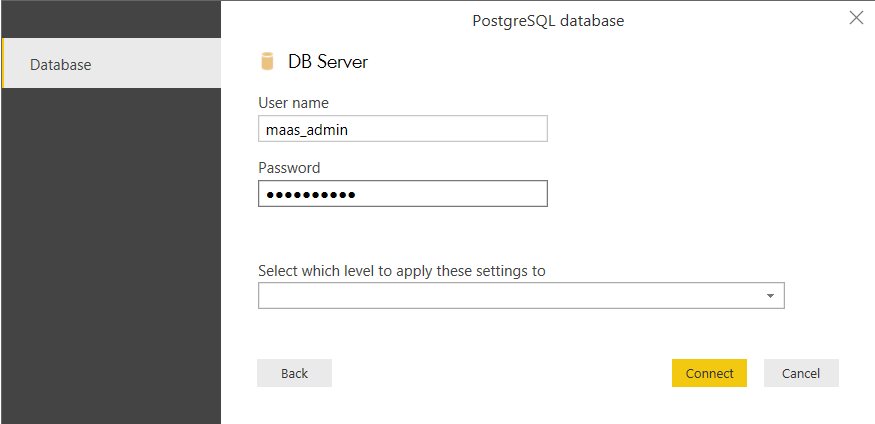
Connect to the database as demonstrated in the following example.
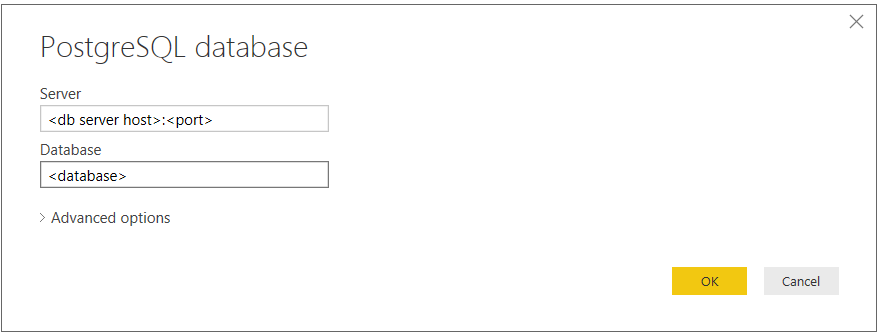
Contact your administrator to obtain the database server host from the config value of xruntime_db_host in configmap database-configmap. Database name is xservices_ems.
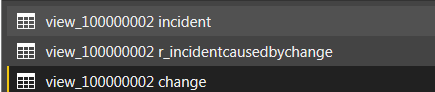
If the connection is successful, all views will be listed. Choose the view you want to use. Take Incident by change as an example, there are three related views, incidents, incidentscausedbychange, and change. The following steps will create a sample report showing “all incidents resulting from a faulty Change.”
-
-
Edit query (take Incident by change as an example).
-
Click Edit queries, you will see the following three queries listed in the left panel.
-
(Optional) Select the columns you want to use. You can click the query and click Choose Columns to filter the columns, this will simplify the actions. In this example, for Incident, choose column id and displaylabel. For Change, choose column id and displayLabel.
-
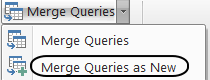
In the left panel, click Incident as the source table, and then click Merge Queries as New.
-
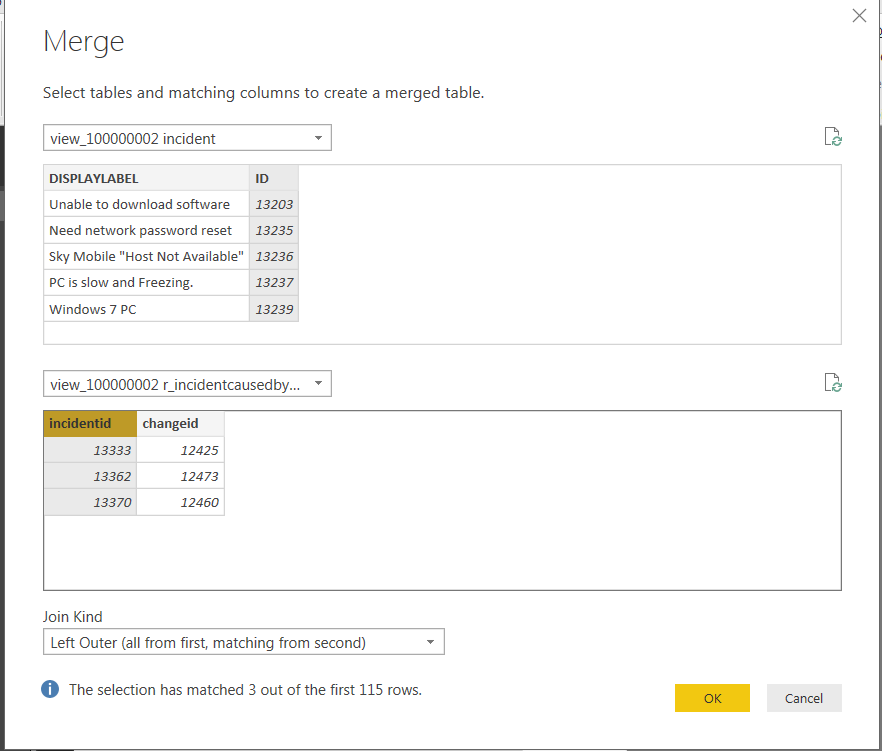
Choose the column you want to merge. In this example, choose Id from incident, and incidentid from relationship r_incidentcausedbychange. The constructed query will resemble:
select incident.displayLable, incident.id, r_incidentcausedbychange.incidentId,r_ incidentcausedbychange.changeId from incident left join incidentcausedbychange on incident.id = incidentcausedbychange.incidentId
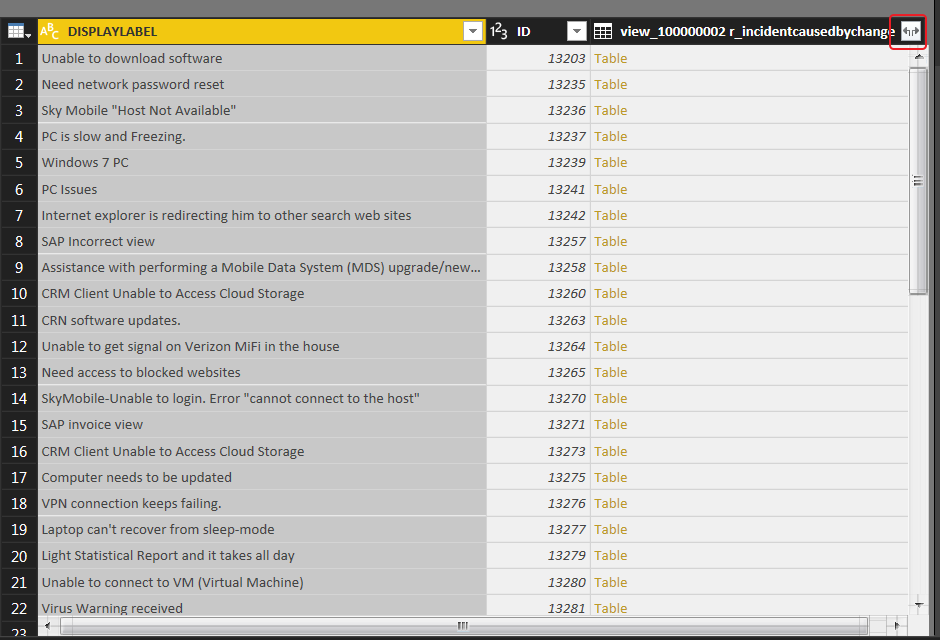
At this stage, there should be a new query named Merge1 with the merge result between Incident and incidentcausedbychange.
-
Select this Merge1 query. By default, the right side (incidentcausedbychange) of the join table is collapsed. Click the following button to expand the column for further usage.
-
Select the Merge1 query and click Merge Queries to continue further merge with Change.
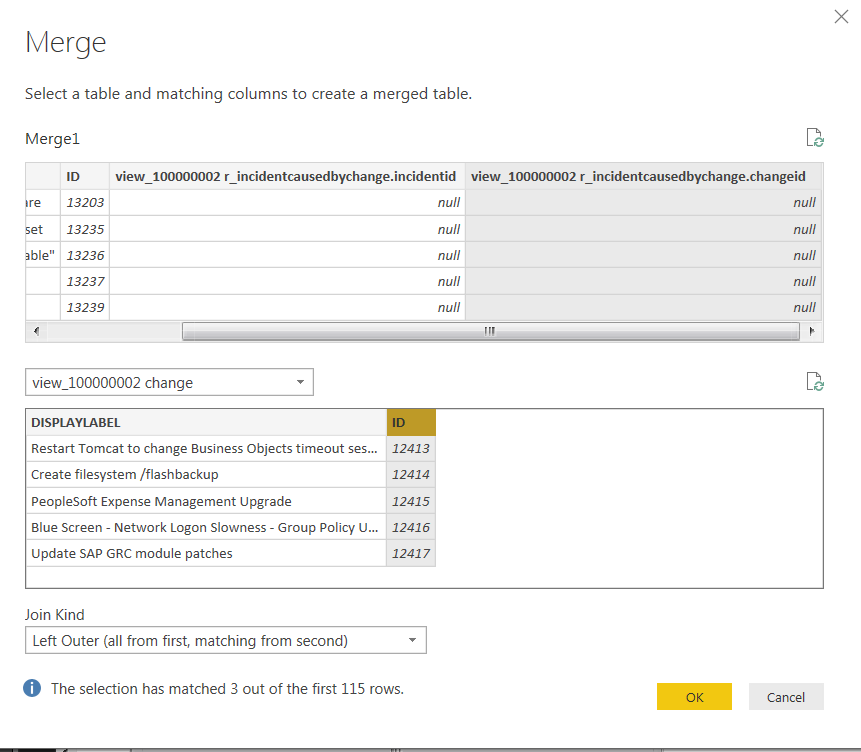
Then, expand the collapsed columns.
-
(Optional) You can rename Merge1 to a meaningful name such as IncidentCausedByChange.
-
Click Close & Apply. The queries have been built for the report.
-
-
-
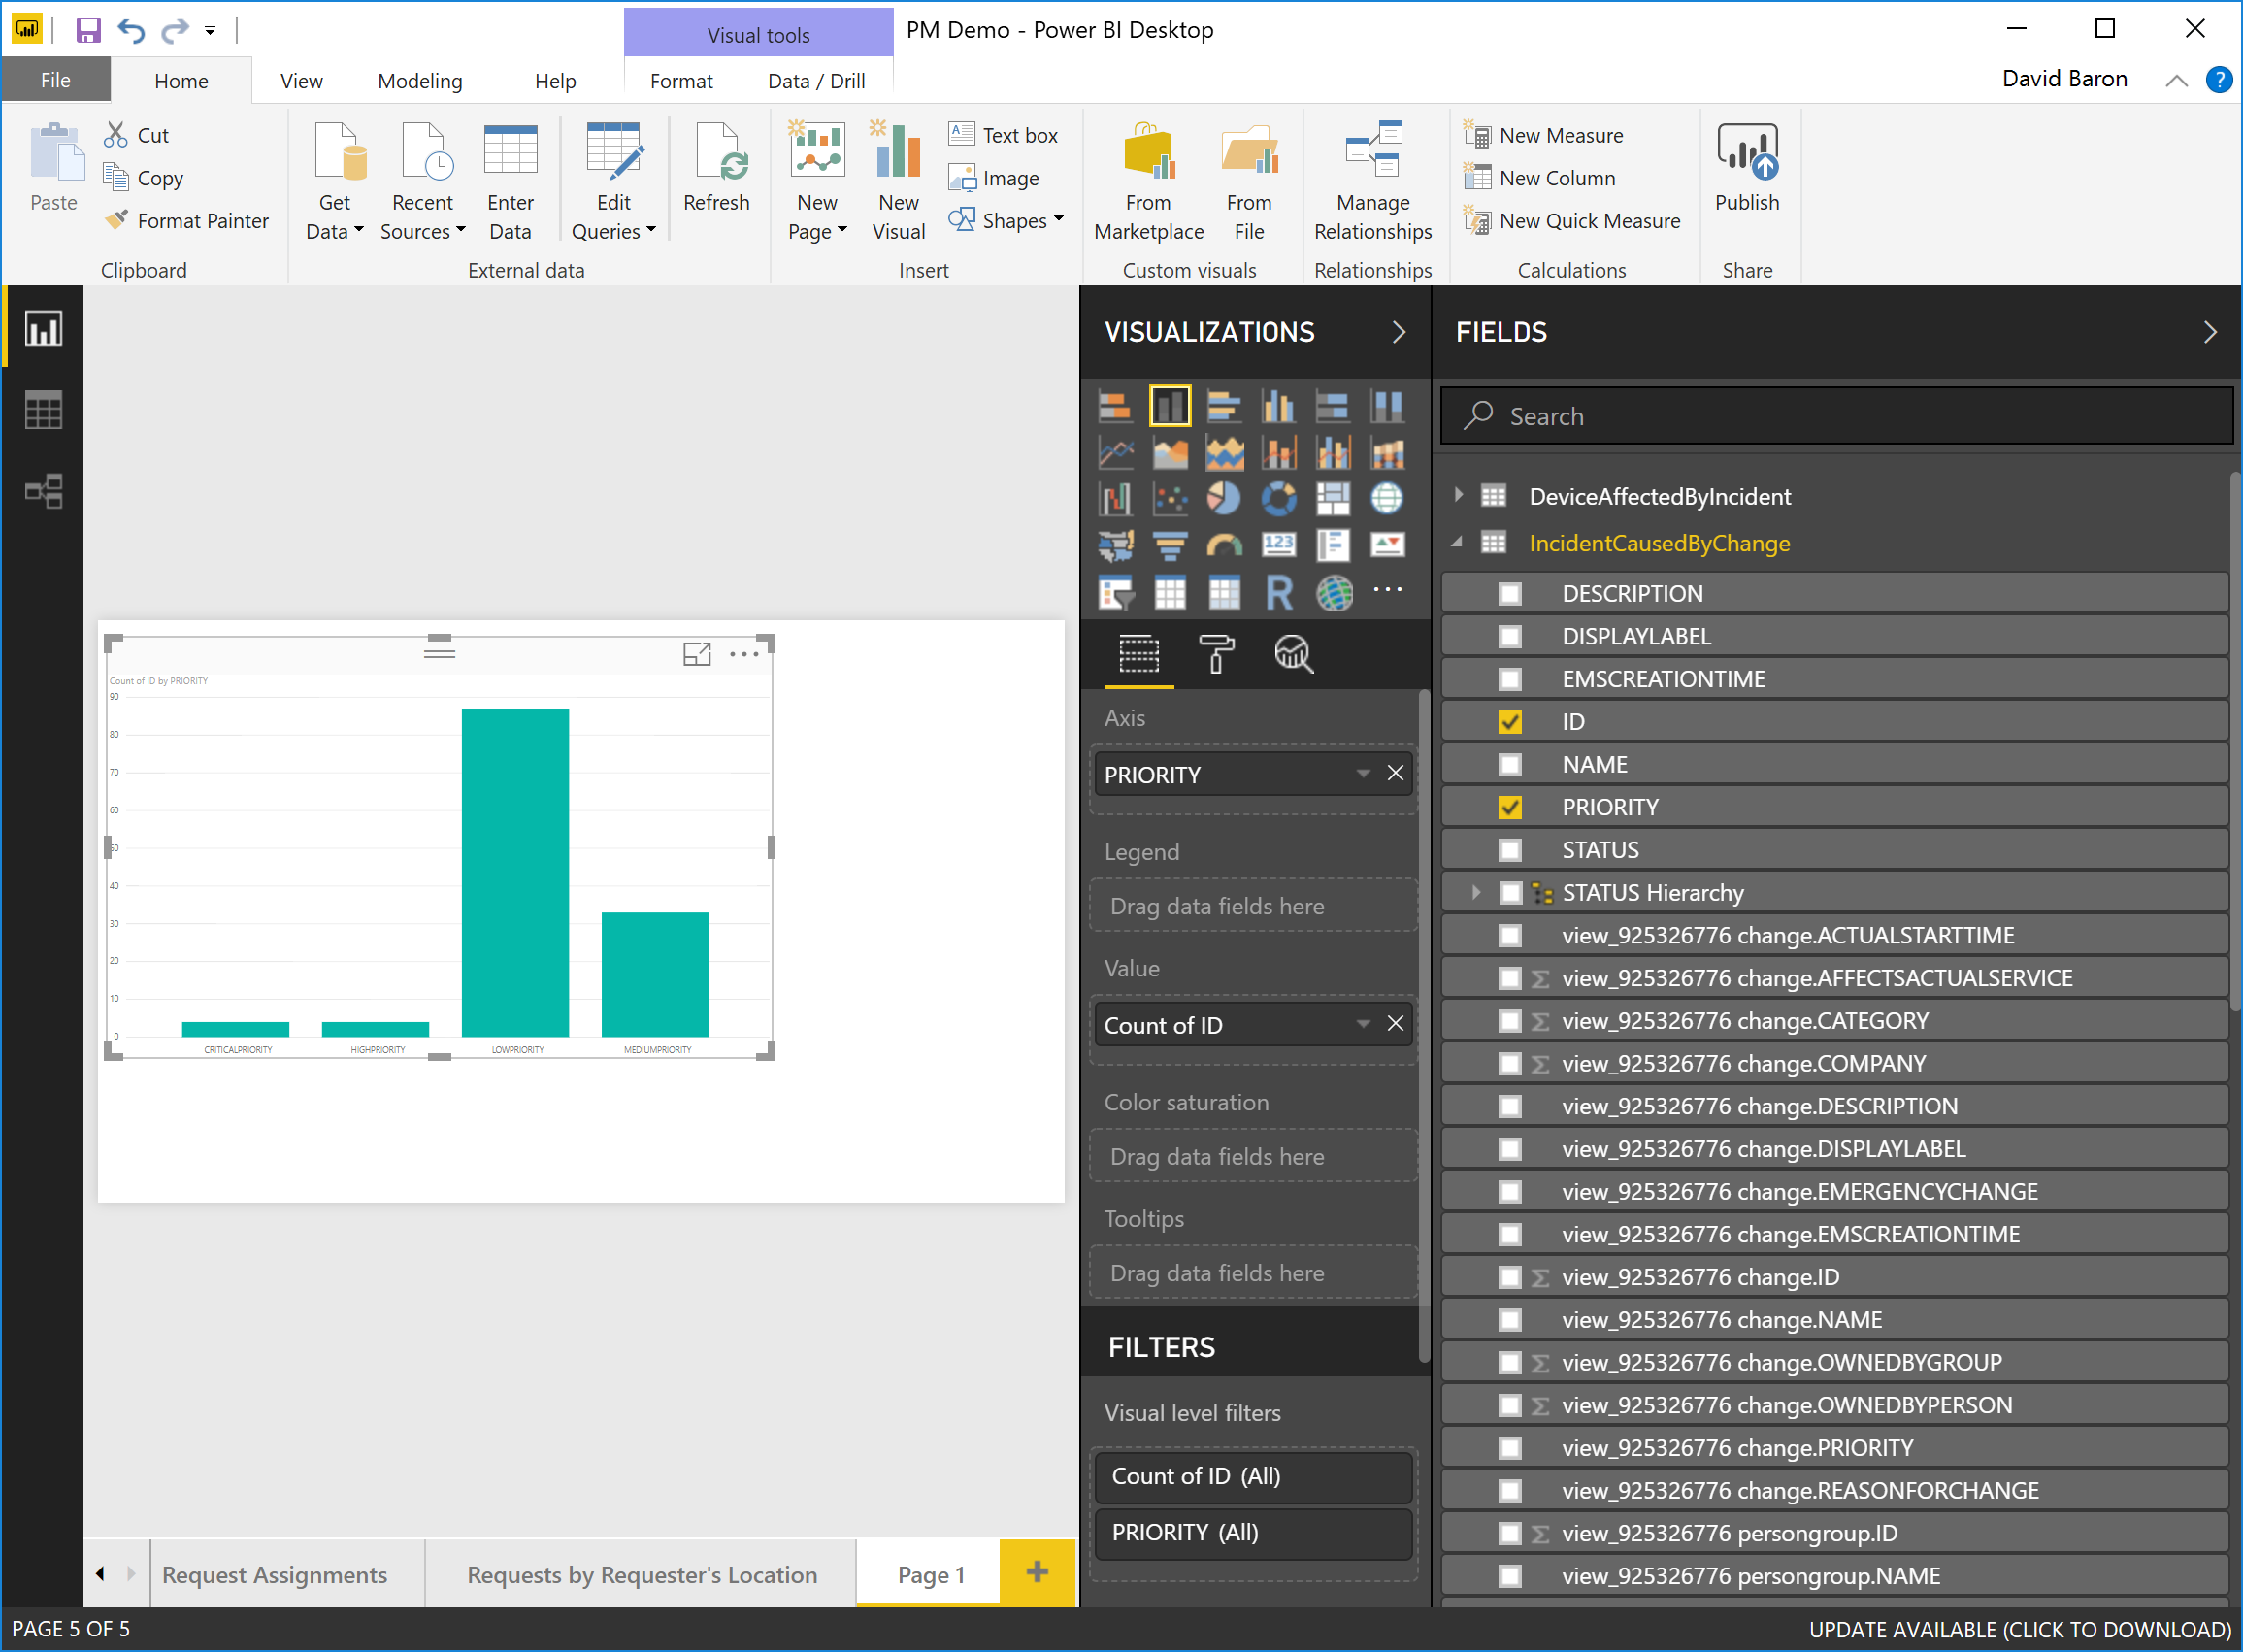
Create the report.
-
Select the chart type (stacked, column) in this example.
-
Drag the ID value into the Value drop-down slot.
-
Drag the Priority field into the Axis value slot.
-
-
The report will be generated.
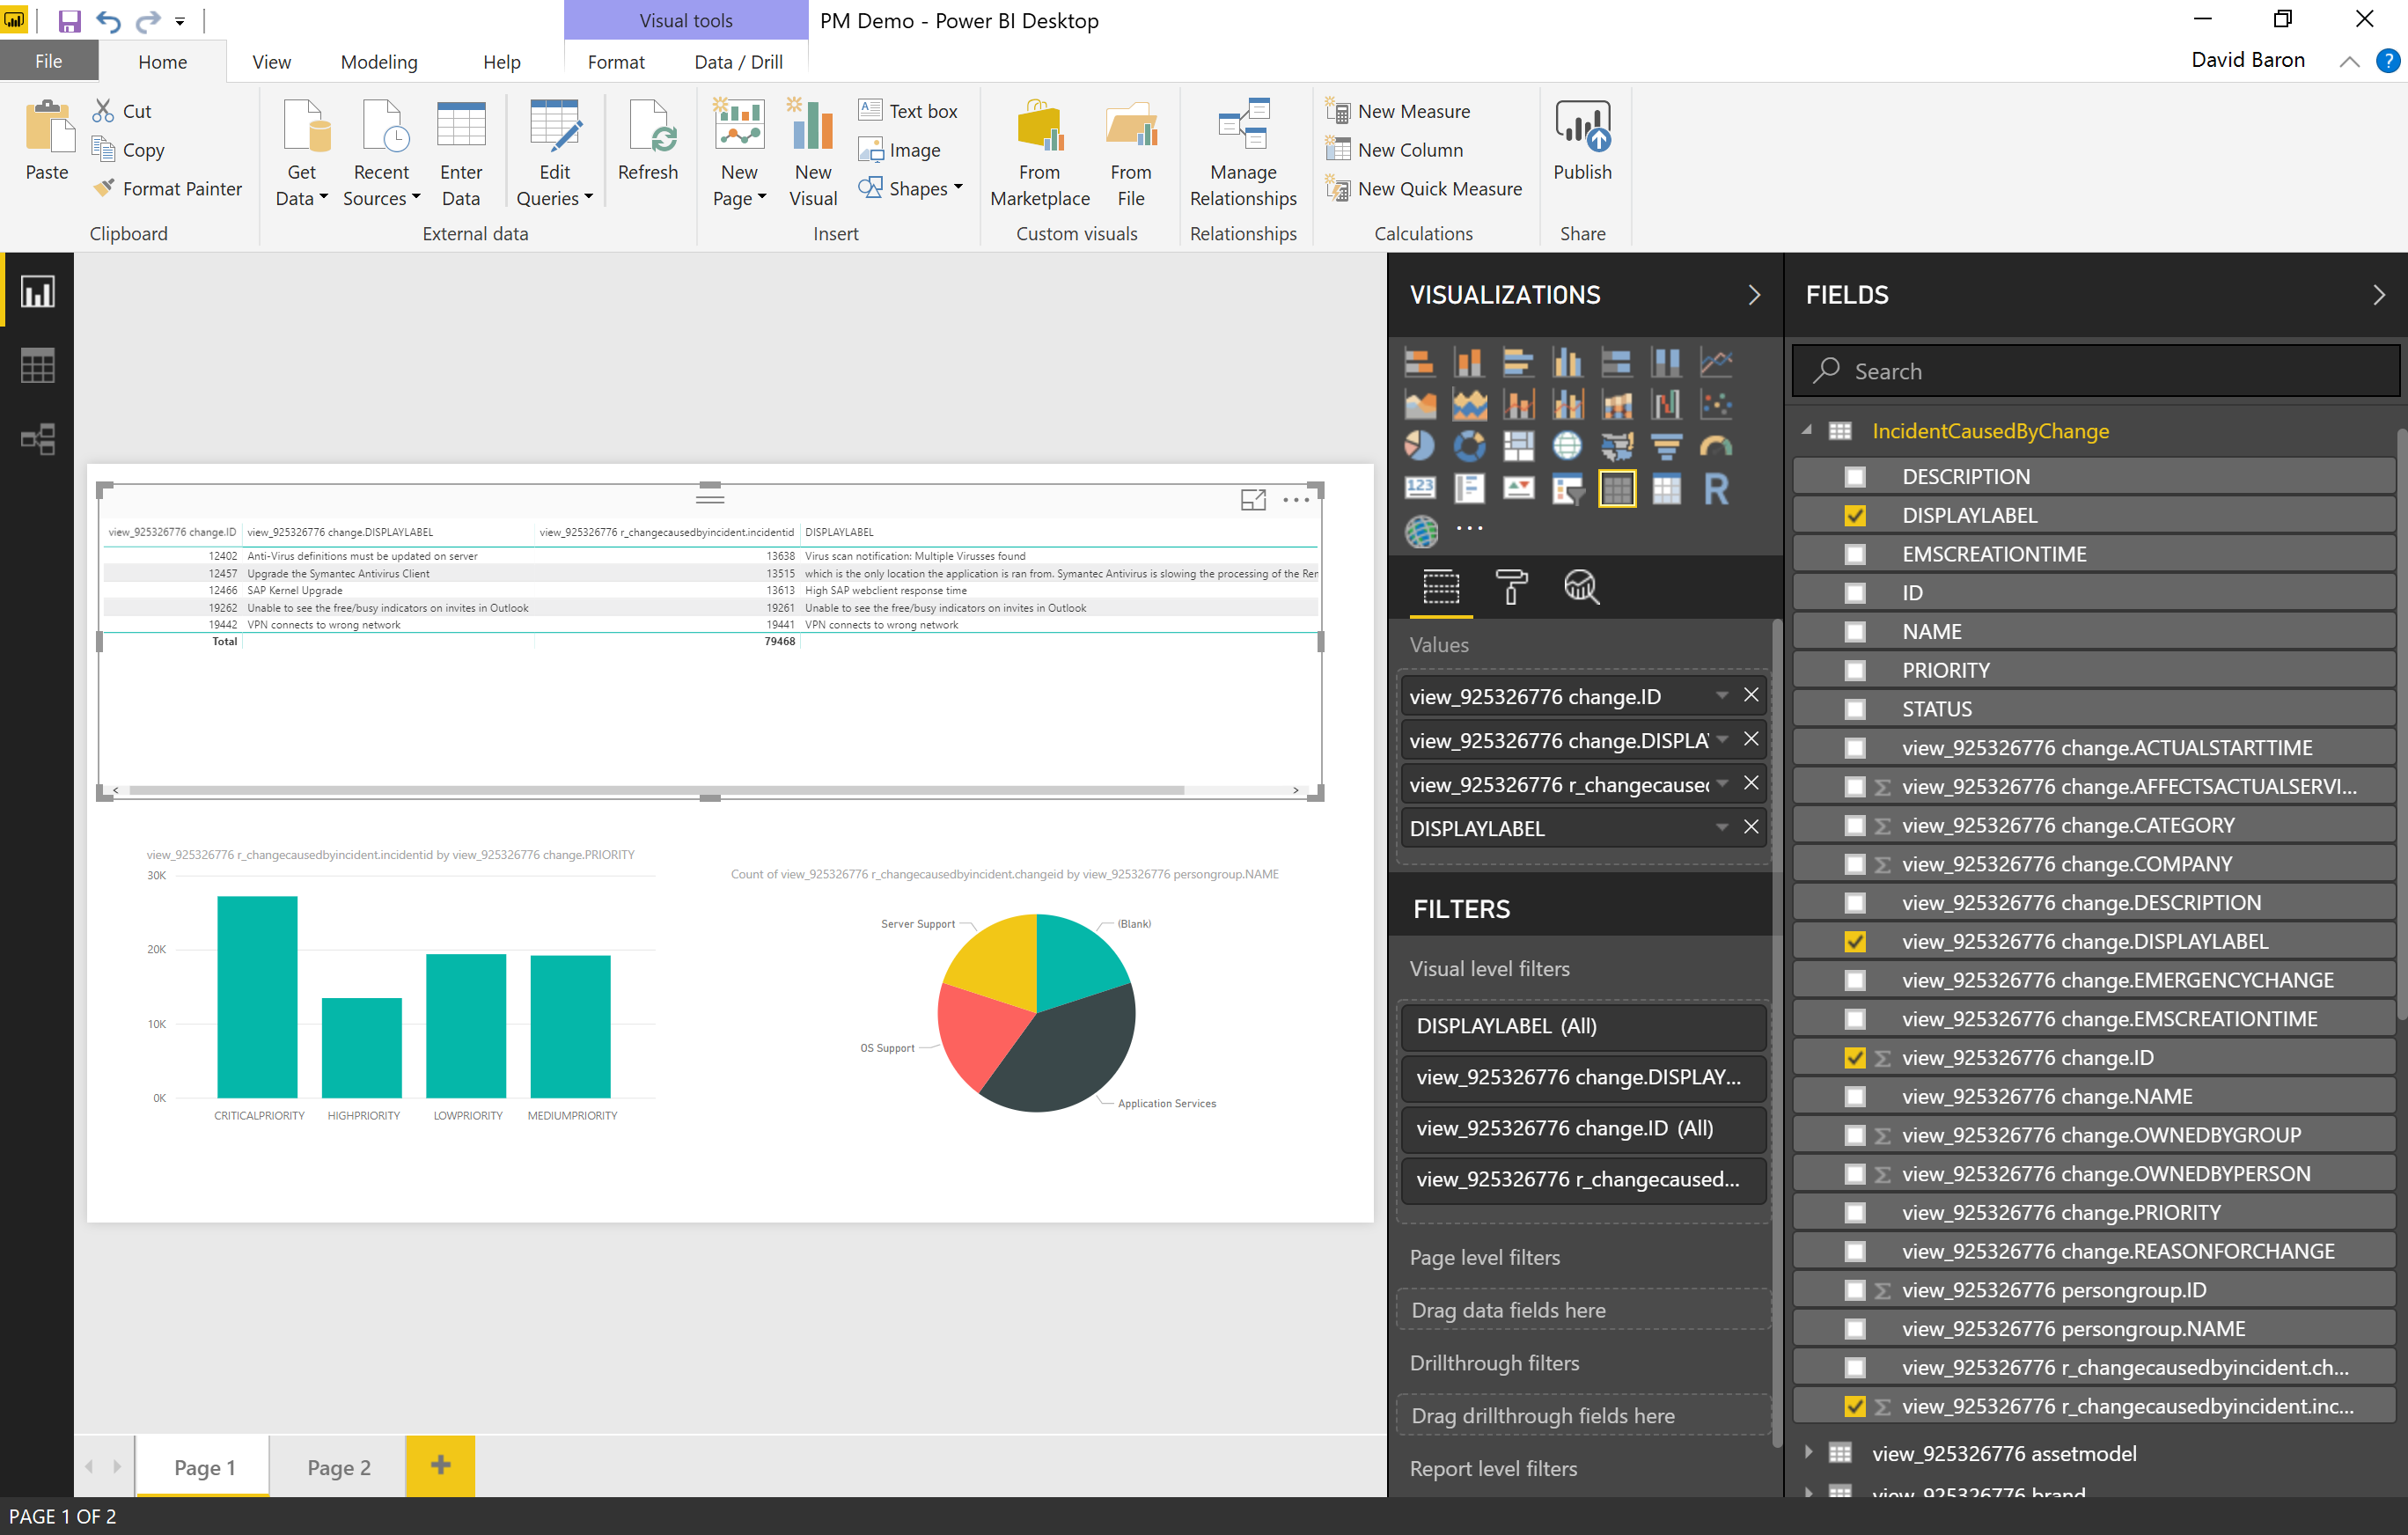
You can also create other graphs (click new visual) on the same page. The following figure is an example that combines three graphs, which are table views for all incidents by faulty change, incidents of caused by change grouped by change priority, and the one that shows grouping by change owner group.