Searching the Help
To search for information in the Help, type a word or phrase in the Search box. When you enter a group of words, OR is inferred. You can use Boolean operators to refine your search.
Results returned are case insensitive. However, results ranking takes case into account and assigns higher scores to case matches. Therefore, a search for "cats" followed by a search for "Cats" would return the same number of Help topics, but the order in which the topics are listed would be different.
| Search for | Example | Results |
|---|---|---|
| A single word | cat
|
Topics that contain the word "cat". You will also find its grammatical variations, such as "cats". |
|
A phrase. You can specify that the search results contain a specific phrase. |
"cat food" (quotation marks) |
Topics that contain the literal phrase "cat food" and all its grammatical variations. Without the quotation marks, the query is equivalent to specifying an OR operator, which finds topics with one of the individual words instead of the phrase. |
| Search for | Operator | Example |
|---|---|---|
|
Two or more words in the same topic |
|
|
| Either word in a topic |
|
|
| Topics that do not contain a specific word or phrase |
|
|
| Topics that contain one string and do not contain another | ^ (caret) |
cat ^ mouse
|
| A combination of search types | ( ) parentheses |
|
Debugger window
The debugger runs in separate window that has seven functional areas:
To expand an area that is collapsed, click the “Expand” ![]() button on the blue bar.
button on the blue bar.
For information about performing common troubleshooting tasks using the debugger, see Troubleshooting a job.
Tool bar
The debugger tool bar, located in the upper left corner of the Job Debugger window, enables you to control how the job that you are troubleshooting runs.
|
Button |
Name |
Purpose |
|---|---|---|
|
|
Single Step |
Click this button to run the next step in the debug job. Steps that are marked “Skipped” |
|
|
Resume |
Click this button to continue running a Paused job. If a breakpoint has been set, the job will run until it reaches the breakpoint. |
|
|
Pause |
Click this button to pause the debug job. The Pause button replaces the Resume button when a job is running. |
|
|
Cancel Job |
Click this button to cancel the entire debug job. |
|
|
Set Breakpoint |
Select a “Scheduled” You cannot set breakpoints on steps that have already been executed or steps that will be skipped. |
|
|
Remove Breakpoint |
Select a step with a breakpoint in the Steps area, and then click this button to remove the breakpoint. |
|
|
Refresh |
Force a refresh of the entire Job Debugger window. |
Status bar
The status bar is located in the lower left corner of the Job Debugger window. It shows you the current status of the debug job:

See Job status indicators for a description of all possible job states.
Job options
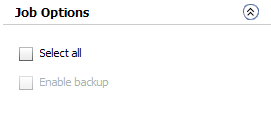
The Job Options area is located just below the tool bar in the upper left corner of the Job Debugger window. Here, you can set the following options:

The “Select all” option selects all servers and all components included in this job. If you clear the “Select all” box, all jobs steps will be skipped. See Selecting or skipping specific components or target items for additional information.
The “Enable backup” option runs any automatic backup steps that are included in this job. To disable all backup steps, clear this box. This will make the debug job run faster, but it will not roll back properly.
The “Enable backup” box is automatically cleared if you clear the “Select all” box—because clearing the “Select all” box skips all job steps, including backup steps. See Skipping backup stepsfor more information.
These options are only available before any steps in the debug job have been executed.
Job selections
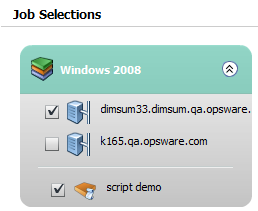
The Job Selections area is located on the left side of the Debugger window:

Here, you can select individual servers and components to include in your debug job. When you clear the box corresponding to a specific component or server, any steps pertaining to that component or server—including any rollback and undeployment steps—will be skipped.
In the example above, all steps pertaining to server k165.opsware.com will be skipped.
You can also enable or disable the deployment of a Software Policy or OS Sequence associated with any tier (see the SA 10.51
Components or servers for which steps have already been either executed or skipped are disabled in the Job Selections area and cannot be selected.
Details
The Details area is located in the upper right corner of the Job Debugger window. It contains information about the job that you are troubleshooting. The Job ID, Target, and Start Time fields are not populated until the job runs. If you launch the debugger from the Deployment page, for example, these fields will be empty until the job runs at least one executable step.
You can add or modify the comment in the Details area. This comment appears in the details window when you double-click this job in the Job Logs area of the Jobs screen.
Steps
The Steps area is located on the right side of the Job Debugger window below the Details area:

The Steps area shows you each individual step that Application Deployment performs when it runs this job. When you clear the check box for a server or component in the Job selections area, all steps that pertain to that server or component are skipped.
In the example above, all steps pertaining to server tomsrvr002.mycompany.com will be skipped.
The status icons are updated as the steps are executed.
|
Icon |
Status |
Description |
|---|---|---|
|
|
Scheduled |
This step is scheduled to run. |
|
|
Skip |
This step will be skipped (because either the component or server to which it pertains is not selected in the Job selections area). |
|
|
In Progress |
This step is running. |
|
|
Succeeded |
This step succeeded. |
|
|
Failed |
This step failed. |
|
|
Skipped |
This step was already skipped. |
Parameters
The first time that you open the debugger for a specific job, and no step has yet been selected, the Parameters table lists all the parameters for that job. If the job has no parameters, the message “Job has no parameters” is displayed.
When you select a specific step, the Parameters table lists only those parameters that pertain to the component being deployed in that step:

If the step has no parameters, the message “Step has no parameters” is displayed.
The Parameters table is read-only. You cannot override parameter values in the debugger.
Output
The Output area shows you what Application Deployment did when it ran the step selected in the Steps area. It indicates whether the step finished successfully and displays the contents of stdout and stderr (if pertinent).
Any information that appears in bold blue text in the Output area is a link to more detailed information
We welcome your comments!
To open the configured email client on this computer, open an email window.
Otherwise, copy the information below to a web mail client, and send this email to hpe_sa_docs@hpe.com.
Help Topic ID:
Product:
Topic Title:
Feedback:


