Searching the Help
To search for information in the Help, type a word or phrase in the Search box. When you enter a group of words, OR is inferred. You can use Boolean operators to refine your search.
Results returned are case insensitive. However, results ranking takes case into account and assigns higher scores to case matches. Therefore, a search for "cats" followed by a search for "Cats" would return the same number of Help topics, but the order in which the topics are listed would be different.
| Search for | Example | Results |
|---|---|---|
| A single word | cat
|
Topics that contain the word "cat". You will also find its grammatical variations, such as "cats". |
|
A phrase. You can specify that the search results contain a specific phrase. |
"cat food" (quotation marks) |
Topics that contain the literal phrase "cat food" and all its grammatical variations. Without the quotation marks, the query is equivalent to specifying an OR operator, which finds topics with one of the individual words instead of the phrase. |
| Search for | Operator | Example |
|---|---|---|
|
Two or more words in the same topic |
|
|
| Either word in a topic |
|
|
| Topics that do not contain a specific word or phrase |
|
|
| Topics that contain one string and do not contain another | ^ (caret) |
cat ^ mouse
|
| A combination of search types | ( ) parentheses |
|
- Reports User Interface
- Agent Status Report
- Application Breakdown Report
- Application License Report
- Asset Report
- Auditing Report
- Changed Application Report
- Changed Views Report
- CI Change Report
- CMDB Utilization Report
- Compare Archives Report
- Compare CIs Report
- Compare Snapshots Report
- Configuration Manager Policy Report
- Database Breakdown Report
- Delete Candidates Report
- Dependency Report
- Discovery Errors Report
- Generic Breakdown Report
- Gold Master Report
- Hardware Component Summary Report
- Impact Analysis Report
- Job List Dialog Box
- Migration Progress Report
- Network Device Breakdown Report
- Node OS Breakdown Report
- Node Summary Report
- Node Summary by VLAN Report
- Number of Changes Report
- Recognized Applications Report
- Report Properties Dialog Box
- Reports Page
- Rulebase Support Report
- Scan File Status Report
- Scanner Execution Details Report
- Schedule Report Dialog Box
- Schedule Snapshot Dialog Box
- Service Discovery Errors Report
- Software Utilization Report
- Solaris Zone Report
- Topology Report
- UD Agent Status Reports
- View Change Report
- VMware Host Report
- VMware Virtual Center Report
- Zone-Based Discovery Errors Report
- Report Toolbar Options
Software Utilization Report
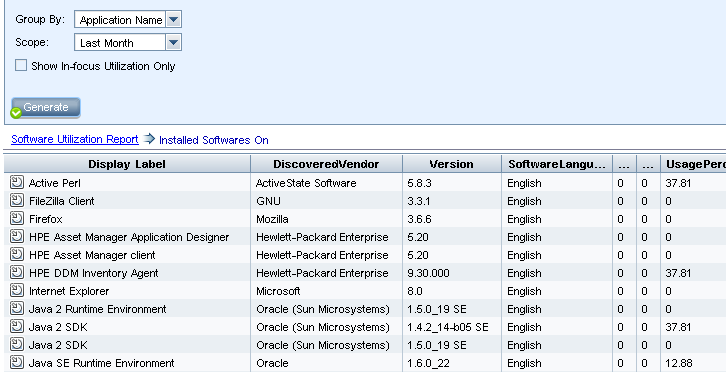
This report displays all the installed software on the current machine with utilization data.
| Report Example |

|
| To access |
Select Managers > Modeling > Reports. In the Custom Reports pane, do one of the following:
|
| Important information |
The top level of the report displays the number of installed applications for each software type. You can drill down to view utilization data on specific software applications. Use the Select Columns When the report is grouped by Related Node, a column called Installed Software is available, which displays the number of installed applications on that node. It also provides a clickable link to drill down and display the applications' details. Applications with no utilization data do not appear in the report. |
| Relevant tasks | How to Generate a Custom Report |
User interface elements are described below (unlabeled elements are shown in angle brackets):
| UI Element (A-Z) | Description |
|---|---|
| <Breadcrumbs> |
Displays the levels through which you have navigated to get to the current level. Appears horizontally across the top of the chart. Note Each level in the list of breadcrumbs is a clickable link. |
| <Shortcut Menu> | Right-click a CI in the report to access the IT Universe Manager shortcut menu. For details, see IT Universe Manager Shortcut Menu. |
| <Toolbar> | For details, see Report Toolbar Options. |
| Group By |
Select the method for displaying the data. The available options are:
|
| Scope |
Select the scope of the report. The available options are:
|
| Show In-focus Utilization Only |
Select this check box to configure the report to display only the utilization data for the time that an application was in focus (when it was in the foreground). When the check box is cleared, the report displays utilization data for the time that an application was running (even when it was in the background). |
We welcome your comments!
To open the configured email client on this computer, open an email window.
Otherwise, copy the information below to a web mail client, and send this email to cms-doc@microfocus.com.
Help Topic ID:
Product:
Topic Title:
Feedback:


 button
and select Software Utilization Report.
 button to select the attributes to display in the report. When the report is grouped by Application Name or Vendor Name, a column called Installed On is available at the level of installed applications (after drilling down). The column displays the location where the software is installed and provides a clickable link to the node.