


Compliance status overview
To view the Compliance Status Overview section, you must be logged in with the Read All permission. The widgets provide an overview of the compliance status across the system.
If no compliance data is available, the  icon appears in the widget.
You can hover over a widget to view further details on compliance policies, business services, and SoAs.
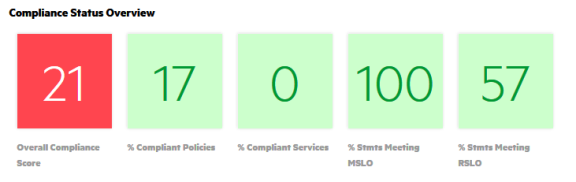
Overall compliance score
The number on the Overall Compliance Score widget represents the overall percentage of compliant rule-resource pairs across all compliance policies and business services in the system.
Compliance is indicated by the widget color:
- If the number meets the compliance threshold, the widget is the same green as the compliance bar in the following figure.
- If the number is less than the compliance threshold, the widget is red.
- If no SoAs are in production state or if a scan has not yet been run, the widget is gray.
In the previous illustration, the default compliance threshold of 100 is used. Because the overall compliance score is 21, the compliance threshold is not met, and the Overall Compliance Score widget is red.
When the user hovers over the Overall Compliance Score widget, a compliance bar is displayed, with colors indicating compliance.
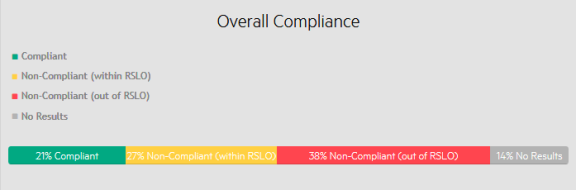
- Green - Percentage of compliant rule-resource pairs. The number is the same as displayed in the widget.
- Orange – Percentage of non-compliant rule-resource pairs that are within remediation service level objective (RSLO).
- Red – Percentage of non-compliant rule-resource pairs that are out of RSLO.
- Gray – Percentage of rule-resource pairs that have not been evaluated or are unknown.
% Compliant Policies
The number on the % Compliant Policies widget represents the percentage of policies in the system that are compliant based on the compliance threshold. A single policy is deemed to be compliant if the percentage of rule-resource pairs across all of the business services that need to comply with the policy meets the compliance threshold.
When you hover over the widget, the policies by compliance rating chart displays. The chart color indicates compliance:
- Green – Percentage of compliant policies. The number is the same as displayed in the widget.
- Red – Percentage of non-compliant policies.
- Gray – Percentage of policies with unknown compliance status.
% Compliant Services
The number on the % Compliant Services widget represents the percentage of business services in the system that are compliant based on the compliance threshold. A single business service is considered compliant if the percentage of rule-resource pairs across all of the policies with which it must comply meets the compliance threshold.
When you hover over the widget, the business services by compliance rating chart displays. The chart color indicates compliance:
- Green – Percentage of compliant business services. The number is the same as displayed in the widget.
- Red – Percentage of non-compliant business services.
- Gray – Percentage of business services with unknown compliance status.
% Stmts Meeting MSLO
The number on the % Stmts Meeting MSLO widget represents the percentage of SoAs in the system that are meeting measurement SLO. Even if any one rule-resource pair does not meet MSLO, the entire SoA is considered having not met MSLO.
When you hover over the widget, the percentage of SoAs meeting MSLO pie chart displays. The chart color indicates compliance:
-
Green – Percentage of SoAs meeting MSLO. The number is the same as displayed in the widget.
- Red – Percentage of SoAs not meeting MSLO.
% Stmts Meeting RSLO
The number on the % Stmts Meeting RSLO widget represents the percentage of SoAs in the system that are meeting remediation SLO. If any one rule-resource pair is not meeting RSLO, then the entire SoA is not meeting RSLO. Only the rule-resource pairs that were previously scanned and evaluated as not compliant are considered.
When you hover over the widget, the percentage of SoAs meeting RSLO pie chart displays. The chart color indicates compliance:
- Green – Percentage of SoAs meeting RSLO. The number is the same as displayed in the widget.
- Red – Percentage of SoAs not meeting RSLO.