
Searching the Help
To search for information in the Help, type a word or phrase in the Search box. When you enter a group of words, OR is inferred. You can use Boolean operators to refine your search.
Results returned are case insensitive. However, results ranking takes case into account and assigns higher scores to case matches. Therefore, a search for "cats" followed by a search for "Cats" would return the same number of Help topics, but the order in which the topics are listed would be different.
| Search for | Example | Results |
|---|---|---|
| A single word | cat
|
Topics that contain the word "cat". You will also find its grammatical variations, such as "cats". |
|
A phrase. You can specify that the search results contain a specific phrase. |
"cat food" (quotation marks) |
Topics that contain the literal phrase "cat food" and all its grammatical variations. Without the quotation marks, the query is equivalent to specifying an OR operator, which finds topics with one of the individual words instead of the phrase. |
| Search for | Operator | Example |
|---|---|---|
|
Two or more words in the same topic |
|
|
| Either word in a topic |
|
|
| Topics that do not contain a specific word or phrase |
|
|
| Topics that contain one string and do not contain another | ^ (caret) |
cat ^ mouse
|
| A combination of search types | ( ) parentheses |
|


![]()
![]()

Logs and the LogTool
IT Business Analytics records the procedures and actions performed by the various components in log files. The log files are usually designed to serve HP Software Support when ITBA does not perform as expected. The default severity threshold level for log files differs per log, but is generally set to either Warning or Error.
You can view log files with any text editor.
The LogTool enables you to view, manage, and analyze your logs.
The URL of the LogPortal where you can use the LogTool is:
https://<ba_server_fqdn>:10003/LogPortal.

 Common Component Log Files and Their Location
| Log Filename | Description |
|---|---|
| access.log |
Records all requests processed by the web server. Location: $HPBA_Home/webserver/httpd/logs |
| error.log |
The web server error.log is the most important log file. This is the place where Apache httpd sends diagnostic information and records any errors that it encounters when processing requests. Location: $HPBA_Home/webserver/httpd/logs |
| install-<timestamp>.log |
Installation log Location: $HPBA_Home |
| jk.log |
Contains information about communications between the web server and the application server (Glassfish). Location: $HPBA_Home/webserver/httpd/logs |
| ssl_request.log |
Logs records of all secured requests processed by the web server. Location: $HPBA_Home/webserver/httpd/logs |
| applicationfw.log |
Logs application loading and permission enforcement related to the application framework. Location: $HPBA_Home/glassfish/glassfish/domains/BTOA/logs |
| athN.log |
Logs requests for authentication and population of user roles and permissions. Location: $HPBA_Home/glassfish/glassfish/domains/BTOA/logs |
| aui.log |
Logs user management user interface details. Location: $HPBA_Home/glassfish/glassfish/domains/BTOA/logs |
| bo-services.log |
Logs the usage of SAP BusinessObjects services, including issues locating the SAP BusinessObjects CMS. Location: $HPBA_Home/glassfish/glassfish/domains/BTOA/logs |
| bsf.log |
The BTO Security Framework (BSF) server-side log records runtime authentication information about authn, LW-SSO, and user mng. For example, when the user visits a page, there is an authorization action in the bsf.log. Location: $HPBA_Home/glassfish/glassfish/domains/BTOA/logs |
| bsf-security.log |
Logs user relevant events, such as logon/logout. For example, when the user accesses/exists the ITBA application, there is a logon/logout action in the bsf-security.log. Location: $HPBA_Home/glassfish/glassfish/domains/BTOA/logs |
| btoe-services.log |
Logs the usage of foundation services. Location: $HPBA_Home/glassfish/glassfish/domains/BTOA/logs |
| datalayer.log |
Logs SAP BusinessObjects datalayer transactions such as problems with SAP BusinessObject Universes or queries. Location: $HPBA_Home/glassfish/glassfish/domains/BTOA/logs |
| foundation.log |
Foundation core components log. Location: $HPBA_Home/glassfish/glassfish/domains/BTOA/logs |
| hibernate.log |
Hibernate log. Location: $HPBA_Home/glassfish/glassfish/domains/BTOA/logs |
| jvm.log |
JVM general log. Location: $HPBA_Home/glassfish/glassfish/domains/BTOA/logs |
| license-services.log |
Licensing logs. Location: $HPBA_Home/glassfish/glassfish/domains/BTOA/logs |
| properties.log |
Properties table logs. Location: $HPBA_Home/glassfish/glassfish/domains/BTOA/logs |
| server.log |
General GlassFish log. Location: $HPBA_Home/glassfish/glassfish/domains/BTOA/logs |
| settings.log |
Settings management logs. Location: $HPBA_Home/glassfish/glassfish/domains/BTOA/logs |
| sso.log |
Logs authentication details related to IDM and LW SSO. Location: $HPBA_Home/glassfish/glassfish/domains/BTOA/logs |
| uim.log |
User Interface mash-up logs. Location: $HPBA_Home/glassfish/glassfish/domains/BTOA/logs |
| userMng.log |
User Management actions log, including problems with communication to SAP BusinessObjects. Location: $HPBA_Home/glassfish/glassfish/domains/BTOA/logs |
| log.txt |
MQ Broker service log. Location: $HPBA_Home/glassfish/glassfish/domains/domain1/imq/instances/imqbroker_host1/log |
Business Analytics Log Files and Their Location
| Log filename | Description |
|---|---|
| dashboard.log |
Logs all the dashboard server-side logs. Location: $HPBA_Home/glassfish/glassfish/domains/BTOA/logs |
| studio.log |
Logs general information for the Studio. Location: $HPBA_Home/glassfish/glassfish/domains/BTOA/logs |
| engine.log |
Logs general information about the engine, KPIs, and business context calculation details. Location: $HPBA_Home/glassfish/glassfish/domains/BTOA/logs |
| engine_statistics.log |
Provides a sfgjummary of calculation cycles, and statistics about KPI engine performance. Location: $HPBA_Home/glassfish/glassfish/domains/BTOA/logs |
Data Warehouse Log Files and Their Location
Log files can be accessed under:
| Log | Description |
|---|---|
| cfm.log |
The Content flow Manager log. It lists the whole process of streams. Detailed logs of each step are covered in related logs. Location: $HPBA_Home/glassfish/glassfish/domains/BTOA/logs |
| data_consolidation.log |
The consolidation configuration log. Location: $HPBA_Home/glassfish/glassfish/domains/BTOA/logs |
| dcs.extractor.log |
Describes the activity of all the extractors that were triggered by Content Flow Manager. Location: $HPBA_Home/glassfish/glassfish/domains/BTOA/logs |
| dcs.log |
Logs the source extraction information. Location: $HPBA_Home/glassfish/glassfish/domains/BTOA/logs |
| dsm.ui.log |
Logs Datasource Management UI management activities. Location: $HPBA_Home/glassfish/glassfish/domains/BTOA/logs |
| dwh.log |
Logs the DWH management activities. Location: $HPBA_Home/glassfish/glassfish/domains/BTOA/logs |
| dwhETLService.log |
The runtime log of the ETL steps in a stream. Location: $HPBA_Home/glassfish/glassfish/domains/BTOA/logs |
| dwhSchemaGen.log |
The log of the generated staging and target schema during the deployment of a Content Pack. Location: $HPBA_Home/glassfish/glassfish/domains/BTOA/logs |

Access the LogTool in the LogPortal
-
Access the LogPortal at: https://<ba_server_fqdn>:10003/LogPortal. In a Production environment, you should checks the logs in each server.
-
Enter your user/password:
- If the installation was successful, the username/password for LogPortal is same as the glassfish admin console (locahost:10001) user/password that you entered during the post-install procedure.
-
If an error occurred during installation:
-
Option 1: Try to access the LogPortal (for credentials, use admin for the username, and an empty password). If it is not accessible, then use Option 2.
- Option 2: Use a text editor to analyze the logs in the file system.
-
- You can now select the product area, the time range, to include the log history or not, select the relevant log to display it in the detail area, and then select the filters to display only the lines that include the filter string.
- You can also set up, in the Refresh Rate field, how often you want the log list and the log viewer to check for updates on the server side .
Downloading the log files
- Option 1: Click
 in the relevant log list row to download the corresponding log file.
 - Option 2: Click here in Click here to download all files, creates a zip file with all the logs in the selected product area.

LogTool page
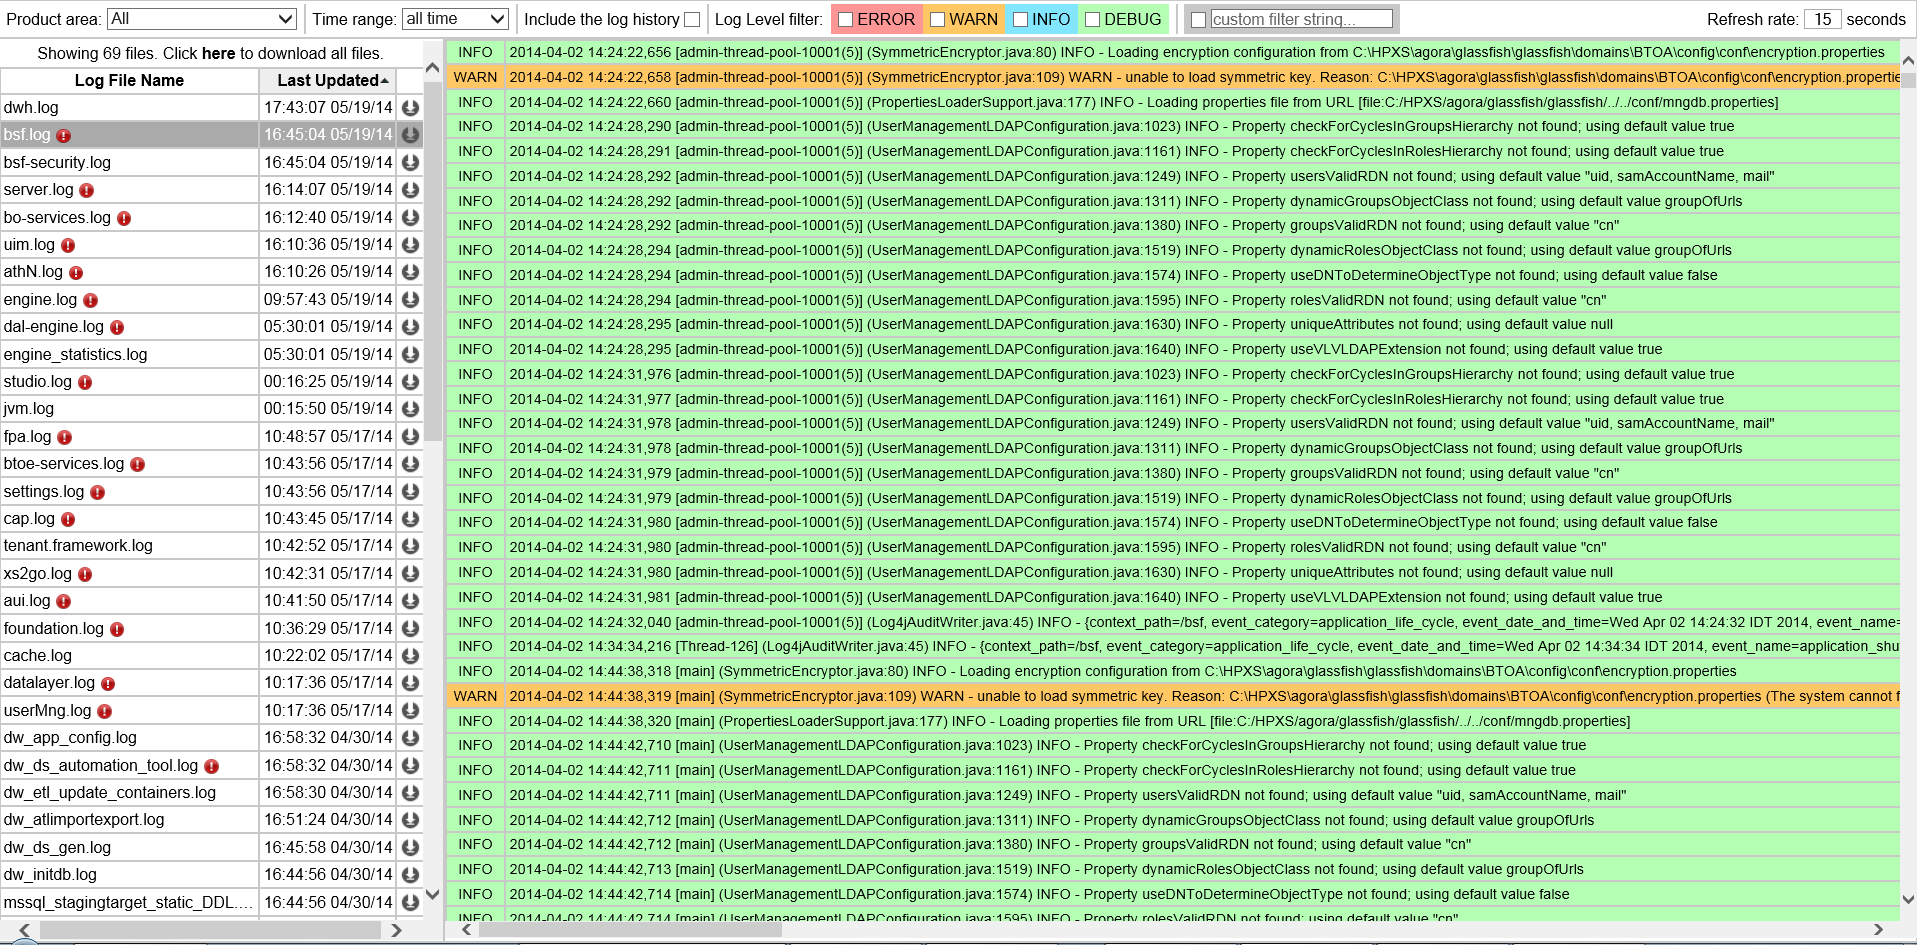
User interface elements are described below (when relevant, unlabeled elements are shown in angle brackets):
| UI Element |
Description |
|---|---|
| Product area |
Filter the logs by their product area:
Note You can edit the product area in the $HPBA_Home/conf/logGroupsConfig.xml file. |
| Time range |
Filter the logs that were created in the selected time range: All, 1min, 5 min, Last 15 min, Last 30 min, Last hour, or Last day. |
| Include the log history | Select to include the log history (the log files that were rotated; for example: <log_name>.log.1, <log_name>.log.2). |
| Log Level filter |
You can filter the log entries to display only the entries that start with the following strings: ERROR, WARN, INFO, DEBUG, or your own string. Note The ERROR filter also includes the stack trace of the error. |
| Refresh rate (in seconds) |
The rate of refresh of the log list and the update check interval of the currently opened log file, in seconds. Default: 15 |
| <Message> |
Showing <nn> files. The message displays the number of logs. Click here to download all files. Creates a .ZIP file of all the listed logs. |
| Log File Name |
The log files filtered for the product area and the time range. Click the log name to display its details.
Click the arrow in the column header to sort the list. |
| Last Updated |
The date and time when the log was last updated. Click the arrow in the column header to sort the list. By default, the table is sorted by the Last Updated in descending order. |

|
Click to download the selected log file (not in ZIP format). |
| <Log details area> |
The contents of the selected log. Select the relevant Log Level filter to display only the log entries that start with the string. Example: When you select ERROR, the log details area displays:
|
 indicates that the log includes errors within the selected time range.
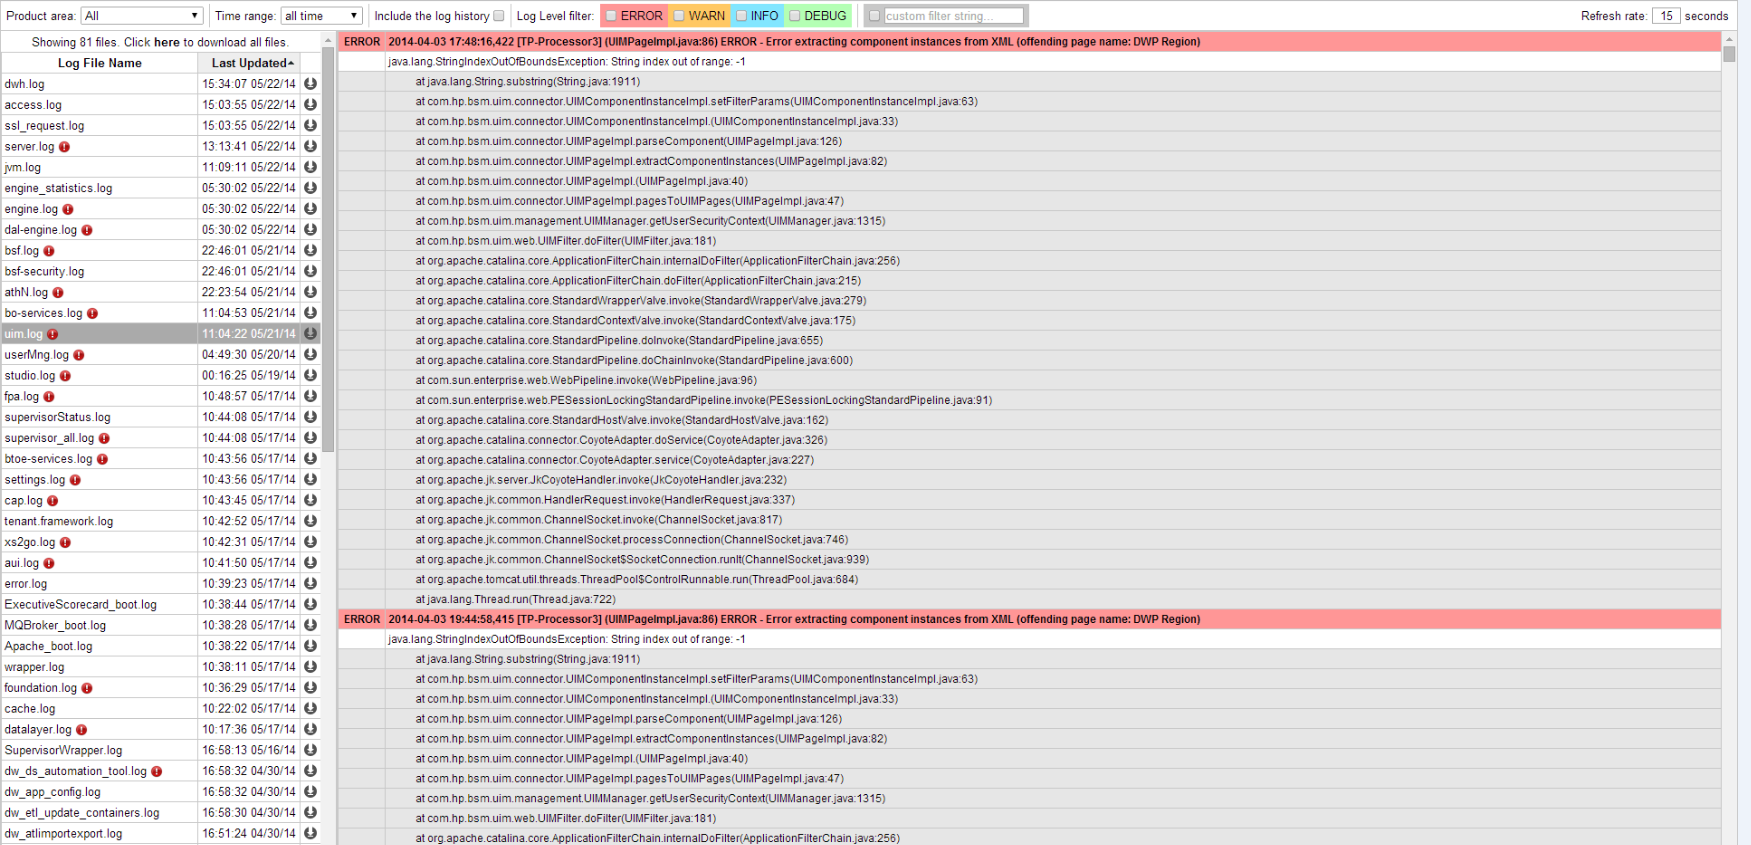
We welcome your comments!
To open the configured email client on this computer, open an email window.
Otherwise, copy the information below to a web mail client, and send this email to SW-Doc@hpe.com.
Help Topic ID:
Product:
Topic Title:
Feedback: