
Searching the Help
To search for information in the Help, type a word or phrase in the Search box. When you enter a group of words, OR is inferred. You can use Boolean operators to refine your search.
Results returned are case insensitive. However, results ranking takes case into account and assigns higher scores to case matches. Therefore, a search for "cats" followed by a search for "Cats" would return the same number of Help topics, but the order in which the topics are listed would be different.
| Search for | Example | Results |
|---|---|---|
| A single word | cat
|
Topics that contain the word "cat". You will also find its grammatical variations, such as "cats". |
|
A phrase. You can specify that the search results contain a specific phrase. |
"cat food" (quotation marks) |
Topics that contain the literal phrase "cat food" and all its grammatical variations. Without the quotation marks, the query is equivalent to specifying an OR operator, which finds topics with one of the individual words instead of the phrase. |
| Search for | Operator | Example |
|---|---|---|
|
Two or more words in the same topic |
|
|
| Either word in a topic |
|
|
| Topics that do not contain a specific word or phrase |
|
|
| Topics that contain one string and do not contain another | ^ (caret) |
cat ^ mouse
|
| A combination of search types | ( ) parentheses |
|


![]()
![]()

- Get Started
- Step-by-step with Business Analytics
- Glossary
- Executive Personas and their Business Challenges
- The Business Analytics Solution
- IT Data Model
- Business Analytics Architecture
- Business Analytics UI Modules
- The Scorecard KPI Engine
- Dashboard Capabilities
- Content Acceleration Packs
- About KPIs, Metrics, Contexts, and Data Source Integration
- How Data is Included into Business Analytics
- Common Use Cases
- Customize KPIs, Metrics, Formulas, Filters, and Breakdowns
- Customize Objectives, Perspectives, Scorecards and Pages
- Customize Contexts
- Customize Content
IT Business Analytics includes several user interface modules.
Depending on their permissions the Administrator, the Business Analyst, and the Executives can view, manage, or administrate tabs, pages, components, and more.

 Dashboard
The Dashboard has several capabilities:
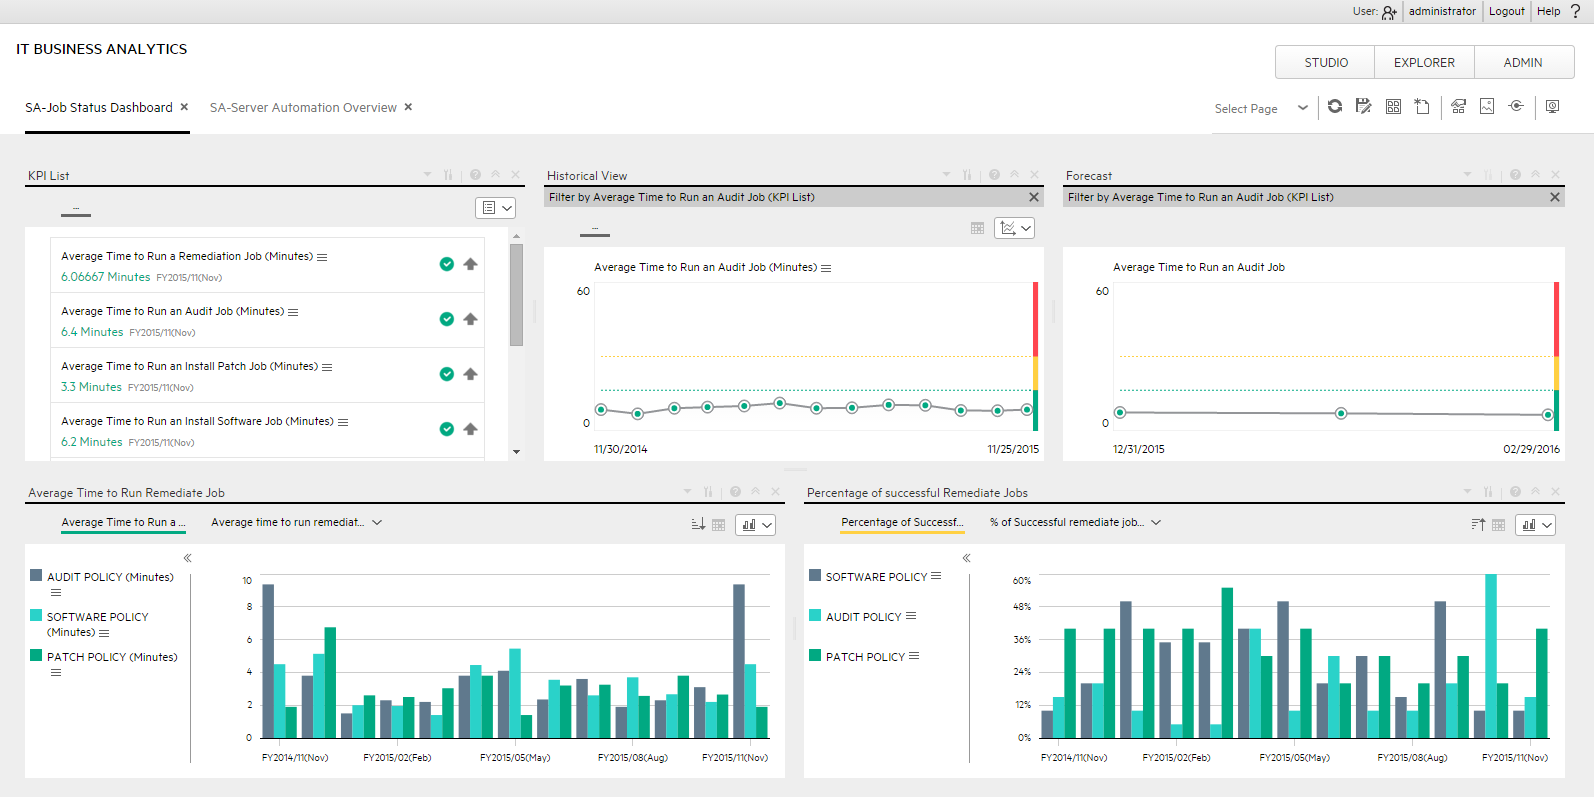
- The Dashboard mashup is where the Business Analyst can create pages and components, and can configure how to display the information that the Executive wants to see. The information is displayed on pages that can include one or more components. For details about what you can do in the Dashboard, see Dashboard Display.
- The Dashboard display is where the Executives view the pages relevant to the Executive role, can view how well their required objectives are doing, and can drill down to subordinates pages to breakdown the information and get a better understanding of the situation. For details about what the Executive can view in Dashboard, see View and Analyze the Business Objectives . For concept details about the Dashboard, see Dashboard Capabilities .
![]() Click to view an example of a Dashboard page
Click to view an example of a Dashboard page
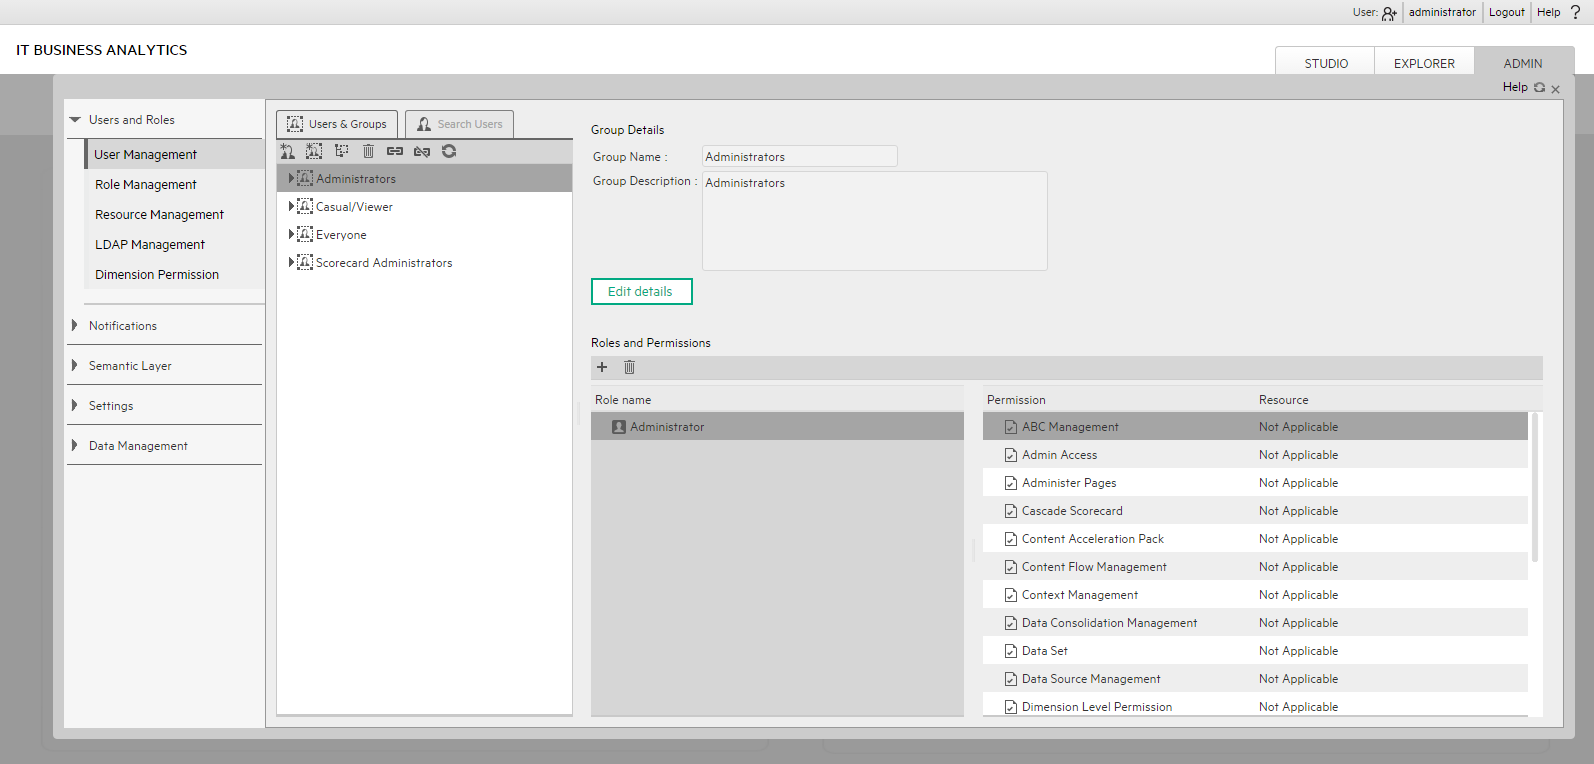
ADMIN tab
The component where the administrator sets the users, permissions and roles, and performs the administration and maintenance of ITBA and Data Warehouse. For details, see Getting Started with Administration Tasks
![]() Click to view an example of the Admin page
Click to view an example of the Admin page
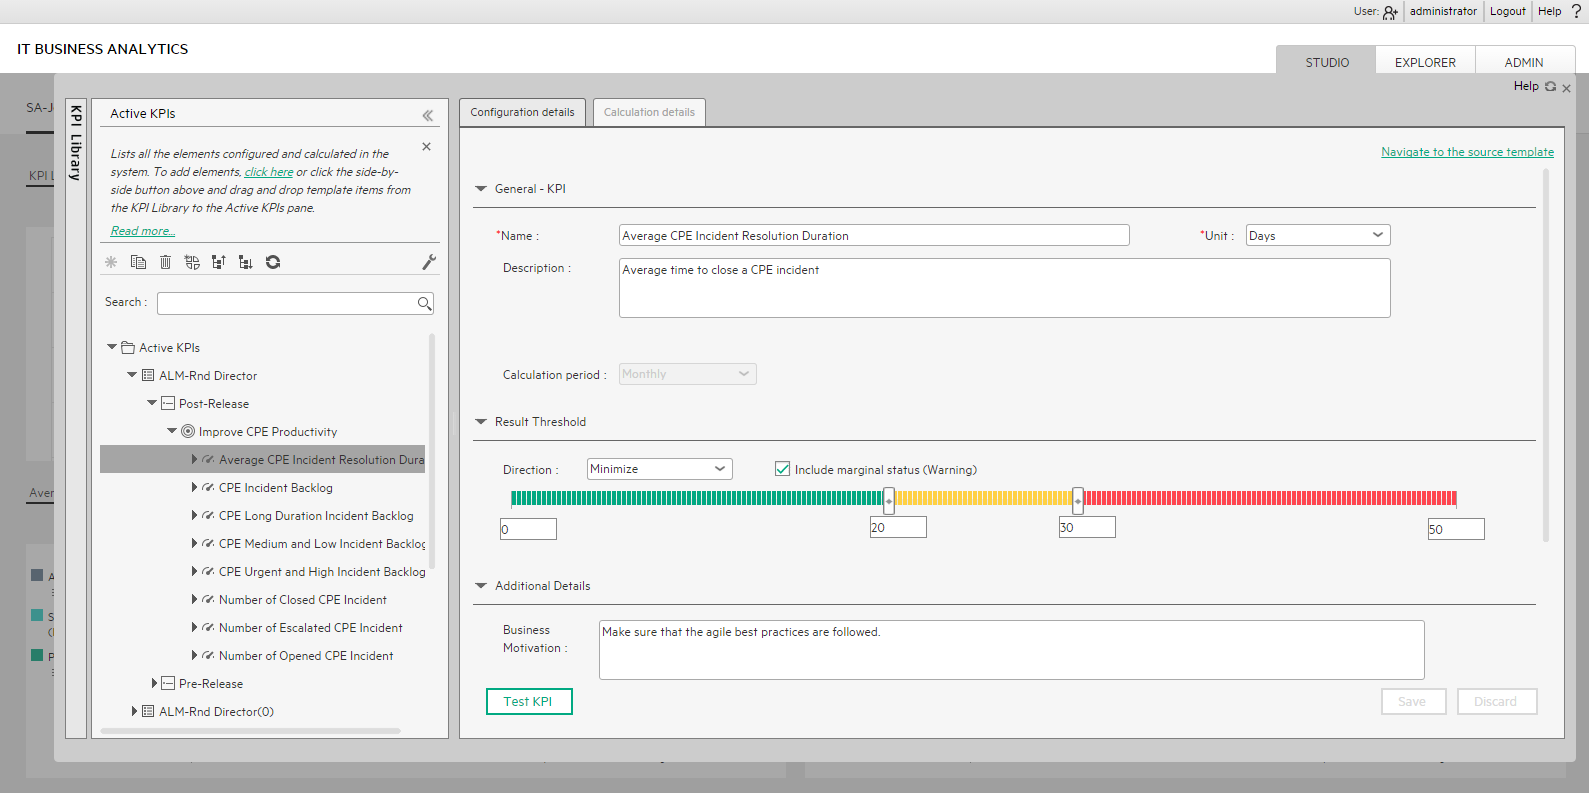
STUDIO tab
The Studio is where the Business Analyst creates and manages all the building elements that are used to create the displayed pages and components of the Executive Dashboard. In the Studio, the Business Analyst can:
- Manage Scorecards, Perspectives, Objectives, Metrics, Metric Breakdowns, KPIs, KPI Breakdowns, or Unassigned KPIs
- Change formulas or filter thresholds, and more. For concept details about the Studio, see Business Analytics Components . For details about what the Business Analyst can do in the Studio, see Learn About IT Business Analytics, Create the Dashboard Contents in the Studio or Enrich the Dashboard Contents in the Studio.
![]() Click to view an example of the Studio
Click to view an example of the Studio
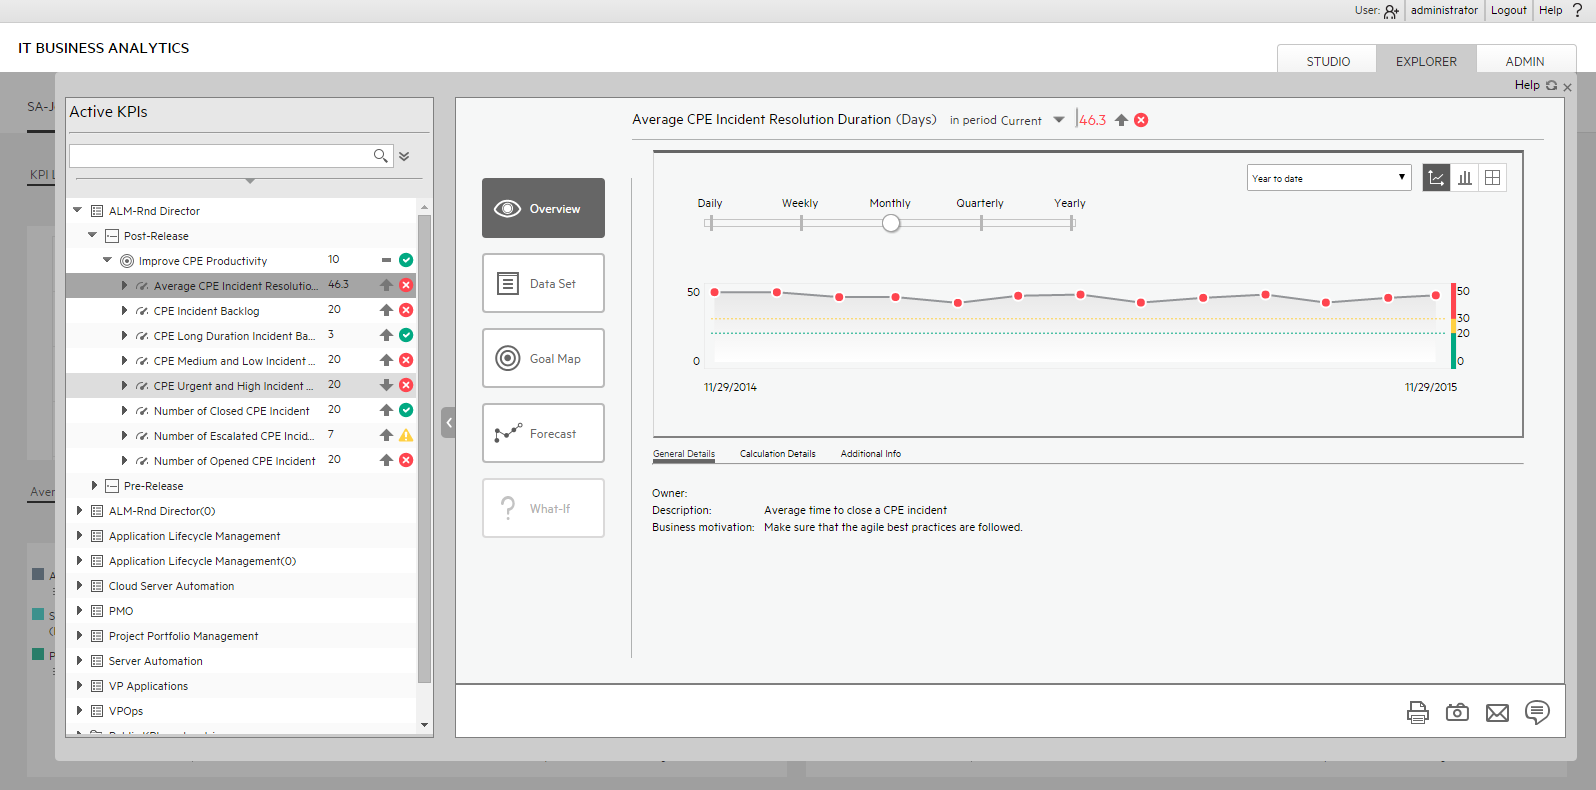
EXPLORER tab
The EXPLORER tab is where the executives can view overtime information about Scorecards, Perspectives, Objectives, KPIs, KPI Breakdowns, Metrics, Metric Breakdowns, or Unassigned KPIs, and can access other reports or external pages that display other facets of the situation. The executives usually access the EXPLORER tab in context, by drilling down from the relevant Objectives or KPIs in the Dashboard components. Executives can also add, edit, and email annotations regarding the elements displayed in the Explorer.
For details about the Explorer, see About Explorer . For details about what the Executive can view in Explorer, see View and Analyze the Business Objectives .
![]() Click to view an example of the EXPLORER tab
Click to view an example of the EXPLORER tab
Application Toolbar
The application toolbar in the top right corner includes the following:
- User. Displays a picture of the current user.
You can select the relevant picture. For details, see Personalize a Dashboard Page . - <user_name>. The user name of the current user.
- Logout. Click the button to log off.
-
Help. Click to open a menu and select the relevant option:
- Help Center. Select to open the complete online documentation.
- Movies. Select to access a list of the ITBA movies. For details, see Access Movies .
- About. Select to view details about the version, patches, and Content Packs, as well as License information, and copyrights. For details about the licenses, see Licenses
We welcome your comments!
To open the configured email client on this computer, open an email window.
Otherwise, copy the information below to a web mail client, and send this email to SW-Doc@hpe.com.
Help Topic ID:
Product:
Topic Title:
Feedback: