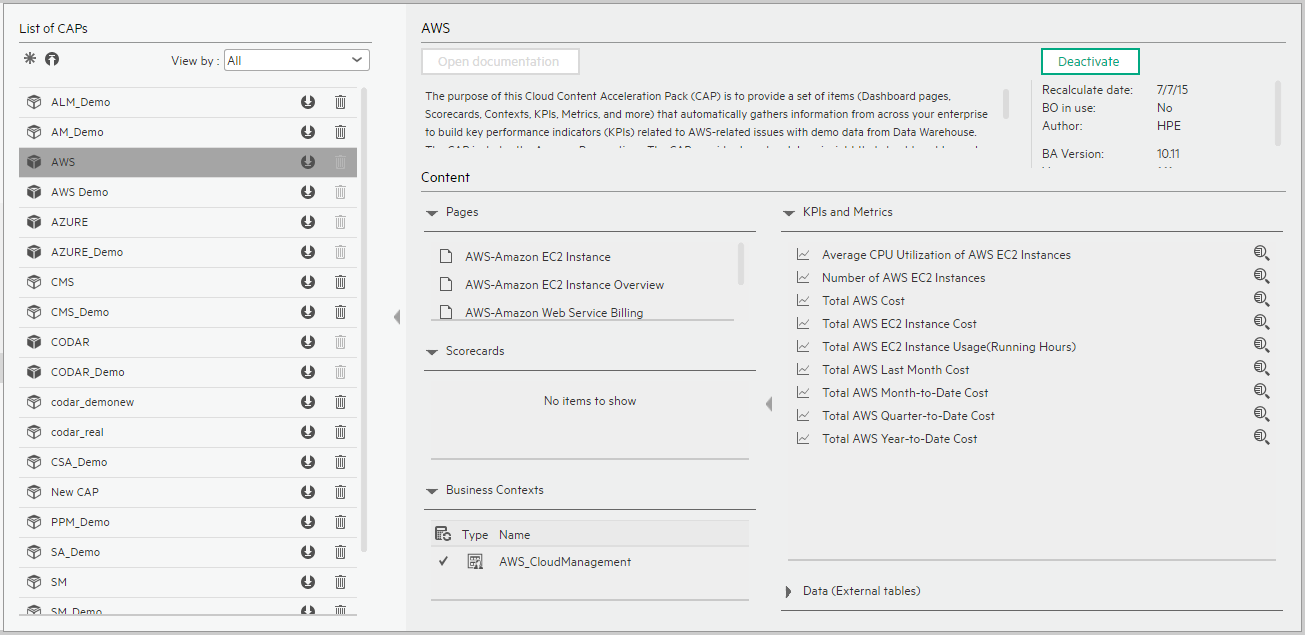
AWS_Demo and AWS CAPs

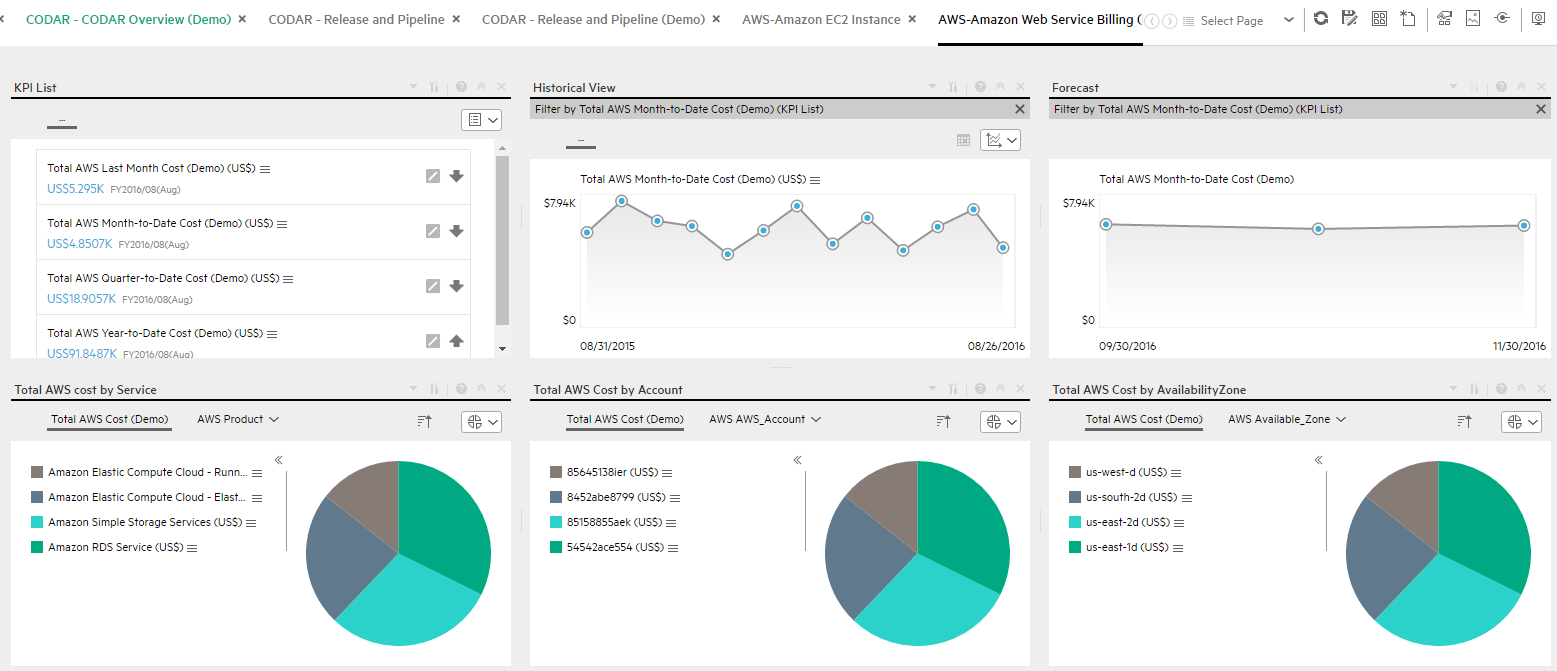
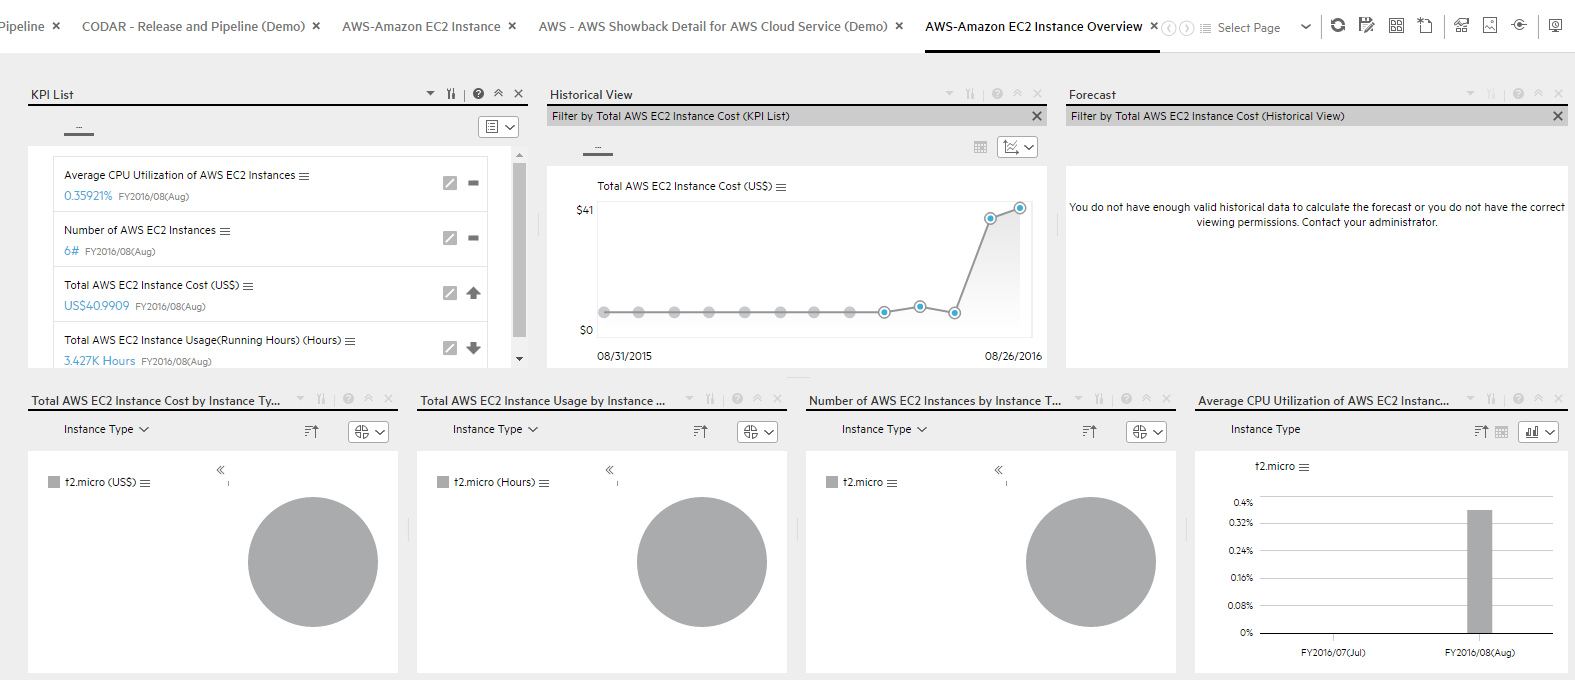
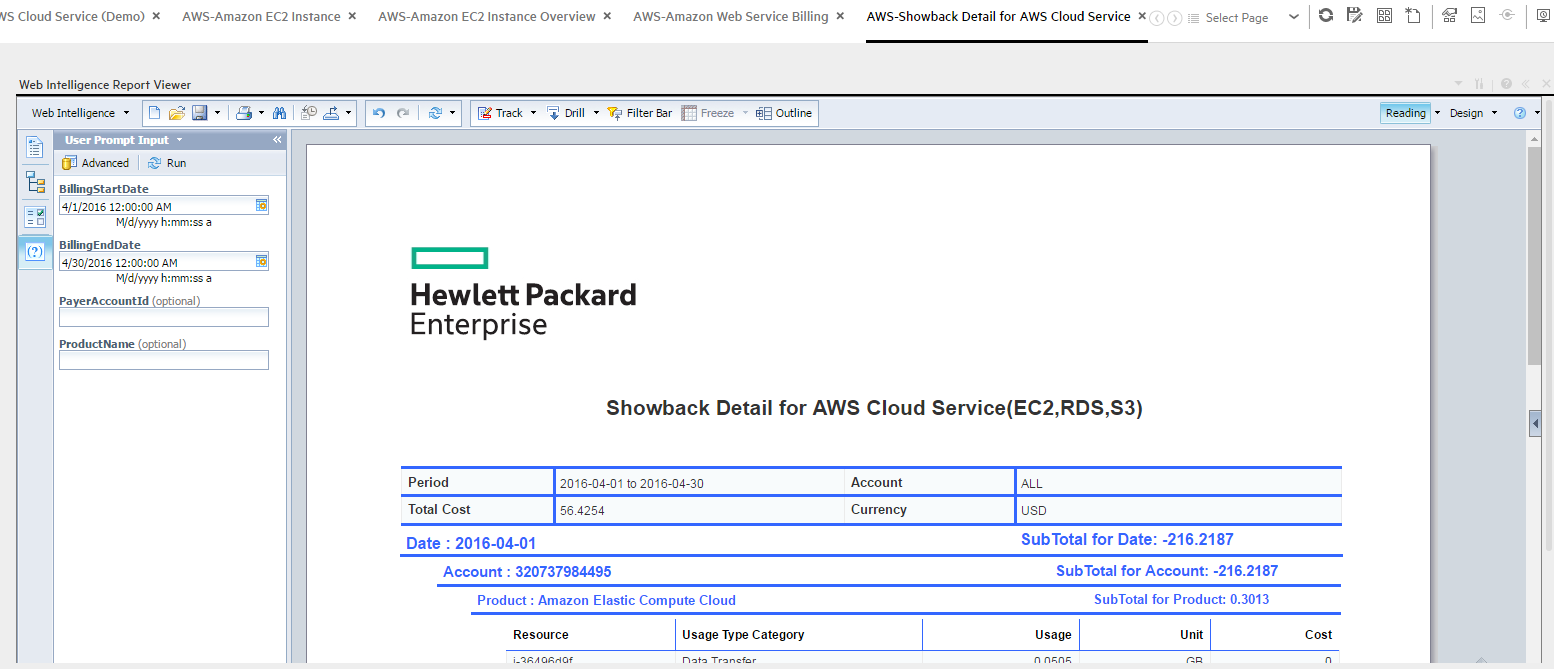
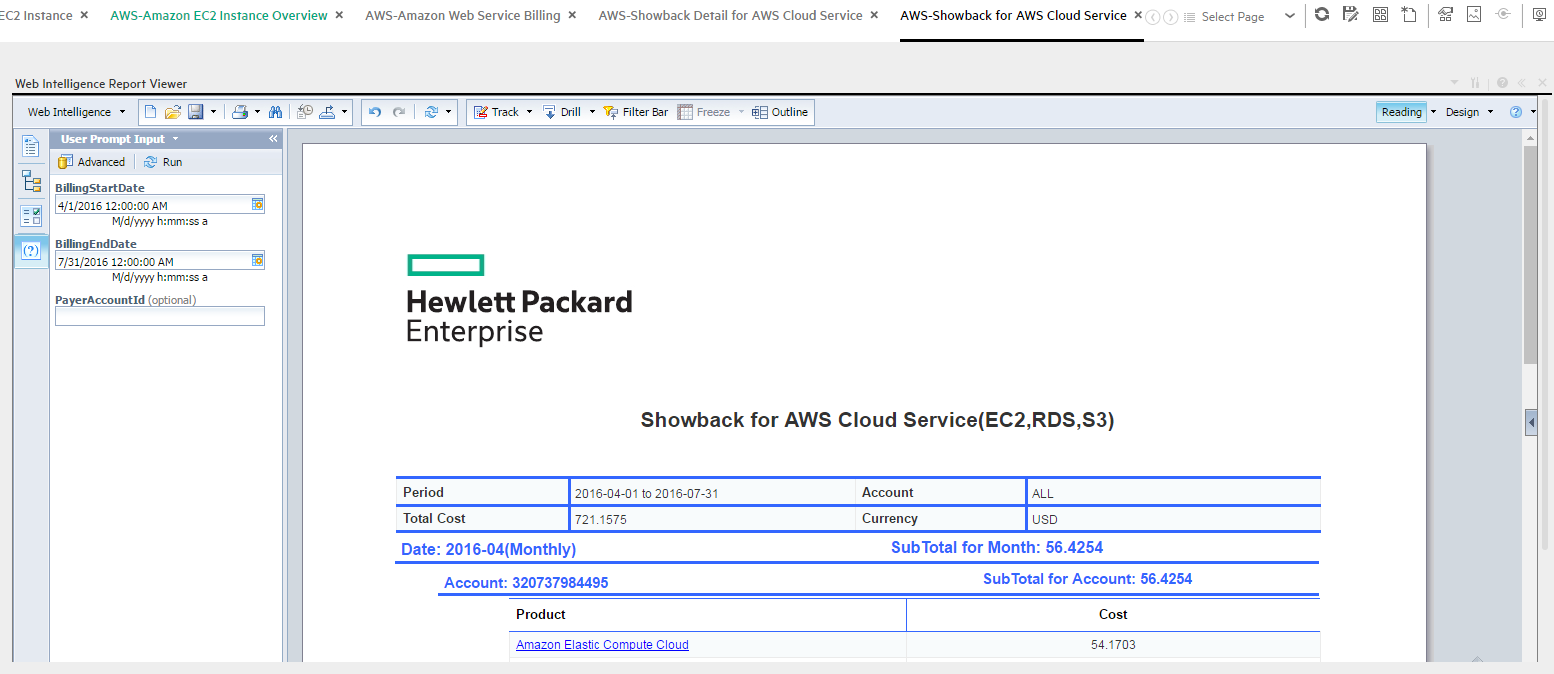
The purpose of the AWS_Demo and AWS Content Acceleration Packs (CAPs) is to provide a set of items (Scorecards, Contexts, KPIs, Metrics, and more) that automatically gathers information from across your enterprise to build key performance indicators (KPIs) related to Amazon Web Services-related issues with OOTB data from Data Warehouse as well as Dashboard pages that display the relevant information. The CAPs provide broad and deep insight that should enable you to Improve Staff Effectiveness, Improve Responsiveness, Achieve Process Excellence, Improve Quality of Delivery, and Improve Customer Satisfaction. This CAP provides a 360 degree AWS view.

The AWS_Demo is based on data in .csv files that are part of the CAP package.

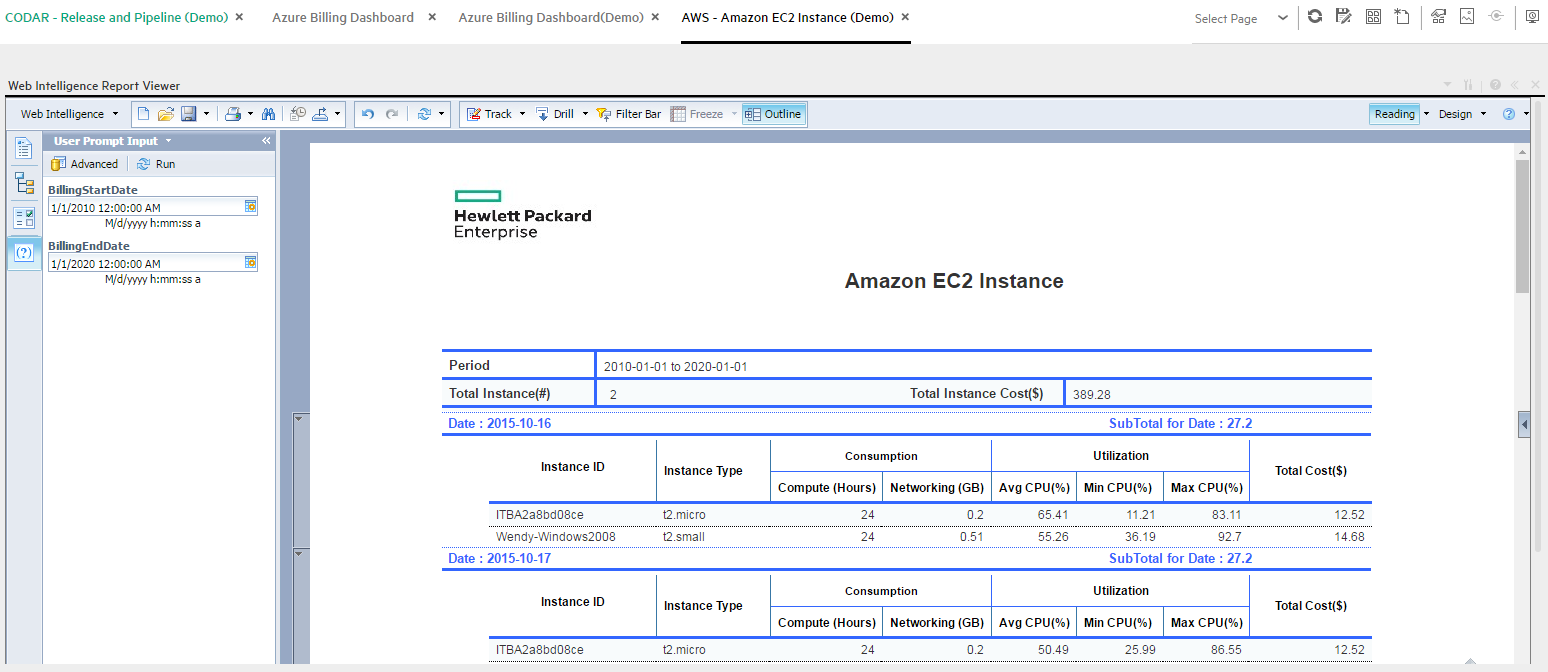
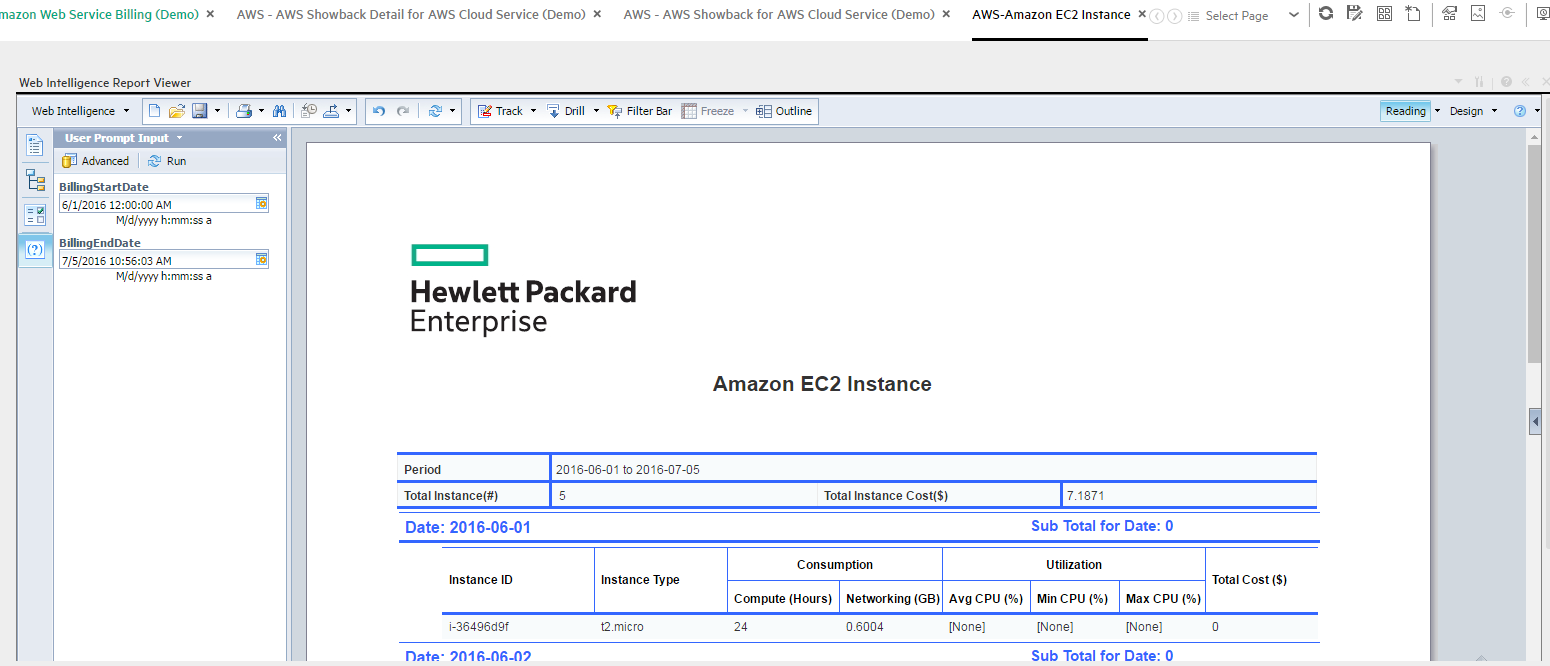
Note To view data in the AWS-related reports, make sure you have installed BOE.

The relevant content pack is AWS. For details, see Integration with AWS.

ClosedUser Story

Nowadays, more and more IT organizations have decided to move their traditional IT infrastructure to the public cloud environment. Amazon Web Service (AWS) is one of the top public cloud vendor in the market.

Chris is the Cloud Service Manager of the IT organization at ABC Inc. He needs to have a clear picture on the spending of the IT organization on the AWS cloud service.

Chris uses ITBA, a business intelligence solution that leverages analytical functions to help him monitor all Amazon cloud service such as EC2, RDS, S3, Load Balancer, etc.…

During his daily work, he logs into ITBA and opens the AWS Billing page in the Dashboard to have an overall view of the IT organization spending.

  1. In the AWS Billing Dashboard page, the KPI List View component show the latest month AWS cost, the previous month AWS cost, as well as the year-to-date AWS cost.

    In addition, in the Historical View component, he can see the trend of his AWS cloud cost, and in the Forecast View component the upcoming 3 months AWS cost forecasting.

    Below that, the three Cluster Bar Chart View components show the AWS cost broken down by service, account, and available zone. Using this information, Chris can analyze the AWS cost in the different layers to have more insight on the AWS cloud spending.

  2. Then Chris opens the AWS EC2 Dashboard page for AWS EC2 usage and cost analysis.

    In the AWS EC2 Dashboard page, the KPI List View component show the number of used AWS EC2 instances, the total AWS EC2 usage (hours), and the total AWS EC2 cost.

    In addition, the Historical View component shows the trends of the organization AWS EC2 usage, cost. In the Forecast View component, Chris can see the upcoming 3 months AWS EC2 cost forecasting.

    Below that, in the three Cluster Bar Chart View components, Chris can view the total AWS EC2 cost broken down by instance type, the number of used AWS EC2 instance broken down by instance type, and the total AWS EC2 usage (hours) broken down by instance type.

  3. For AWS cloud detail usage and cost information, Chris opens the AWS Showback reports and links to the AWS Showback Details reports which list all the detailed costs at each instance level.

ClosedAWS_Demo and AWS

User interface elements are described below (when relevant, unlabeled elements are shown in angle brackets):

UI Element

Description

Pages

AWS - AWS Showback Detail for AWS Cloud Service (Demo) Page

AWS - AWS Showback for AWS Cloud Service (Demo) Page

AWS - Amazon EC2 Instance (Demo) Page

AWS - Amazon EC2 Instance Overview (Demo) Page

AWS - Amazon Web Service Billing (Demo) Page

AWS - Amazon EC2 Instance Page

AWS - Amazon EC2 Instance Overview Page

AWS - Amazon Web Service Billing Page

AWS - Showback Details for AWS Cloud Service Page

AWS - Showback for AWS Cloud Service Page

Scorecards

N/A

Business Contexts
  • AWS_Demo
  • AWS_CloudManagement

For details, see Semantic Layer - Contexts and Universes.

KPIs and Metrics

Note The Demo CAP includes KPIs with names followed by (Demo). The CAP includes the same KPIs with names that do not include (Demo). The KPIs are the same but have different names so that both the Demo CAP and the CAP can be activated at the same time.

Average CPU Utilization of AWS EC2 Instances Metric. The average of percentages of CPU utilization at AWS EC2 instance level.

Number of AWS EC2 Instances Metric. The total number of EC2 instances consumed on AWS Elastic Compute Cloud (EC2) during the measurement period.

Total AWS Cost Metric. The total cost of services provided by AWS during the measurement period.

Total AWS EC2 Instance Cost Metric. The total cost of services provided by AWS Elastic Compute Cloud (EC2) during the measurement period.

Total AWS EC2 Instance Usage (Running Hours) Metric. The total number of hours consumed on AWS Elastic Compute Cloud (EC2) during the measurement period.

Total AWS Last Month Cost Metric. The total cost of services provided by AWS during the previous month

Total AWS Month-to-Date Cost Metric. The total cost of services provided by AWS for the period starting at the beginning of the current month and ending at the current date.

Total AWS Quarter-to-Date Cost Metric. The total cost of services provided by AWS for the period starting at the beginning of the current quarter and ending at the current date.

Total AWS Year-to-Date Cost Metric. The total cost of services provided by AWS for the period starting at the beginning of the current year and ending at the current date.


Data (External Tables)

AWS_demo

ClosedAWS - AWS Showback Detail for AWS Cloud Service (Demo) Page

ClosedAWS - AWS Showback for AWS Cloud Service (Demo) Page

ClosedAWS - Amazon EC2 Instance (Demo) Page

ClosedAWS - Amazon EC2 Instance Overview (Demo) Page

ClosedAWS - Amazon Web Service Billing (Demo) Page

ClosedAWS - Amazon EC2 Instance Page

ClosedAWS - Amazon EC2 Instance Overview Page

ClosedAWS - Amazon Web Service Billing Page

ClosedAWS - Showback Details for AWS Cloud Service Page

ClosedAWS - Showback for AWS Cloud Service Page