
Searching the Help
To search for information in the Help, type a word or phrase in the Search box. When you enter a group of words, OR is inferred. You can use Boolean operators to refine your search.
Results returned are case insensitive. However, results ranking takes case into account and assigns higher scores to case matches. Therefore, a search for "cats" followed by a search for "Cats" would return the same number of Help topics, but the order in which the topics are listed would be different.
| Search for | Example | Results |
|---|---|---|
| A single word | cat
|
Topics that contain the word "cat". You will also find its grammatical variations, such as "cats". |
|
A phrase. You can specify that the search results contain a specific phrase. |
"cat food" (quotation marks) |
Topics that contain the literal phrase "cat food" and all its grammatical variations. Without the quotation marks, the query is equivalent to specifying an OR operator, which finds topics with one of the individual words instead of the phrase. |
| Search for | Operator | Example |
|---|---|---|
|
Two or more words in the same topic |
|
|
| Either word in a topic |
|
|
| Topics that do not contain a specific word or phrase |
|
|
| Topics that contain one string and do not contain another | ^ (caret) |
cat ^ mouse
|
| A combination of search types | ( ) parentheses |
|


![]()
![]()

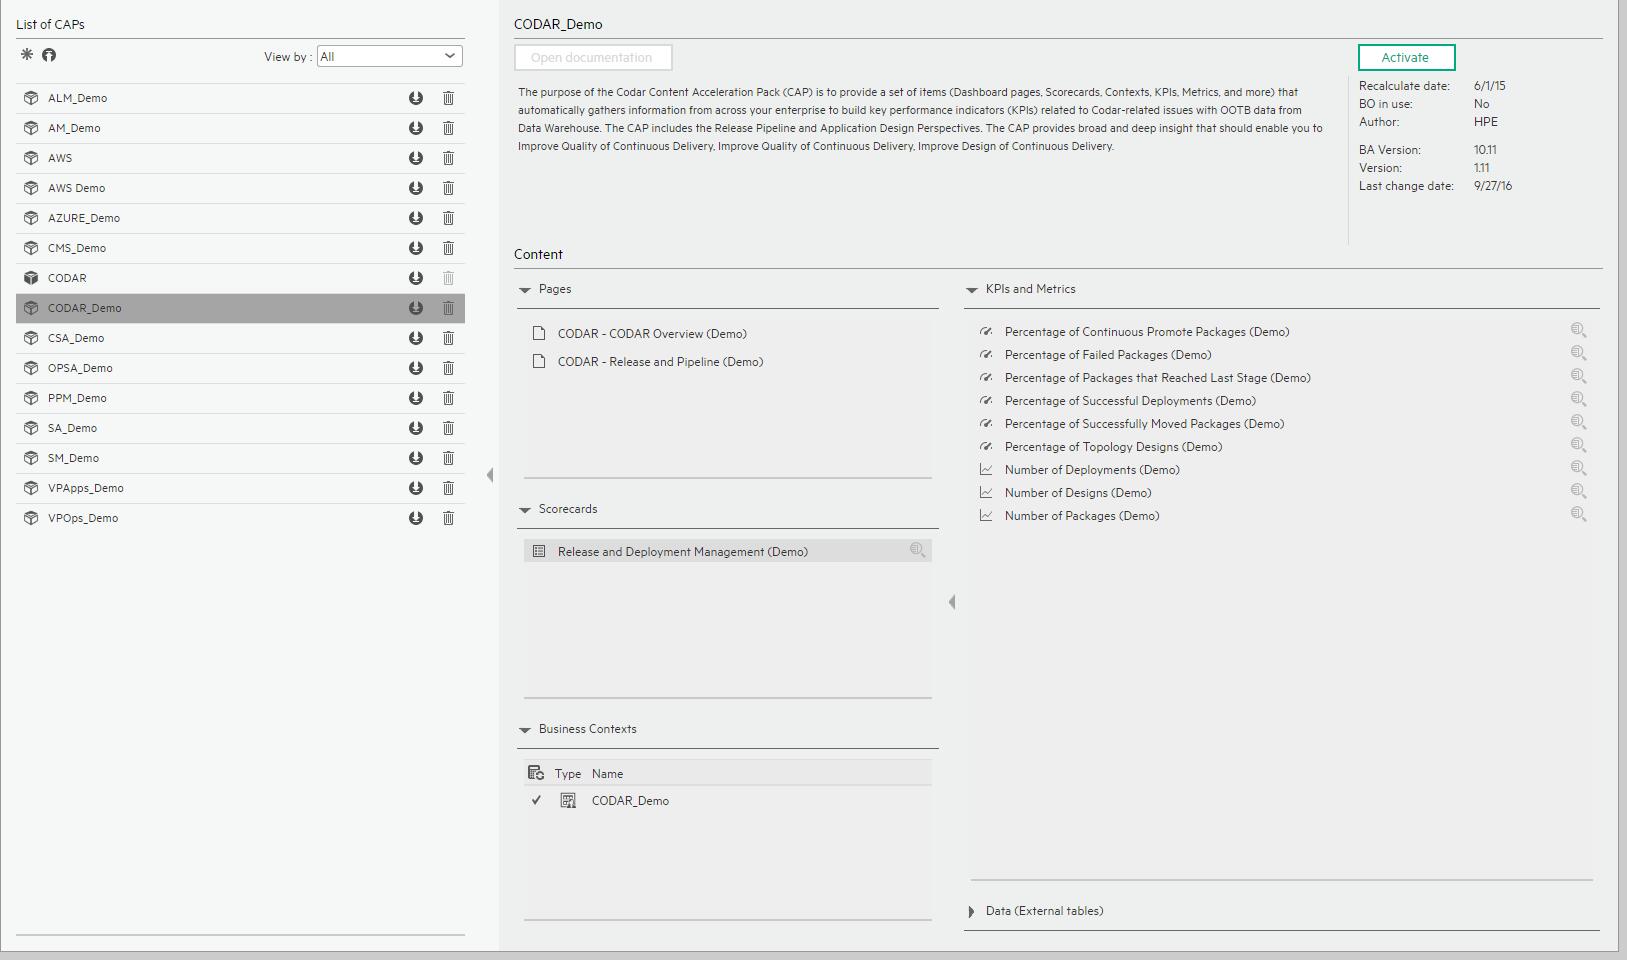
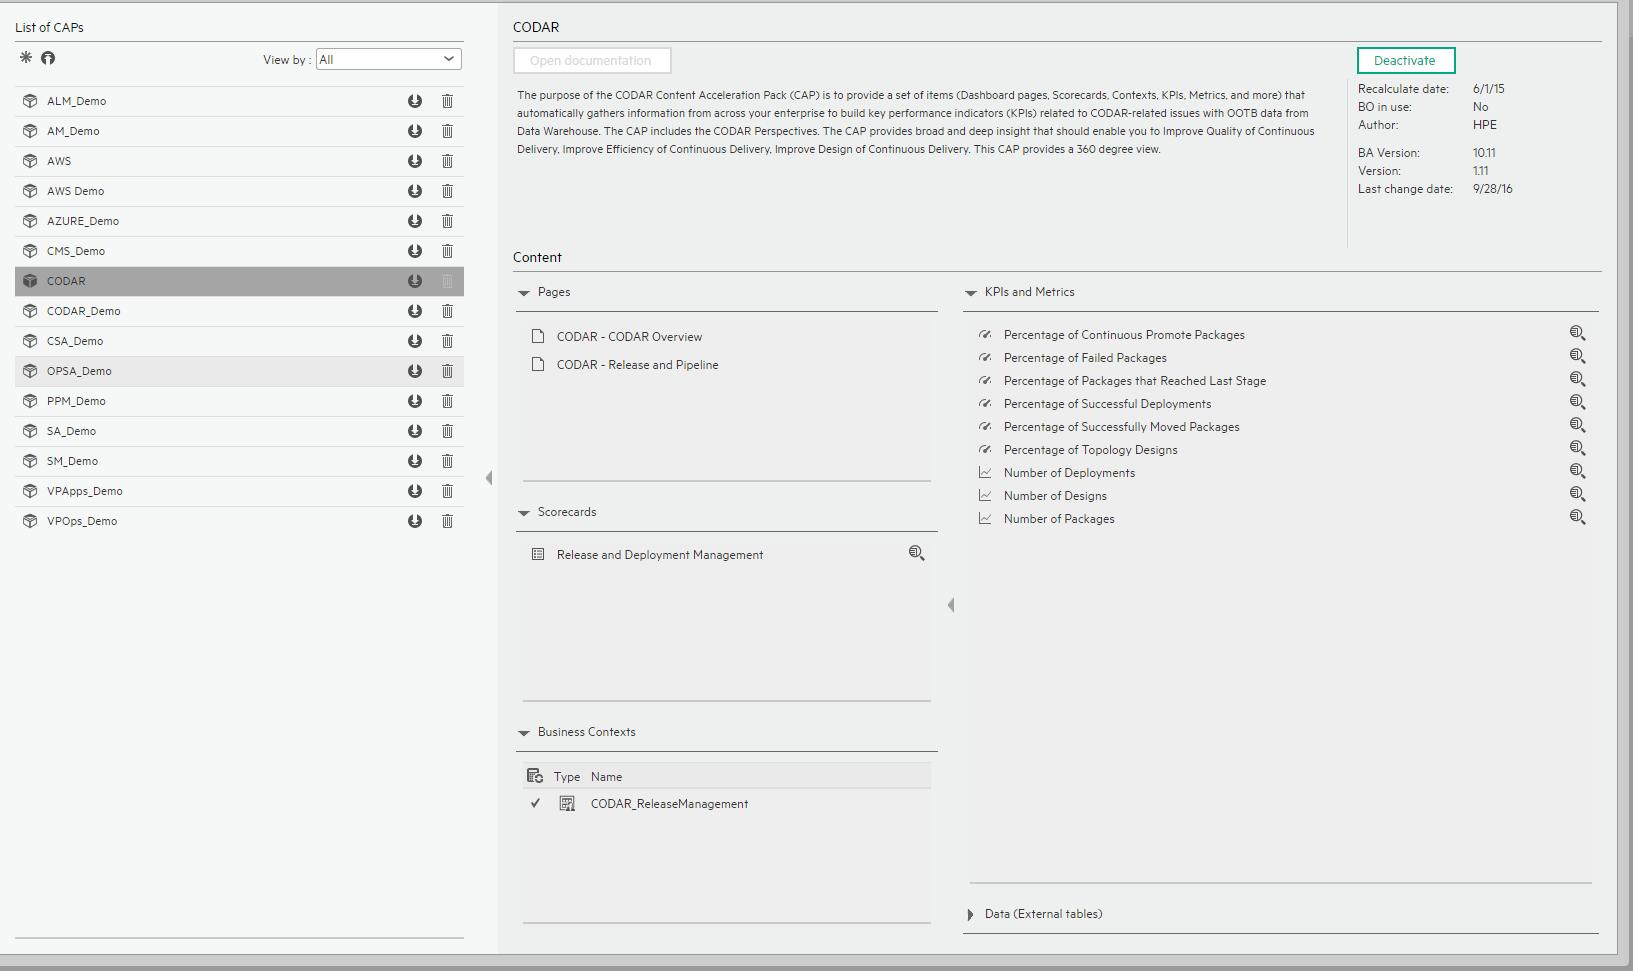
Codar_Demo and Codar CAPs
The purpose of the Codar_Demo and Codar Content Acceleration Packs (CAPs) is to provide a set of items (Scorecards, Contexts, KPIs, Metrics, and more) that automatically gathers information from across your enterprise to build key performance indicators (KPIs) related to Codar issues along with OOTB data from the Data Warehouse as well as Dashboard pages that display the relevant information. The CAP includes the Business Application Manager Perspectives. The CAP provides broad and deep insight that should enable you to improve Application Availability and improve Application Performance. This CAP provides a 360 degree Codar view.
The Codar_Demo is based on data in .csv files that are part of the CAP package and Codar CAPs include data from data sources.
The relevant content pack is Codar. For details, see Integration with Codar.
 User Story
Organizations are facing new challenges when extending continuous integration into continuous delivery. Especially for the IT department, now that the traditional IT is transforming into a hybrid cloud environment to deliver new features frequently and to get fast feedback from users.
Chris is the Release Manager of the IT Organization at ABC Inc. One of his main responsibility is to enable the automation of continuous delivery across heterogeneous environments.
In his daily work, he needs to ensure that all applications are deployed successfully through the different environments, and that all packages are moved successfully through the different environments.
-
To get an overview on the release and deployment management, Chris logs into the ITBA and opens the Codar Overview Dashboard page.
-
In the Codar Overview Dashboard page, he checks his predefined Objectives for Release Pipeline in the Scorecard component.
-
When he clicks on the Improve Quality of Continuous Delivery Objective, the KPI View component shows the Objective KPIs.
- The Percentage of Failed Packages KPI measures the overall failure rate of packages for all application across various environments.
- The Percentage of Successful Deployments KPI measures the overall successful rate of deployment for all application across various environments.
- The Percentage of Successfully Moved Packages KPI measures the overall successful rate of package moves from one stage to another for all applications across various environments.
- Additional KPIs show more information about application performance such as Percentage of Continuous Promotion of Packages, or Topology Design Ratio.
-
The Metric View component shows the trends regarding the number of packages, deployments, and designs that are created during the measure period.
-
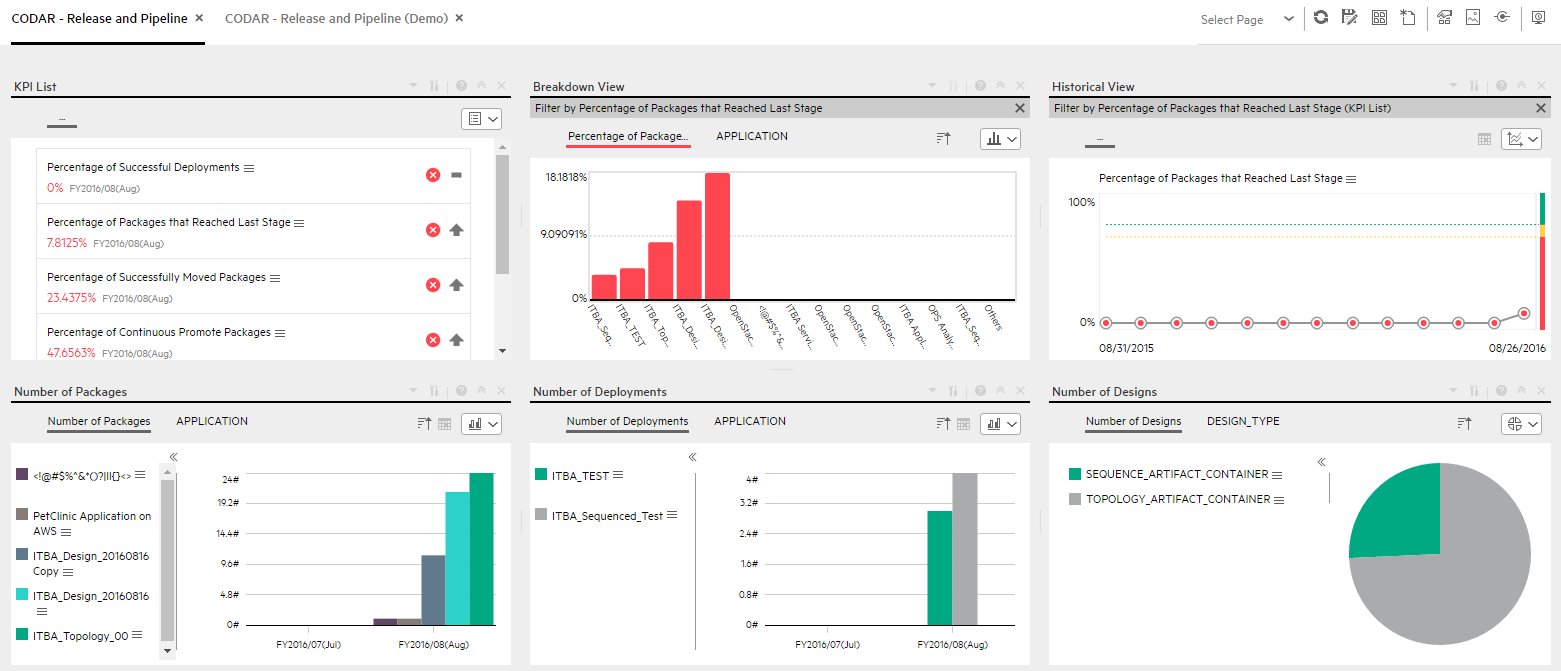
After Chris understands the overall status of the release and deployment management, he opens the Release Pipeline Dashboard page.
-
The release pipeline dashboard page is more specific, which enables him to measure the results of each KPI in the different layers.
-
Chris looks at the KPI View component, and finds that the status of the Percentage of Reached Packages KPI is red, which means that only very few packages have recently reached the last stage.
-
Meanwhile Chris also notices that the status of the Percentage of Failed Packages KPI is also red, so he suspects that low number of packages that have reached the last stage might be caused by a high number of failed packages.
-
By looking at the Breakdown View component, Chris tries, using different Breakdowns, to find why the status of the Percentage of Failed Packages KPI is red.
-
He finds that the Cloud Billing System application reached 90% of failed packages and is the cause of the red ratio of the KPI.
-
In the Historical View component, he sees that the trend started increasing in the last two weeks.
-
Investigating further, Chris also looks in the Cluster Bar Chart View component at the Number of Packages by Status KPI, where the pie clearly shows the number of packages failed compared to the total packages.
-
-
Chris then sends an annotation to Richard, the Application Owner of the Cloud Billing System requesting clarifications: "Richard – We have poor package success, please provide insight and set a plan by EOW".
-
When Richard gets the annotation from Chris, he checks his report and starts the analysis of the problem.
-
Richard then replies to Chris that he will initiate a meeting with the team to address the issue by EOW.
Codar_Demo and Codar CAPs
User interface elements are described below (when relevant, unlabeled elements are shown in angle brackets):
|
UI Element |
Description |
|---|---|
| Pages |
Codar - Release and Pipeline - (Demo) Page |
| Scorecards |
|
| Business Contexts |
For details, see Semantic Layer - Contexts and Universes. |
| KPIs and Metrics |
Note The Demo CAP includes KPIs with names followed by (Demo). The CAP includes the same KPIs with names that do not include (Demo). The KPIs are the same but have different names so that both the Demo CAP and the CAP can be activated at the same time. Percentage of Continuous Promote Packages KPI. The number of packages that are created externally with special permission during the measurement period. Percentage of Failed Packages KPI. The number of packages that failed during the measurement period relative to the total number of packages. >Percentage of Packages that Reached Last Stage KPI. The number of packages that have reached last stage during the measurement period relative to the total number of packages. Percentage of Successful Deployments KPI. The number of deployments that were successful during the measurement period relative to the total number of deployments. Percentage of Successfully Moved Packages KPI. The number of packages successfully moved from one stage to another relative to the total number of packages during the measurement period. Percentage of Topology Designs KPI. The number of topology designs that were created relative to the total number of designs during the measurement period Number of Deployments Metric. The number of Deployments that are created during the measurement period. Number of Designs Metric. The number of topology designs that were created during the measurement period. Number of Packages Metric. The number of packages that were created during the measurement period (3 months at most). |
| Data (External Tables) |
Codar_Demo |
Codar - Release and Pipeline - (Demo) Page

Codar - Overview (Demo) Page

Codar - Release and Pipeline Page
Codar - Overview Page

We welcome your comments!
To open the configured email client on this computer, open an email window.
Otherwise, copy the information below to a web mail client, and send this email to SW-Doc@hpe.com.
Help Topic ID:
Product:
Topic Title:
Feedback: