
Searching the Help
To search for information in the Help, type a word or phrase in the Search box. When you enter a group of words, OR is inferred. You can use Boolean operators to refine your search.
Results returned are case insensitive. However, results ranking takes case into account and assigns higher scores to case matches. Therefore, a search for "cats" followed by a search for "Cats" would return the same number of Help topics, but the order in which the topics are listed would be different.
| Search for | Example | Results |
|---|---|---|
| A single word | cat
|
Topics that contain the word "cat". You will also find its grammatical variations, such as "cats". |
|
A phrase. You can specify that the search results contain a specific phrase. |
"cat food" (quotation marks) |
Topics that contain the literal phrase "cat food" and all its grammatical variations. Without the quotation marks, the query is equivalent to specifying an OR operator, which finds topics with one of the individual words instead of the phrase. |
| Search for | Operator | Example |
|---|---|---|
|
Two or more words in the same topic |
|
|
| Either word in a topic |
|
|
| Topics that do not contain a specific word or phrase |
|
|
| Topics that contain one string and do not contain another | ^ (caret) |
cat ^ mouse
|
| A combination of search types | ( ) parentheses |
|


![]()
![]()

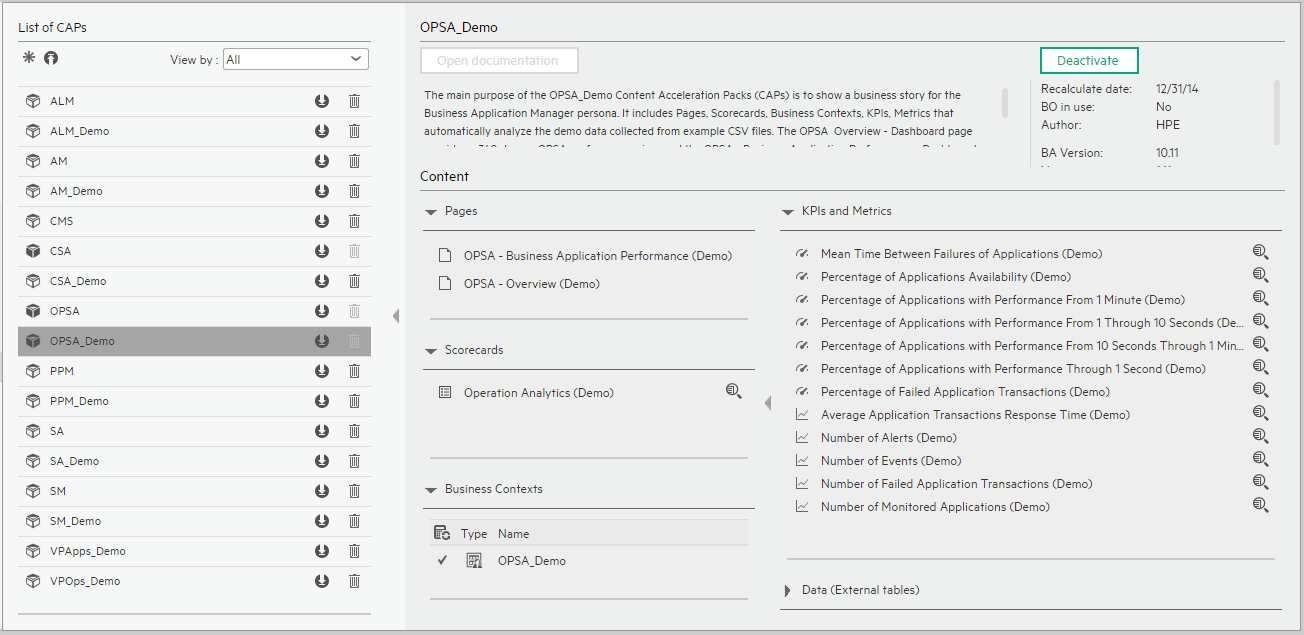
OPSA_Demo and OPSA CAPs
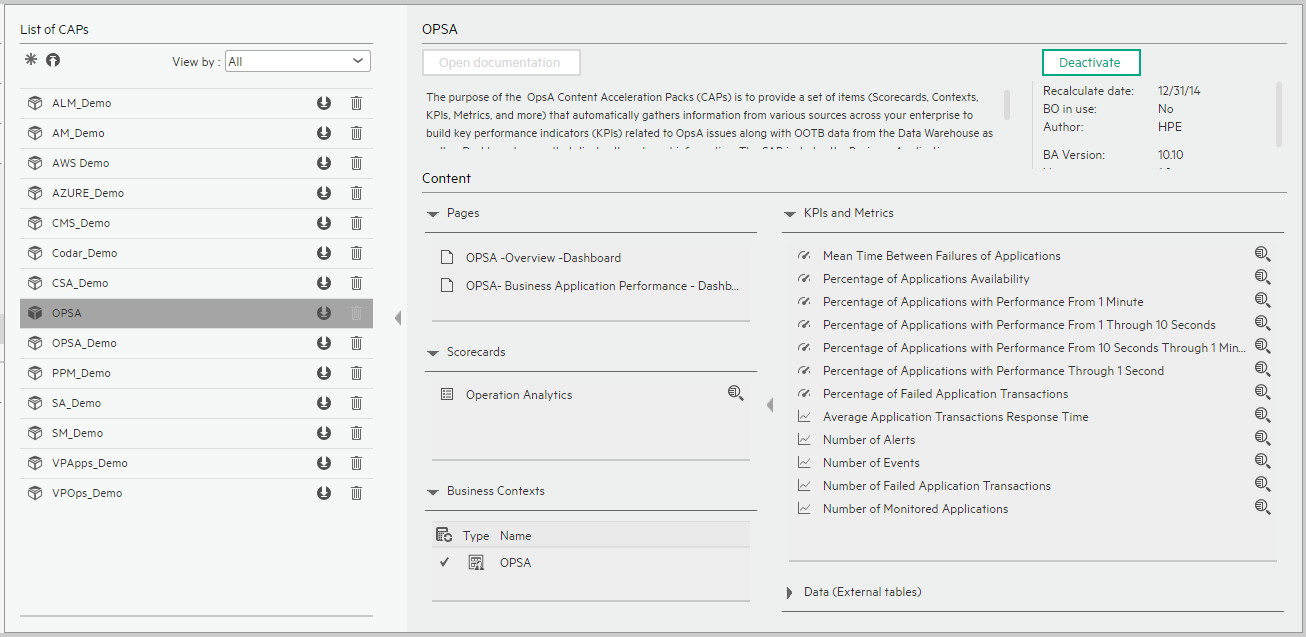
The main purpose of the OPSA Content Acceleration Packs (CAPs) is to show a business story for the Business Application Manager persona. It includes Pages, Scorecards, Business Contexts, KPIs, Metrics that automatically analyze the real data collected from one or multiple OPSA data source. The OPSA – Overview Dashboard page provides a 360 degree OPSA performance view, and the OPSA - Business Application Performance Dashboard page shows the relevant KPIs, historical trend, forecast, and the specific breakdown analytical views that help you track Application Availability, Application Performance and Reliability in one place.
The OPSA_Demo is based on data in .csv files that are part of the CAP package and OPSA CAPs include data from data sources.
The OPSA_Demo and OPSA Content Acceleration Packs (CAPs) are available to accelerate the integration with OPSA. For details, see OPSA_Demo and OPSA CAPs.
The relevant content pack is OPSA. For details, see Integration with OPSA.
 User Story
Measuring business applications is never easy. IT Organization are facing new challenges when traditional IT moves to the new style of IT.
Chris is the Business Application Manager of the IT organization at ABC Inc. One of his main responsibility is to ensure that all business-related applications are monitored and that their performance is meeting expectations. Chris uses ITBA, a Business Intelligence solution that leverages the analytical functions to help him monitor all business applications and identify the insights in the system to faster resolve the root cause of failures.
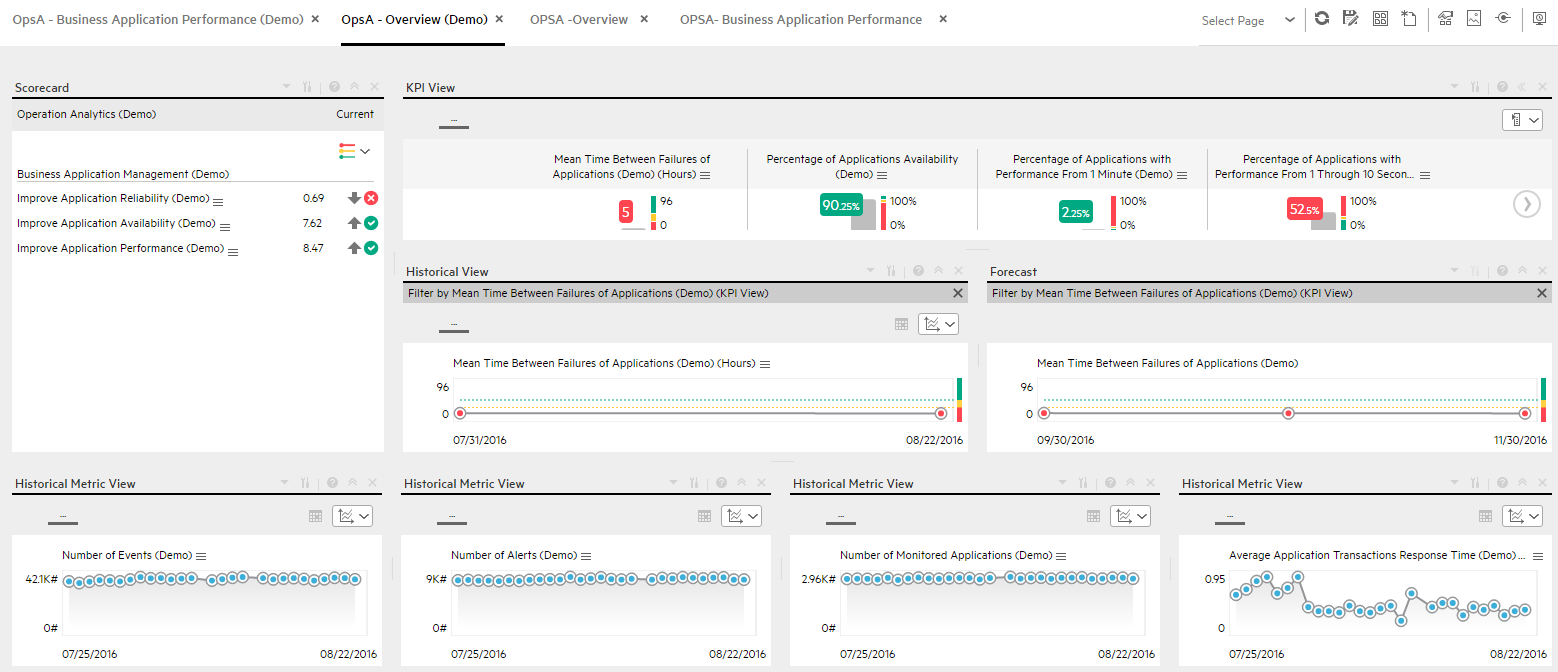
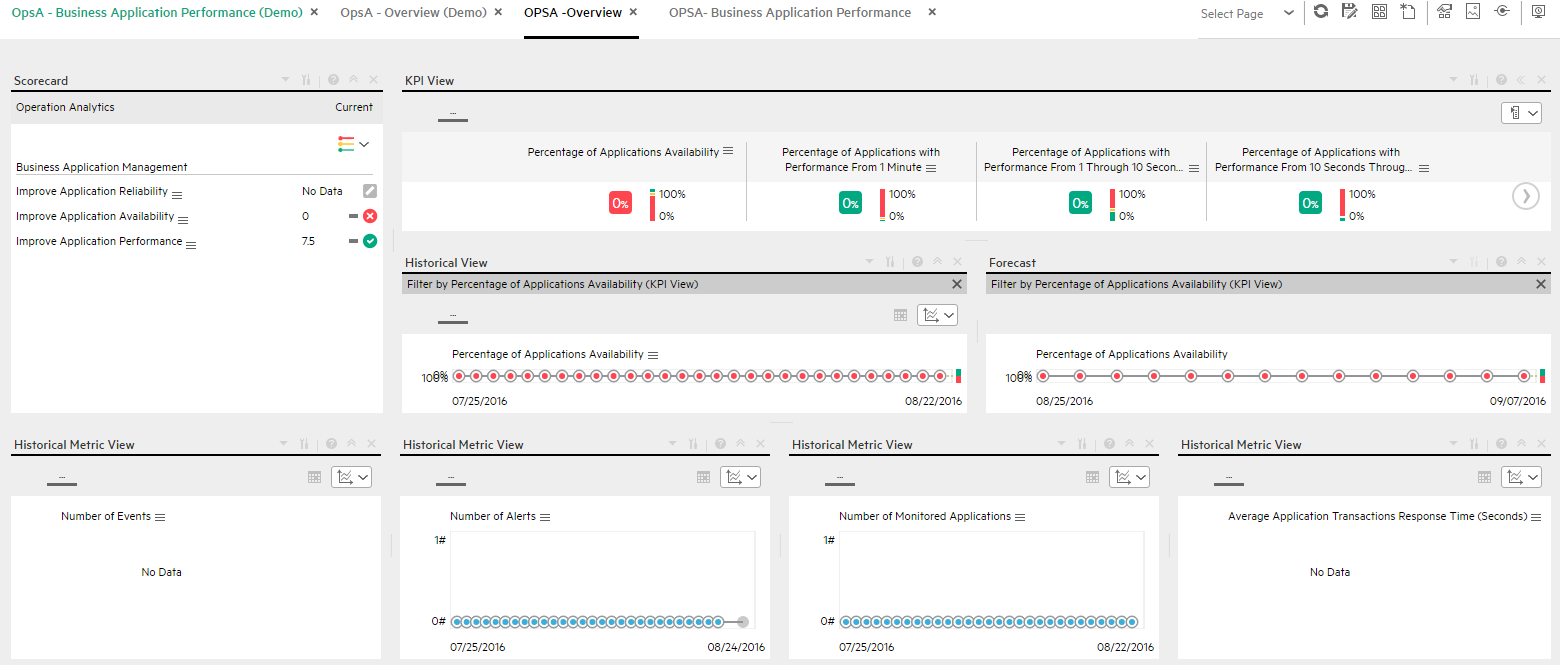
- During his daily work, he logs into ITBA and opens the OPSA Overview Dashboard page to first have an overall view on his measurements.
- In the OPSA Overview Dashboard page, he checks his predefined Objectives in the Scorecard component.
-
When he clicks on the Improve Application Availability Objective, the KPI View component shows the Objective KPIs.
- The Mean Time Between Failures of Applications KPI measures the average expected time between two failures for all the applications during the measurement period.
- The Percentage of Applications Availability KPI measures the availability rate of the applications during the measurement period.
- The Percentage of Failed Application Transactions KPI measures the failed rate of application transactions during the measurement period.
- Additional KPIs show more information about application performance such as Percentage of Applications Meeting 1 Second Performance, Percentage of Applications Meeting 10 Seconds Performance, Percentage of Applications Meeting 1 Minute Performance.
- The Metric View component shows the trends regarding the Number of Events, Alerts, Monitored Created Applications, and Average Application Transactions Response Time during the measurement period.
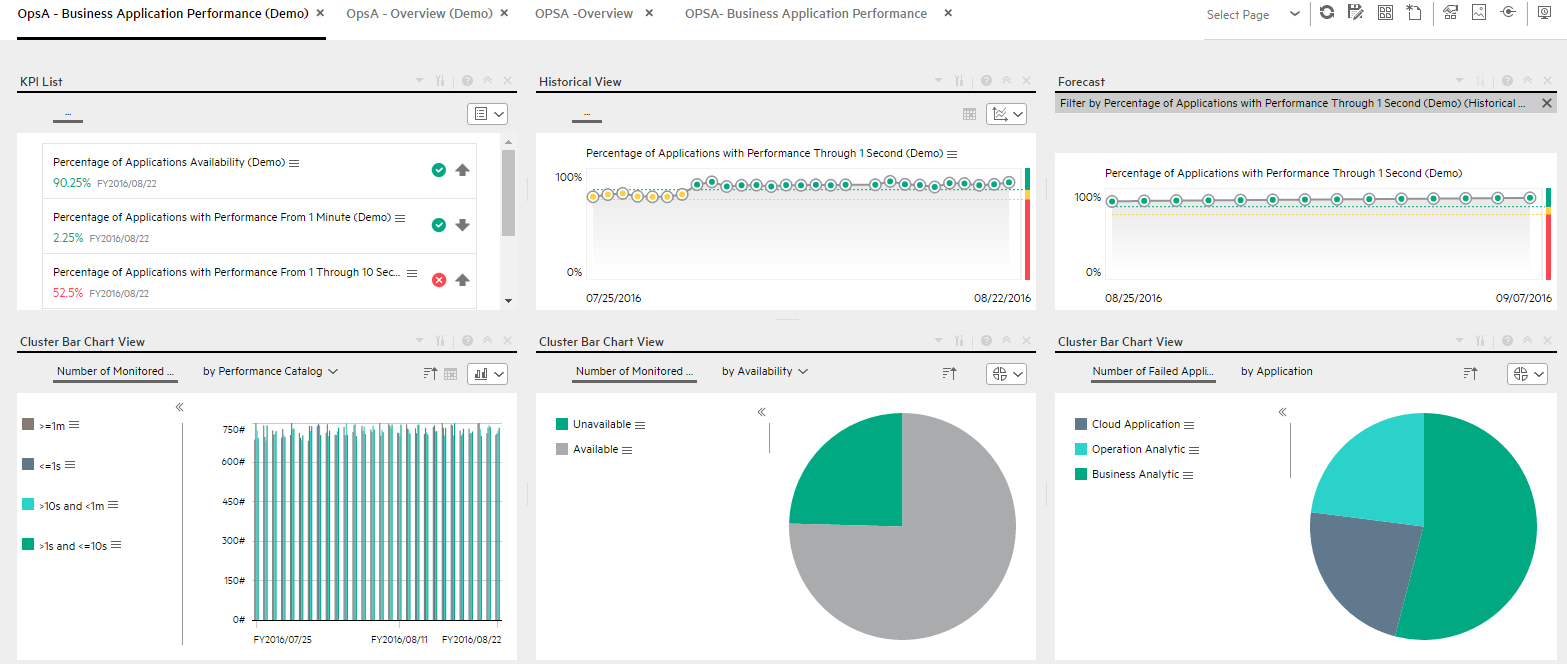
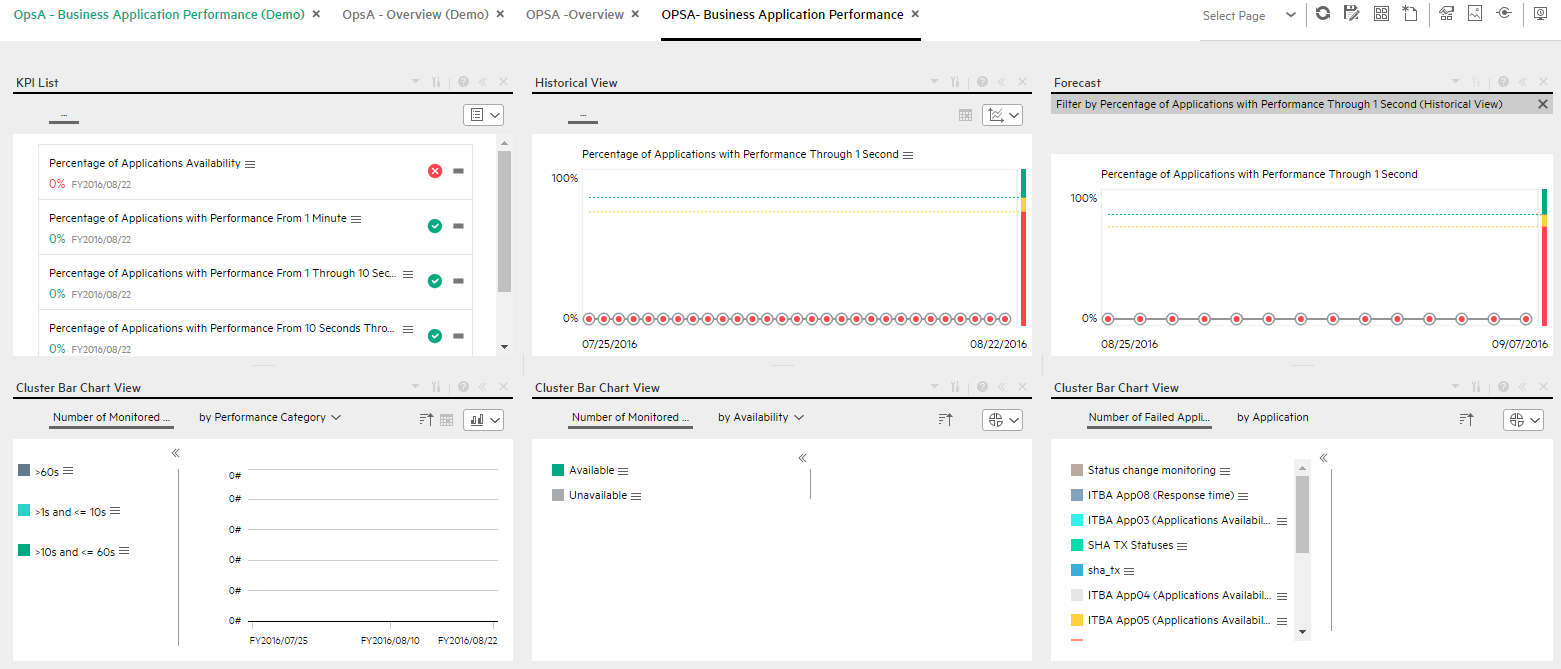
- After checking the overall status on Business Application Management, Chris opens the Business Application Performance Dashboard page for further information.
- The Business Application Performance Dashboard page is more specific as it measures the result of each KPI in the different layers.
- Chris checks the KPI View component, and finds that the statuses of the Percentage of Applications Meeting 10 Seconds Performance and Percentage of Applications Meeting 1 Minute Performance KPIs are red, which means that the applications cannot meet the performance baseline and have big performance issues.
- Meanwhile, Chris also finds that the Percentage of Available Applications KPI is also red, which means that the applications only recently became unavailable.
- He think that there might be some strong correlations between low application performance and application unavailability.
- In addition, in the Historical View component, he sees that the three KPIs trends have been decreasing for the last two weeks, so he decides that the team must return those abnormal states back to normal.
- Further, by looking at the Number of Applications by Availability KPI in the Bar Chart View component, he understands that there are currently two unavailable applications.
- He suspect that application unavailability might cause the problem. Looking at the Number of Failed Application Transactions by Applications KPI in the Cluster Bar Chart View component, he sees that two cloud-related applications have the top failed times. He decides to send an annotation to Richard, the owner of the Cloud System Application, requesting clarifications: "Richard – We have poor application performance, please provide insight and set a plan by EOW.
- When Richard gets the annotation from Chris, he checks his report and starts the analysis of the problem.
- Richard then replies to Chris that he will initiate a meeting with the team to address the issue by EOW.
OPSA_Demo and OPSA CAPs UI
User interface elements are described below (when relevant, unlabeled elements are shown in angle brackets):
|
UI Element |
Description |
|---|---|
| Pages |
OPSA - Business Application Performance (Demo) Page |
| Scorecards |
|
| Business Contexts |
For details, see Semantic Layer - Contexts and Universes. |
| KPIs and Metrics |
Note The Demo CAP includes KPIs with names followed by (Demo). The CAP includes the same KPIs with names that do not include (Demo). The KPIs are the same but have different names so that both the Demo CAP and the CAP can be activated at the same time. Mean Time Between Failures of Applications KPI. Mean time between failures of applications (MTBF) describes the expected time between two failures for a repairable system. The MTBF calculates the sum of lengths of the application available periods (downtime- uptime) divided by the number of observed application failures. Percentage of Applications Availability KPI. The number of available applications relative to the total number of applications during the measurement period. Percentage of Applications with Performance From 1 Minute KPI. The number of applications with an average performance response time > 1 minute relative to the total number of applications during the measurement period. >Percentage of Applications with Performance From 1 Through 10 Seconds KPI. The number of applications with an average performance response time > 1 and <= 10 seconds relative to the total number of applications during the measurement period. Percentage of Applications with Performance From 10 Seconds Through 1 Minute KPI. The number of applications with an average performance response time > 10 seconds and <= 1 minute relative to the total number of applications during the measurement period. Percentage of Applications with Performance Through 1 Second KPI. The number of applications with an average performance response time <= 1 second relative to the total number of applications during the measurement period. Percentage of Failed Application Transactions KPI. The number of failed application transactions relative to the total number of application transactions during the measurement period. Average Application Transactions Response Time Metric.The average response time for application transactions during the measurement period. Number of Alerts Metric. Number of Alerts in OpsA during the measurement period Number of Events Metric. Number of Events in OpsA during the measurement period Number of Failed Application Transactions Metric. The number of failed applications transactions that failed during the measurement period. Number of Monitored Applications Metric. The number of applications monitored during the measurement period. |
| Data (External Tables) |
|
OPSA - Business Application Performance (Demo) Page
OPSA - Overview (Demo) Page
OPSA - Business Application Performance Page
OPSA - Overview Page
We welcome your comments!
To open the configured email client on this computer, open an email window.
Otherwise, copy the information below to a web mail client, and send this email to SW-Doc@hpe.com.
Help Topic ID:
Product:
Topic Title:
Feedback: