Searching the Help
To search for information in the Help, type a word or phrase in the Search box. When you enter a group of words, OR is inferred. You can use Boolean operators to refine your search.
Results returned are case insensitive. However, results ranking takes case into account and assigns higher scores to case matches. Therefore, a search for "cats" followed by a search for "Cats" would return the same number of Help topics, but the order in which the topics are listed would be different.
| Search for | Example | Results |
|---|---|---|
| A single word | cat
|
Topics that contain the word "cat". You will also find its grammatical variations, such as "cats". |
|
A phrase. You can specify that the search results contain a specific phrase. |
"cat food" (quotation marks) |
Topics that contain the literal phrase "cat food" and all its grammatical variations. Without the quotation marks, the query is equivalent to specifying an OR operator, which finds topics with one of the individual words instead of the phrase. |
| Search for | Operator | Example |
|---|---|---|
|
Two or more words in the same topic |
|
|
| Either word in a topic |
|
|
| Topics that do not contain a specific word or phrase |
|
|
| Topics that contain one string and do not contain another | ^ (caret) |
cat ^ mouse
|
| A combination of search types | ( ) parentheses |
|
- Troubleshooting - Inventory Discovery
- How to view all information related to a device in a centralized view?
- How to troubleshoot network availability and latency issue related to a device?
- How to check the key indexes of the discovery history information for a discovered device?
- How to check device related logs for a discovered device?
- How to invoke discovery job relevant to the discovered device manually and check status to identify potential discovery errors?
- How to check which pattern (management zone) is used in the discovery for a discovered device?
- How to check detailed discovery settings used in the discovery for a discovered device?
- How to check the SNMP credentials used in the discovery for a discovered device?
- How to View Discovery Status and Errors for a Selected CI from the UCMDB Browser module
How to invoke discovery job relevant to the discovered device manually and check status to identify potential discovery errors?
Question: For a discovered device, to identify any potential discovery errors, how should I invoke discovery job relevant to the device manually, and check the progress/on-going status of the discovery?
In DDMi, if you find any error in the discovery result, you can run the DDMi jobs in an ad-hoc way. In UD, similar jobs are available to provide similar functionalities.
The table below describes DDMi jobs and the corresponding UD jobs that can be run in an ad-hoc way:
| DDMi Job | UD Job |
|---|---|
| Deploy Agent | Install UD Agent |
| Upgrade Agent | Update UD Agent |
| Run Scanner | Run Scanner |
| Retrieve Scan File | Download Scan File |
| Uninstall Agent | Uninstall UD Agent |
| Run Agentless Scanner | Run Agentless Scanner |
| Enrich XML | Parse Enriched Scan File |
| Run Rulebase | The normalization functionality is included the Rerun Discovery option for each job |
| Run VMware Discovery | VMware discovery jobs |
For details, click the UD job of your interest in the table above.
To invoke discovery job relevant to the device manually,
-
In UCMDB, go to Data Flow Management > Universal Discovery > Discovery Modules/Jobs tab.
-
In the Discovery Modules tree, select Tools and Samples > UD Agent Management > Install UD Agent.
-
Right-click Install UD Agent, select Activate from the context menu if the job is not activated, and wait for the Triggered CIs list to refresh.
- In the Triggered CIs list in the Discovery Progress pane, click a number with link.
- In the Look for field that is just enabled, enter the IP address for the target device and click
 .
. -
Right-click the returned entry, and from the context menu, select Run from step > <Select an action>.
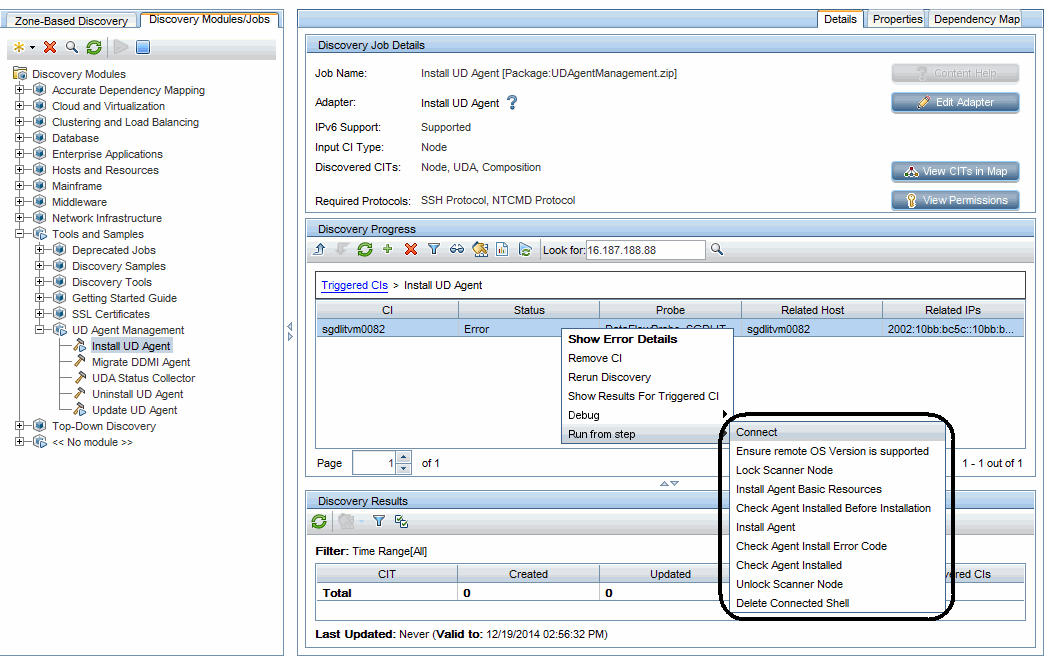
To check the progress/on-going status of the discovery job,
-
Modify the adapter's configuration to make sure that the communication log is always created.
In this case, modify the Install UD Agent adapter's configuration.
- In the Data Flow Management module, go to Adapter Management.
- In the Resources pane, expand UDAgentManagment > Adapters > InstallUDAgent.
- In the right pane, click the Adapter Configuration tab.
-
In the Execution Options section, set the following:
- Create communication log: Always
- Include results in communication log: Yes
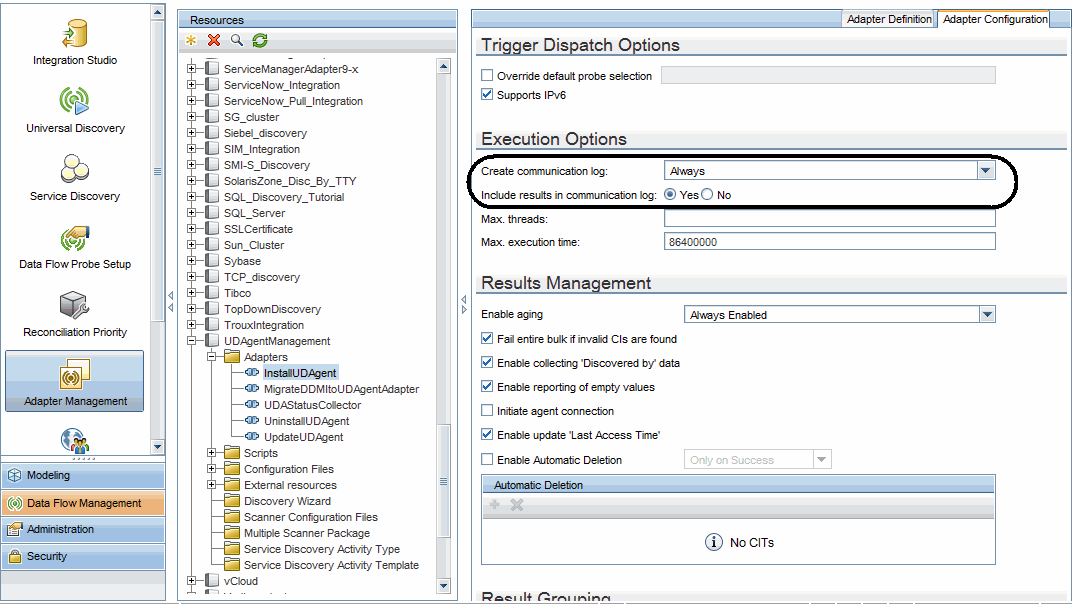
-
Return to the Universal Discovery window, right-click the returned entry, from the context menu, select Debug > View Communication Log
For details, see How to check device related logs for a discovered device?.
To invoke discovery job relevant to the device manually, and check progress and status of the discovery job:
-
In UCMDB, go to Data Flow Management > Universal Discovery > Discovery Modules/Jobs tab.
-
In the Discovery Modules tree, select Tools and Samples > UD Agent Management > Update UD Agent.
-
Right-click Update UD Agent, select Activate from the context menu if the job is not activated, and wait for the Triggered CIs list to refresh.
- In the Triggered CIs list in the Discovery Progress pane, click a number with link.
- In the Look for field that is just enabled, enter the IP address for the target device and click
 .
. -
Right-click the returned entry, and from the context menu, select Run from step > <Select an action>.
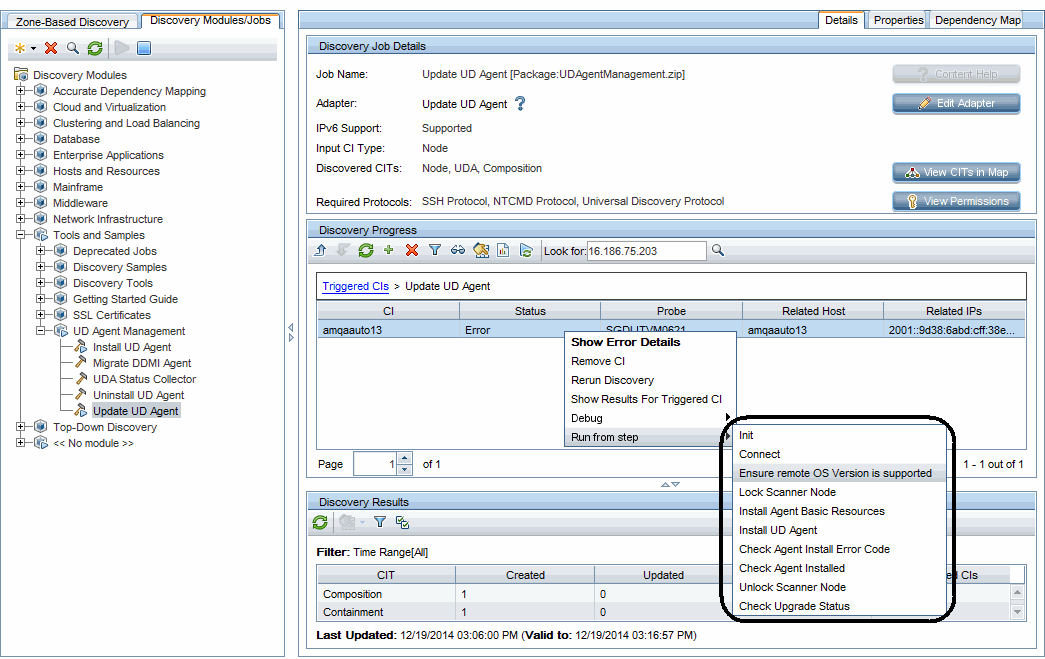
-
To check the progress/on-going status of the discovery job,
-
Modify the Update UD Agent adapter's configuration to make sure that the communication log is always created.
For detailed instructions, see To check the progress/on-going status of the discovery job,.
-
Right-click the returned entry in the Discovery Progress pane, from the context menu, select Debug > View Communication Log.
For details, see How to check device related logs for a discovered device?.
-
To invoke discovery job relevant to the device manually, and check progress and status of the discovery job:
-
In UCMDB, go to Data Flow Management > Universal Discovery > Discovery Modules/Jobs tab.
-
In the Discovery Modules tree, select Hosts and Resources > Inventory Discovery > Inventory Discovery by Scanner.
-
Right-click Inventory Discovery by Scanner, select Activate from the context menu if the job is not activated, and wait for the Triggered CIs list to refresh.
-
In the Triggered CIs list in the Discovery Progress pane, click a number with link of your interest.
- In the Look for field that is just enabled, enter the IP address for the scanner and click
 .
. -
Right-click the returned entry, and from the context menu, select Run from step > <Select an action>.
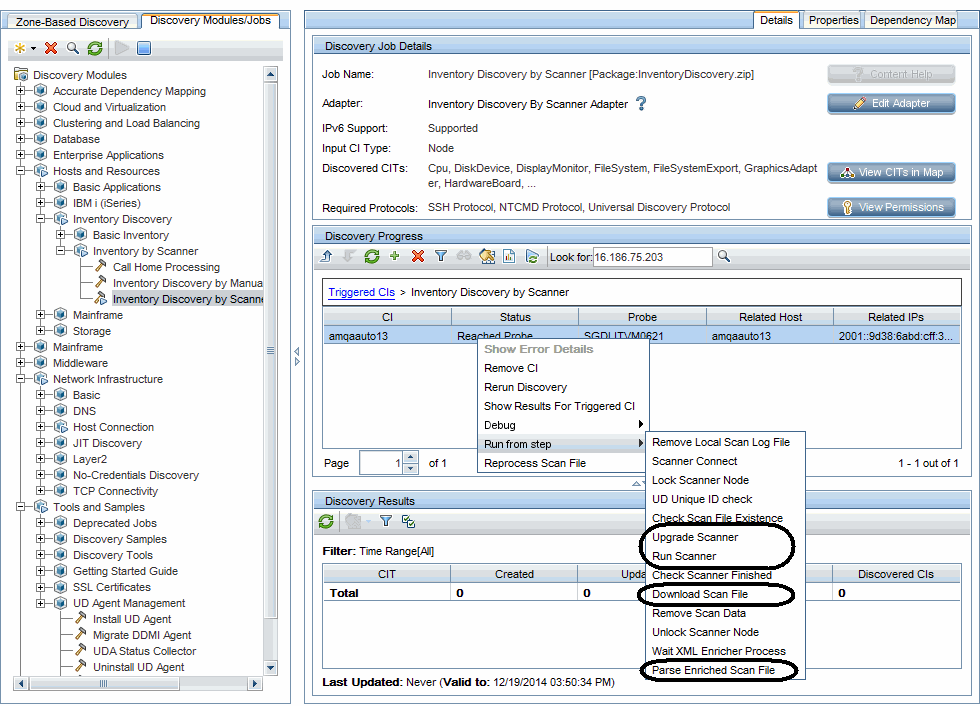
Note To Run Agentless Scanner, before selecting a Run from step option, set Universal Discovery Protocol scope to Probes: Disabled.
To do so,
- In the Data Flow Management module, go to Data Flow Probe Setup.
- Expand Domains and Probes > DefaultDomain(Default) > Credentials > Universal Discovery Protocol.
- In the right Universal Discovery Protocol pane, right-click a protocol and select Edit.
- In the Universal Discovery Protocol Parameters dialog box, click the Edit
 button for the Network Scope field.
 - In the Scope Definition dialog box, click the Edit
 button for the Selected Probes section.
 - In the Selected Probes dialog box, clear the check box for All Data Flow Probes and click OK three times to exit.
-
Repeat step c through step f for other protocols.

- Click OK to save the changes.
-
To check the progress/on-going status of the discovery job,
-
Modify the Inventory Discovery by Scanner adapter's configuration to make sure that the communication log is always created.
For detailed instructions, see To check the progress/on-going status of the discovery job,.
-
Right-click the returned entry in the Discovery Progress pane, from the context menu, select Debug > View Communication Log.
For details, see How to check device related logs for a discovered device?.
-
To invoke discovery job relevant to the device manually, and check progress and status of the discovery job:
-
In UCMDB, go to Data Flow Management > Universal Discovery > Discovery Modules/Jobs tab.
-
In the Discovery Modules tree, select Tools and Samples > UD Agent Management > Uninstall UD Agent.
-
Right-click Uninstall UD Agent, select Activate from the context menu if the job is not activated, and wait for the Triggered CIs list to refresh.
- In the Triggered CIs list in the Discovery Progress pane, click a number with link.
- In the Look for field that is just enabled, enter the IP address for the target device and click
 .
. -
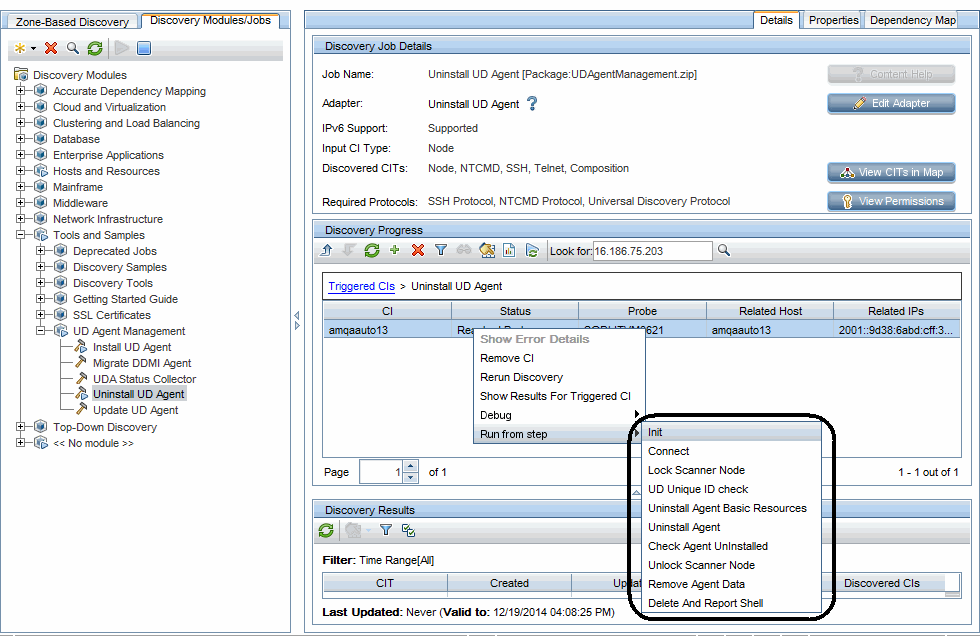
Right-click the returned entry, and from the context menu, select Run from step > <Select an action>.
-
To check the progress/on-going status of the discovery job,
-
Modify the Uninstall UD Agent adapter's configuration to make sure that the communication log is always created.
For detailed instructions, see To check the progress/on-going status of the discovery job,.
-
Right-click the returned entry in the Discovery Progress pane, from the context menu, select Debug > View Communication Log.
For details, see How to check device related logs for a discovered device?.
-
The Run Rulebase feature is implemented in UD normalization, which covers all jobs.
To invoke the normalization manually, in the Discovery Progress pane, right-click the CI entry returned from your search and select Rerun Discovery from the context menu, which will perform the normalization.
To check the progress/on-going status of the discovery job,
-
Modify the concerning adapter's configuration to make sure that the communication log is always created.
For detailed instructions, see To check the progress/on-going status of the discovery job,.
-
Right-click the returned entry in the Discovery Progress pane, from the context menu, select Debug > View Communication Log.
For details, see How to check device related logs for a discovered device?.
To invoke the VMware discovery job manually,
-
In UCMDB, go to Data Flow Management > Universal Discovery > Discovery Modules/Jobs tab.
-
In the Discovery Modules tree, select Cloud and Virtualization > VMware > <select a job>.
-
Right-click the selected job, select Activate from the context menu if the job is not activated, and wait for the Triggered CIs list to refresh.
- In the Triggered CIs list in the Discovery Progress pane, click a number with link.
- In the Look for field that is just enabled, enter the IP address for the target device and click
 .
. -
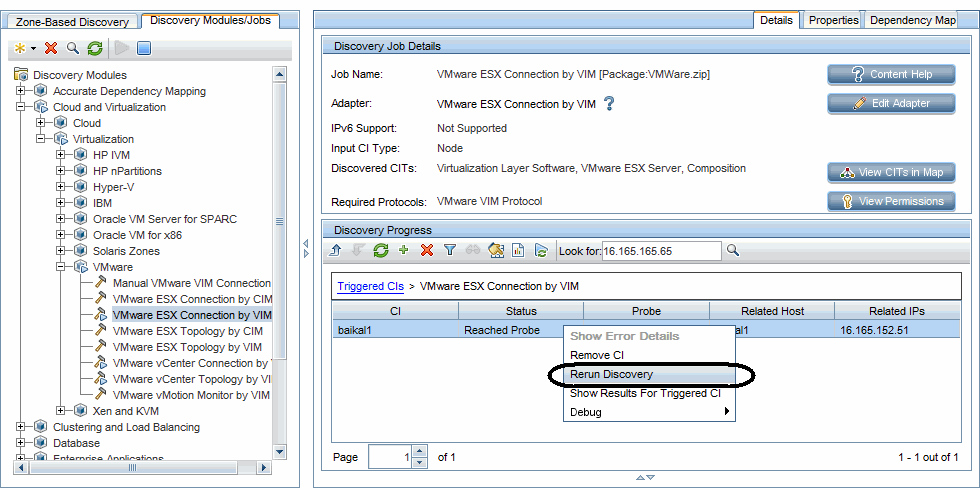
Right-click the returned entry, and select Rerun Discovery from the context menu.
-
To check the progress/on-going status of the discovery job,
-
Modify the concerning adapter's configuration to make sure that the communication log is always created.
For detailed instructions, see To check the progress/on-going status of the discovery job,.
-
Right-click the returned entry in the Discovery Progress pane, from the context menu, select Debug > View Communication Log.
For details, see How to check device related logs for a discovered device?.
-
We welcome your comments!
To open the configured email client on this computer, open an email window.
Otherwise, copy the information below to a web mail client, and send this email to cms-doc@microfocus.com.
Help Topic ID:
Product:
Topic Title:
Feedback:


