Sizing Reference for CMS UI
This
CMS UI performance test result summary
The CMS UI performance test shows the following results:
-
Use cases without reports
500 concurrent users are supported with good performance per each CMS UI and UCMDB server combination on enterprise deployment configuration. The average transaction response time is less than 5 seconds.
-
Use cases with reports
- 500 concurrent users are supported with acceptable performance per each CMS UI and UCMDB server combination on enterprise deployment configuration.
- Reports are no longer limited to 30,000 CIs.
- Reports can display in a reasonable response time (< 5 seconds for reports with 1 million CIs)
-
The response time for exporting reports is dependent on report size
Exporting 260,000 running software CIs to CSV takes about 2 minutes. This is expected and acceptable since this scenario is asynchronous, and it needs to generate and download a CSV file of 26 MB in size, which typically consumes network/file IO.
Exporting 2,600,000 CIs to CSV (file size 270 MB) takes about 14 minutes.
Note
-
During the CMS UI performance test:
- No discovery jobs are running
- No integration jobs are running
- Multi-tenant is not enabled
- When planning or sizing your resources for CMS UI, note that the CMS UI performance in your environment may vary with your machine configuration, network environment, and data volume.
The following sections provide more details about software and hardware configuration used in the CMS UI performance test environment.
Test Environment
Software Configuration
| Item | Value |
|---|---|
| UCMDB Server |
|
| Data Volume | 25 million CIs and CI links |
|
CMS UI |
|
Hardware Configuration for Testing Machines
| Role | OS | Disk Space | CPU | RAM |
|---|---|---|---|---|
| UCMDB Server | Windows Server 2008 R2, 64-bit | 100 GB | 2x12 2.93GHz | 96 GB * |
| Oracle Database Server | Windows Server 2012 R2, 64-bit | 1.3 TB | 2x16 2.40Ghz | 128 GB |
| LoadRunner | Windows Server 2008 R2, 64-bit | 120 GB | 2x4 2.60Ghz | 16 GB |
|
CMS UI server (standalone) |
Windows Server 2008 R2, 64-bit |
1 TB |
2x8 2.40GHz |
128 GB |
* 96 GB indicates the memory available on the machine. Only 32 GB memory is assigned to UCMDB server.
500 Concurrent Users - Average Transaction Response Time (without reports)
| Transaction | Minimum (seconds) | Average (seconds) | Maximum (seconds) | Std. Deviation |
|---|---|---|---|---|
| Load Dashboard | 0.87 | 1.853 | 8.885 | 1.384 |
| login | 0.581 | 0.871 | 4.389 | 0.421 |
| Logout | 0.265 | 0.347 | 4.568 | 0.241 |
| open legacy ucmdb browser | 0.039 | 0.233 | 6.45 | 0.537 |
| open ucmdb browser | 0.059 | 0.692 | 3.386 | 0.873 |
| search nt | 1.324 | 2.478 | 26.921 | 1.42 |
| view ci details | 1.353 | 2.6 | 23.065 | 1.403 |
500 Concurrent Users - Average Transaction Response Time (with reports)
| Transaction | Minimum (seconds) | Average (seconds) | Maximum (seconds) | Std. Deviation |
|---|---|---|---|---|
| General transactions | ||||
| Load Dashboard | 0.919 | 5.008 | 41.553 | 5.316 |
| login | 0.3 | 1.188 | 12.129 | 1.795 |
| Logout | 0.222 | 0.588 | 15.881 | 1.009 |
| open legacy ucmdb browser | 0.024 | 0.833 | 21.47 | 2.823 |
| open ucmdb browser | 0.03 | 0.943 | 14.559 | 2.01 |
| search nt | 0.514 | 6.94 | 51.03 | 9.161 |
| view ci details | 0.302 | 3.359 | 37.36 | 5.083 |
| Reports related transactions | ||||
| Search databases by type Report | 0.185 | 2.435 | 35.343 | 4.46 |
| Open Databases by Type Report | 0.347 | 2.672 | 27.998 | 4.291 |
| Open Running Software Report | 0.806 | 3.728 | 27.264 | 5.18 |
| Search running software Report | 0.475 | 3.801 | 37.082 | 5.333 |
| Search installed software Report | 14.066 | 27.325 | 59.256 | 10.391 |
| Export Databases by Type Report XML | 22.221 | 30.565 | 57.148 | 6.869 |
| Open Installed Software Report | 37.634 | 51.368 | 60.745 | 7.161 |
| Export Databases by Type Report CSV | 33.458 | 52.704 | 95.191 | 15.489 |
| Export Databases by Type Report XLS | 43.845 | 62.535 | 108.497 | 16.618 |
| Export Databases by Type Report XLSX | 44.62 | 65.469 | 108.702 | 17.639 |
| Export Databases by Type Report PDF | 43.601 | 74.418 | 130.879 | 21.419 |
| Export Running Software Report XML | 84.364 | 112.926 | 154.873 | 18.272 |
| Export Running Software Report CSV | 112.627 | 142.97 | 183.745 | 20.42 |
| Export Running Software Report PDF | 144.164 | 179.979 | 229.01 | 28.355 |
| Export Running Software Report XLS | 139.835 | 181.127 | 274.823 | 38.416 |
| Export Running Software Report XLSX | 132.236 | 186.219 | 224.064 | 29.427 |
| Export Installed Software Report CSV | 780.496 | 855.559 | 930.622 | 75.063 |
| Export Installed Software Report XLSX | 1080.406 | 1137.104 | 1193.802 | 56.698 |
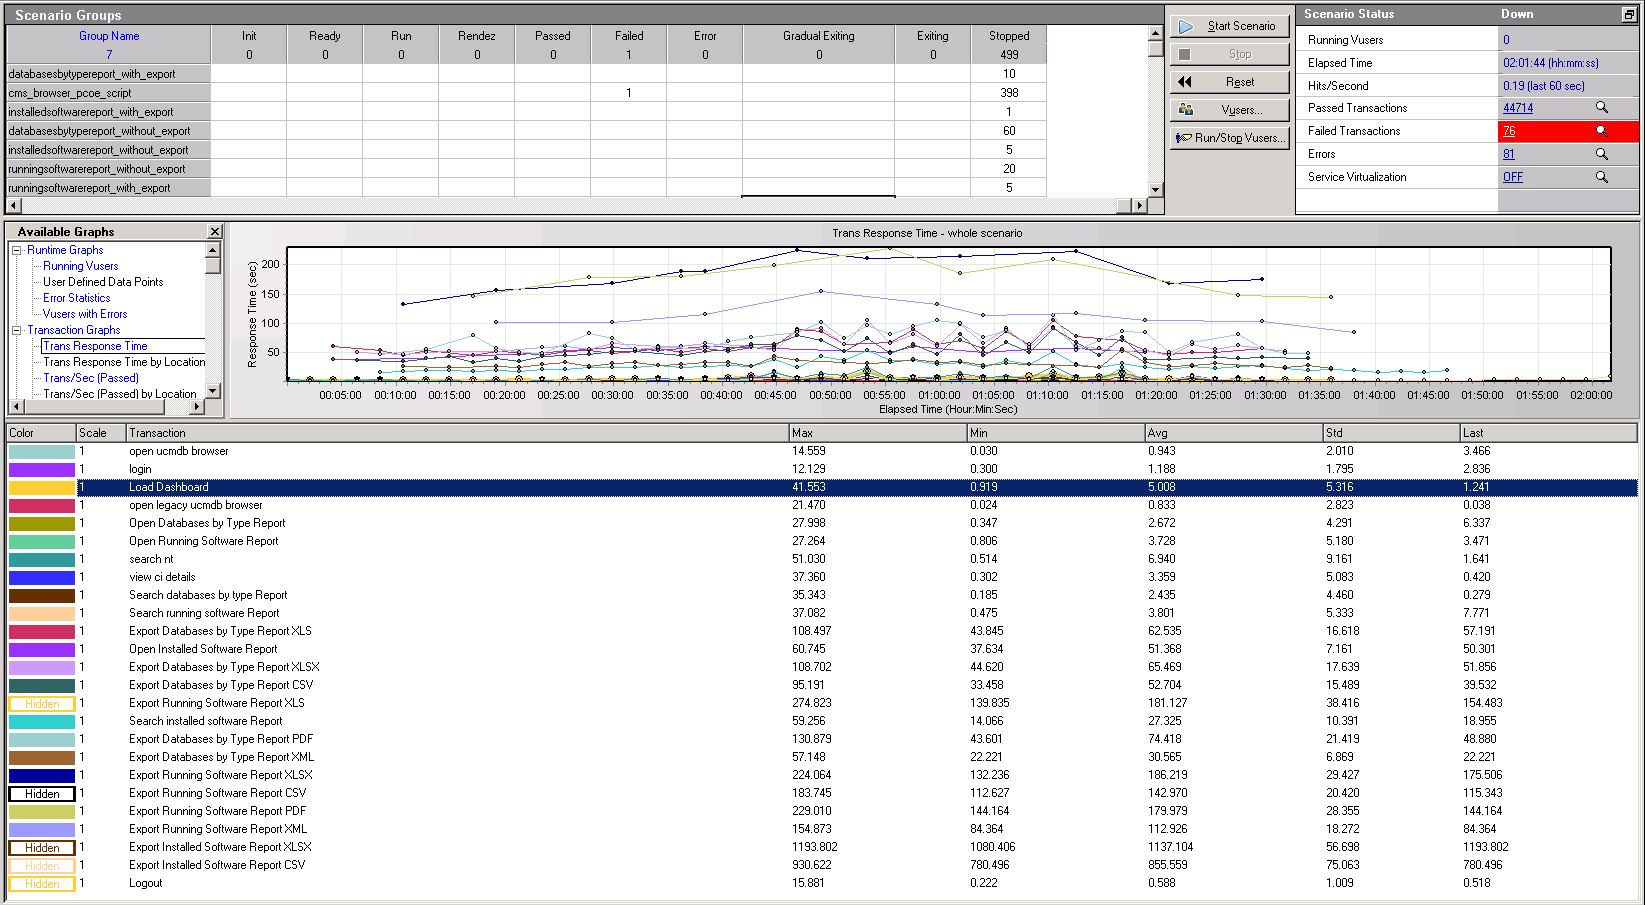
The screenshot below shows LoadRunner transaction response time: