Debug the Flow
To debug the a Flow, perform the following steps:
- Open an existing Flow from the project pane or from an imported Content Pack.
- Click
 or inverted Debug text to expand the Debugger pane.
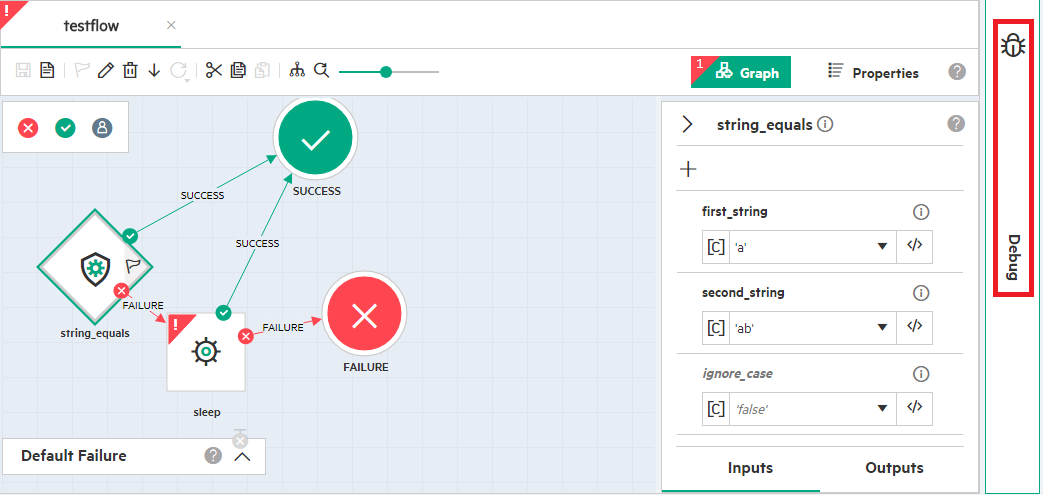
- Click Start
 or press Alt + F11 in the keyboard to begin the debug process.
Note: The start debug icon is disabled for an invalid flow. A relevant message is also displayed when pointing the cursor on the Debug icon.
Note: The debugging of Operations, Decisions, and System Properties are not enabled in this version.
In the multi-author environment:
- A user can debug multiple flows at the same time.
- A user cannot debug the same flow while it is still in the debugging process.
- Multiple users connected to one Designer can debug the same flow in their work-spaces.
- A user can debug multiple flows at the same time.
- A user cannot debug the same flow while it is still in the debugging process.
- Multiple users connected to one Designer can debug the same flow in their work-spaces.
- Click Cancel
 or press Alt + F12, if you want to cancel the debug process.
 - After debugging the flow, you can view the outputs and results of the flow in a Run Tree pane as displayed in the following example image.
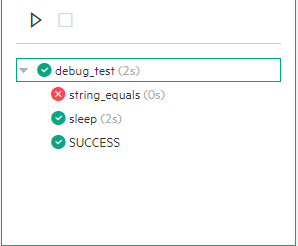
The following icons are displayed in the Run Tree pane to indicate the status of a debug process:
| Icon | Description |
|---|---|

|
Flow is currently in debugging process |

|
Failure result |

|
Success result |

|
Debug canceled or terminated abruptly |

|
Runtime exception |

|
Custom result |
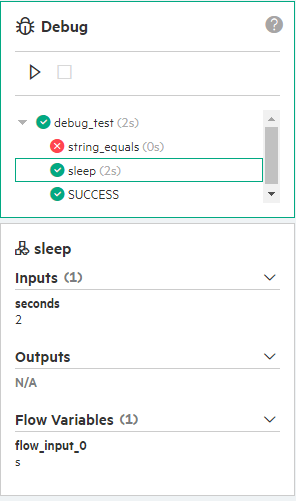
-
Select any node in the Run Tree to check the context of that step in the Context Inspector. The following image displays the input, output, and flow variables for sleep node.