Use-Case End-to-End Data Flow
The user currently works with the data in a spreadsheet and would like to visualize this data in a meaningful way with defined KPI.
Scenario - Spreadsheet Import E2E case
Requirement:
The initial requirement is about data center resource capacity planning. As a Data Center Configuration Manager, the user needs to provide the following daily primitive metrics regarding the data center sever capacity.
- RESERVED: The total amount of capacity that has been reserved for use, within a room.???what is a room???
- IN USE: The total amount of capacity that is in use, within a room.
- MOVE IN: The total amount of capacity which is to be received from another location.
- MOVE OUT: The total amount of capacity that is to be decommissioned.
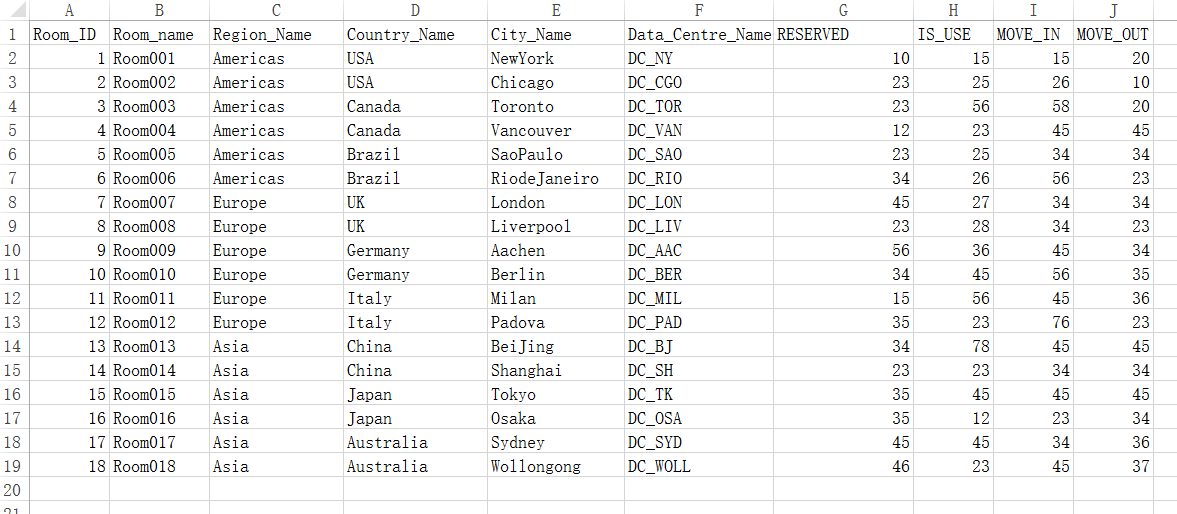
The data for these metrics are presented in one spreadsheet, where Region Name, Country Name, City Name, Data Centre Name, Room Name, Room ID (unique) are present within every data row, in addition to the metrics.
Design:
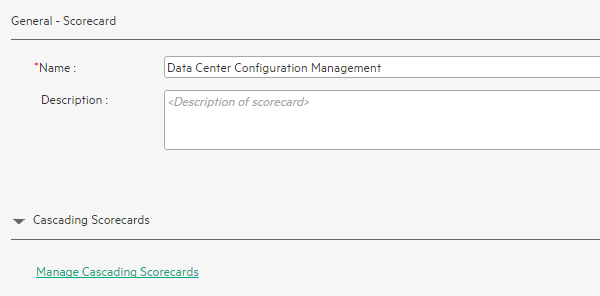
- A Scorecard will be designed for the Data Center Configuration Manager.
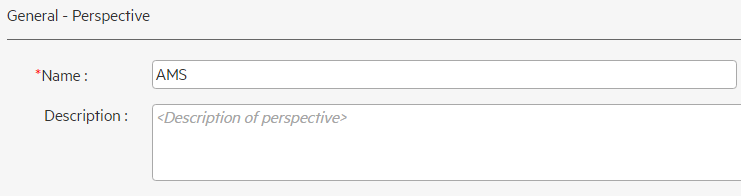
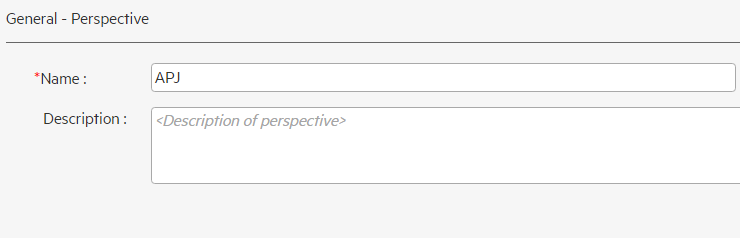
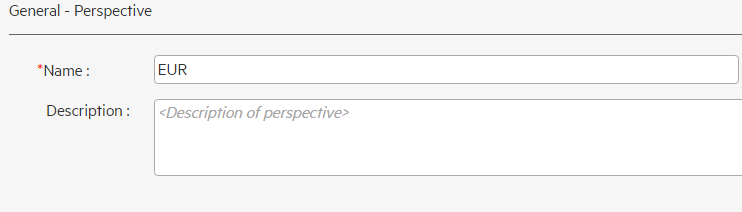
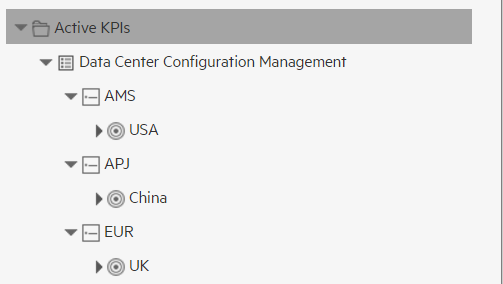
- Each region will be designed as a Perspective.
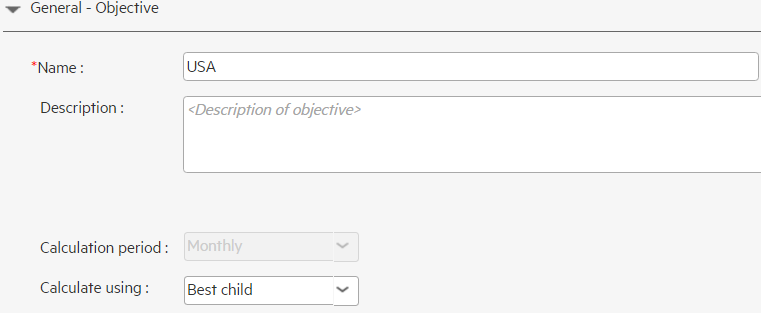
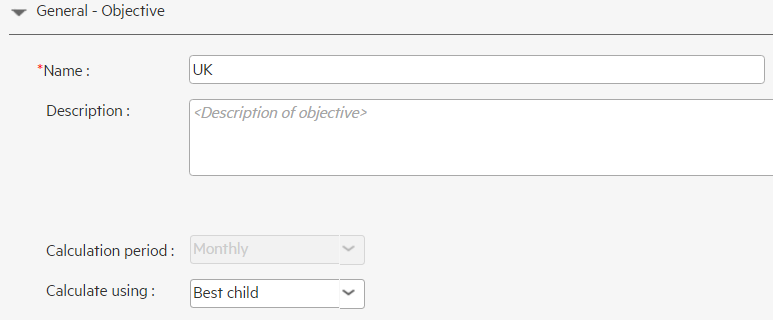
- Each country will be designed as an Objective.
- KPIs for each type of capacity will be designed beneath each Objective.
- Breakdowns (City Name, Data Centre Name, Room Name Hierarchy structure) will be designed for each KPI .
Implementation:
-
Log on ITBA application by account: Administrator/Admin111.
-
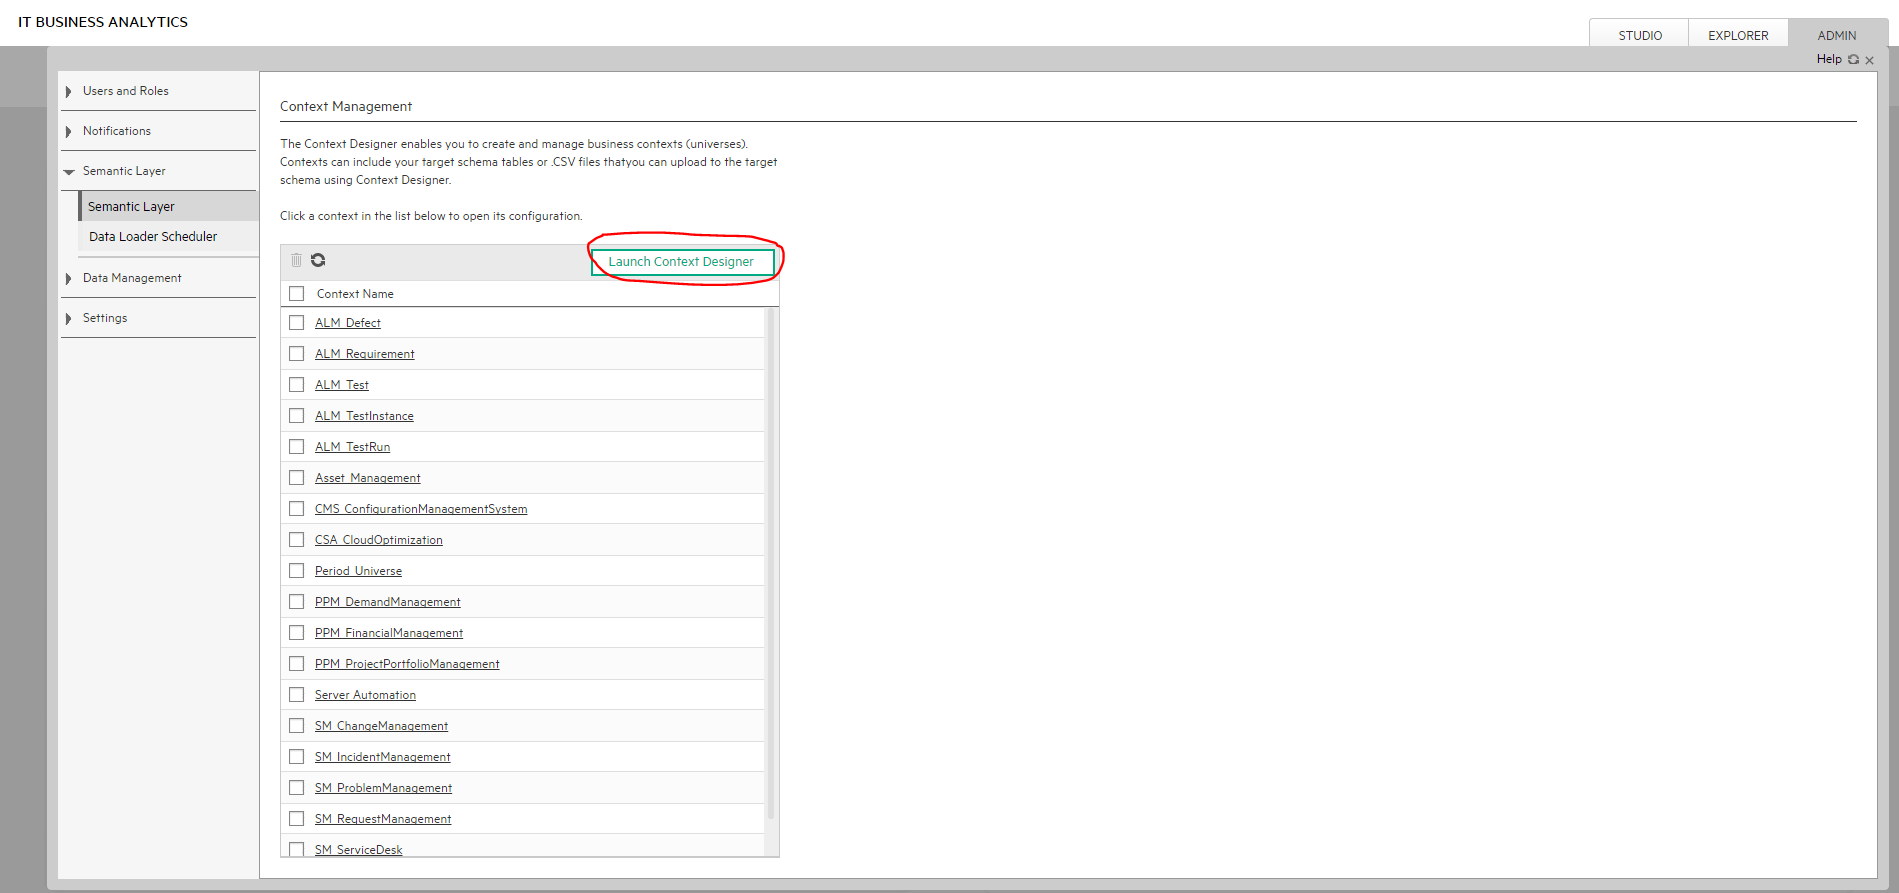
Launch the context designer layer by: Admin -> SemanticLayer -> SemanticLayer -> Launch Context Designer.
-
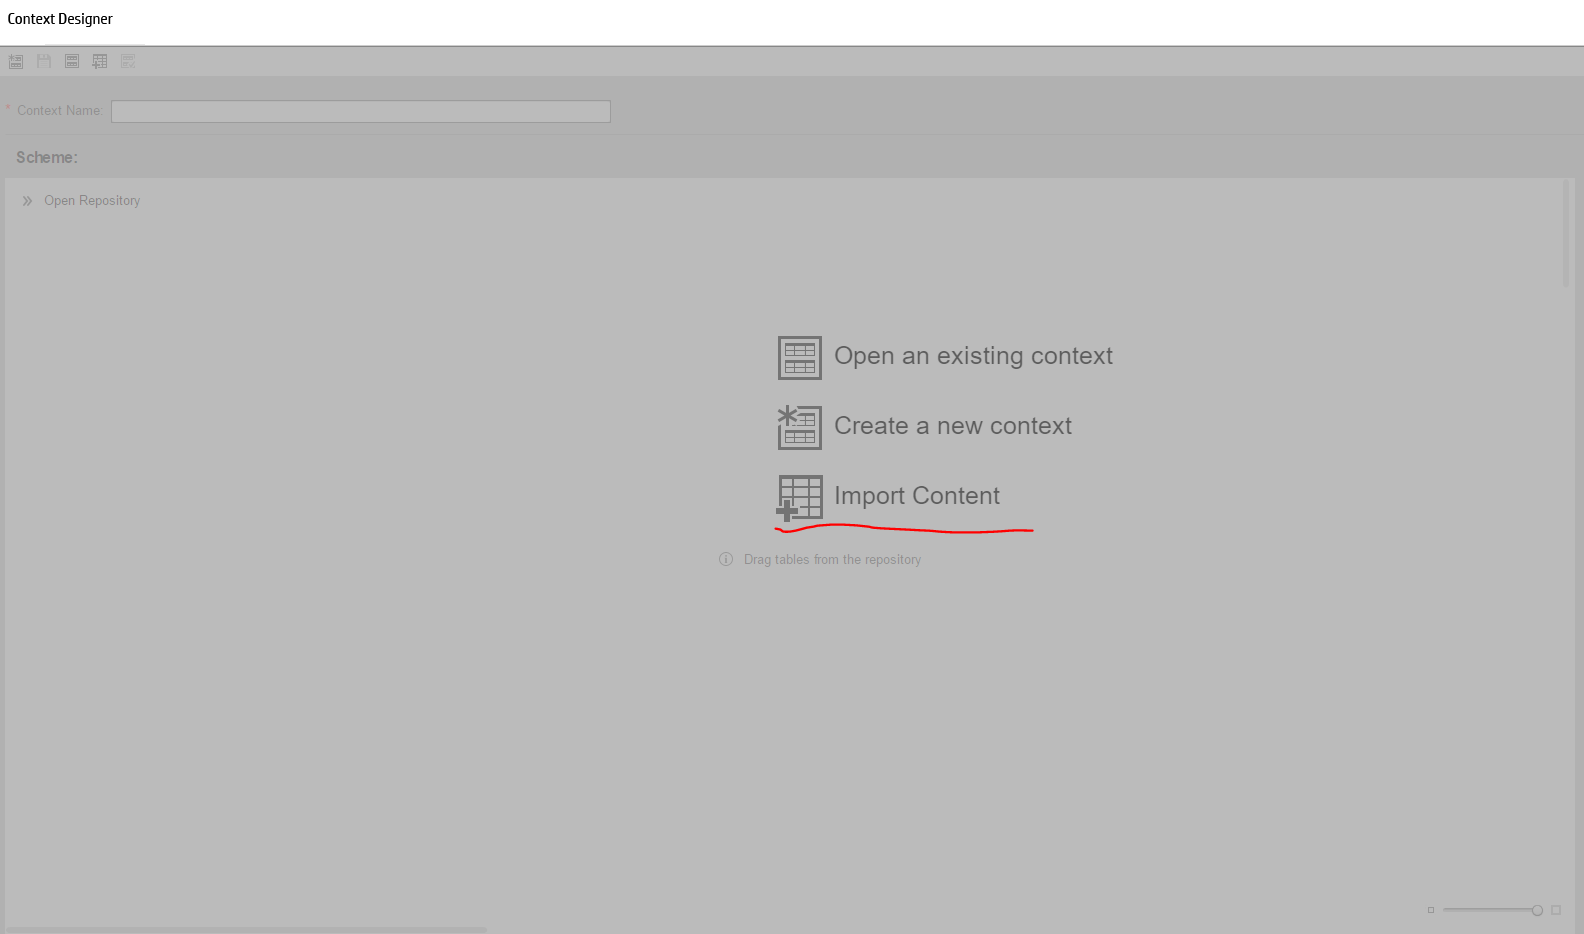
Select Import Content.
-
Select the custom xlsx file, such as data center server capacity.xlsx.
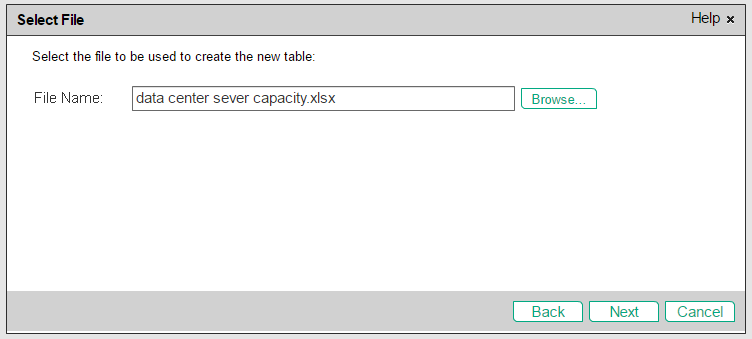
-
Click the Next button and select the spreadsheets.
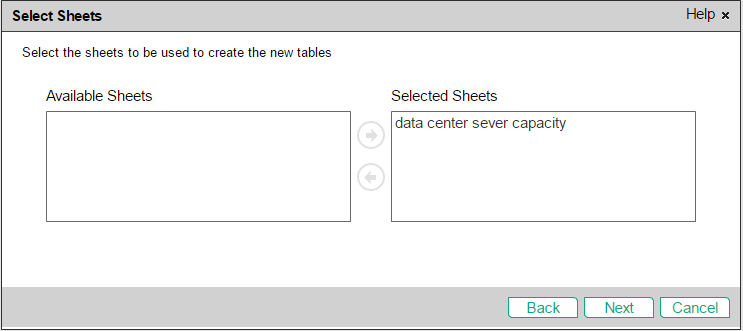
-
Click the Next button.
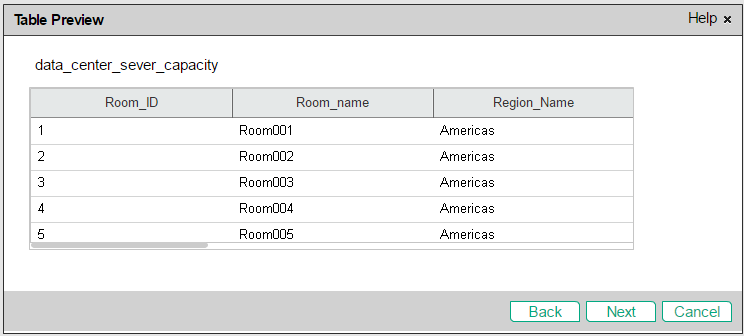
-
Click the Next button and check Schedule import later.
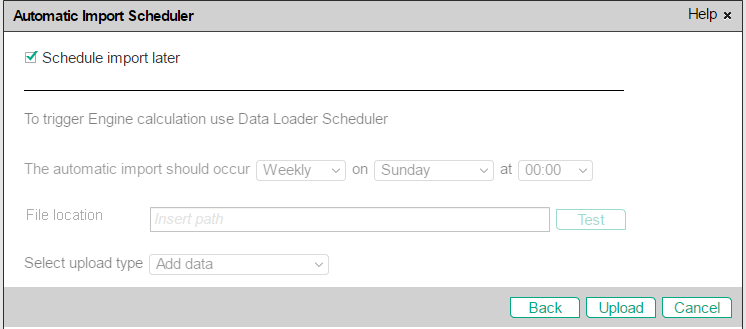
-
Click Upload > Finish .
-
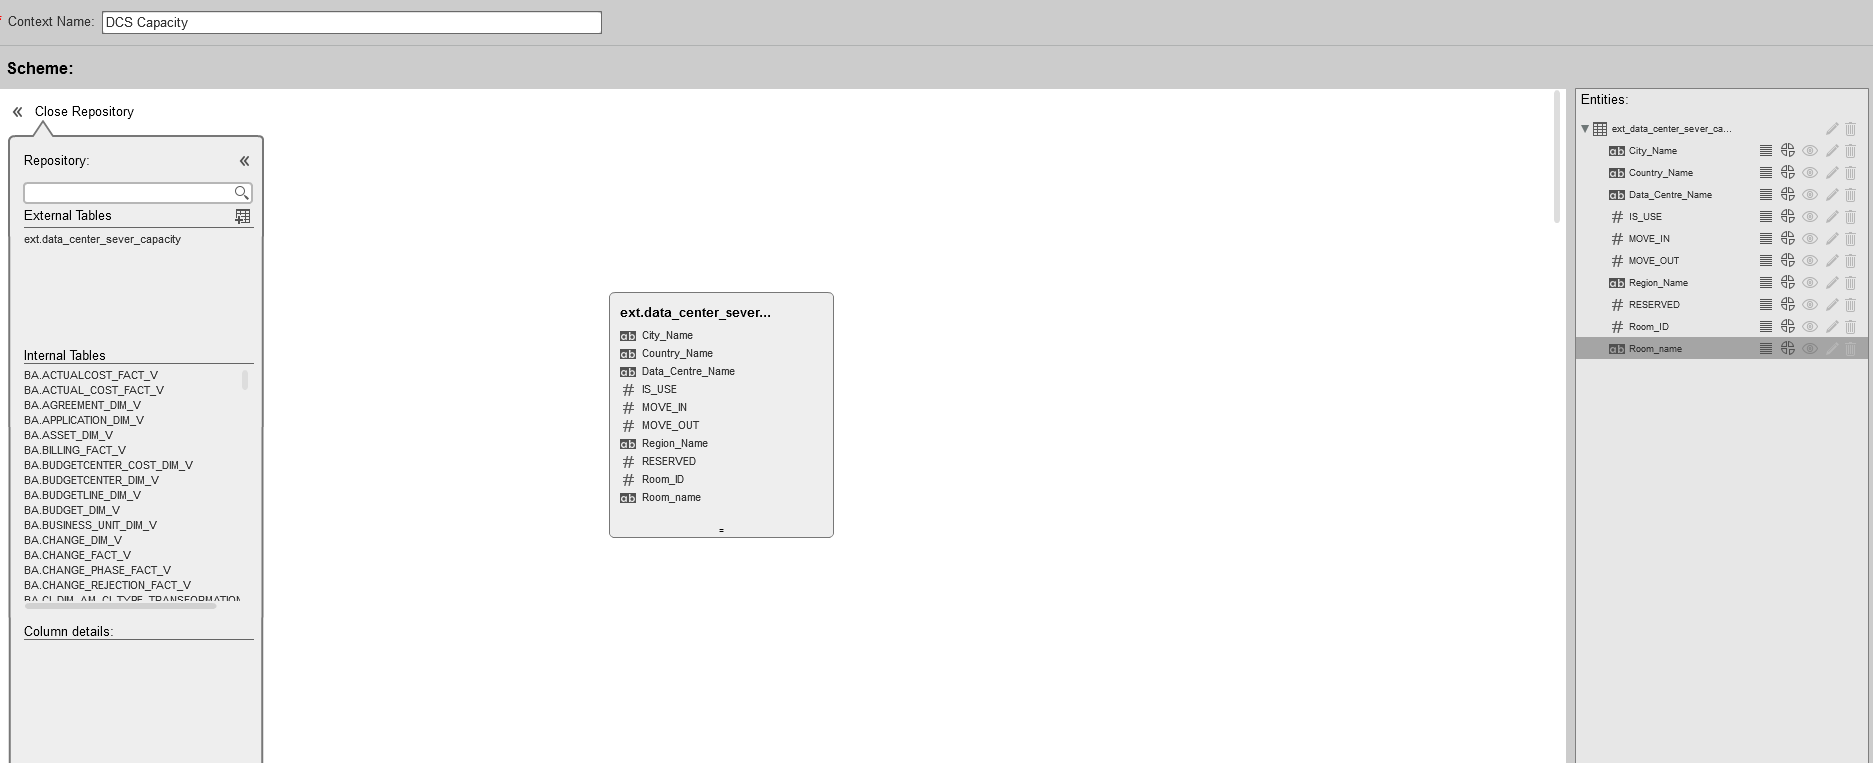
Create and save one context as below.
-
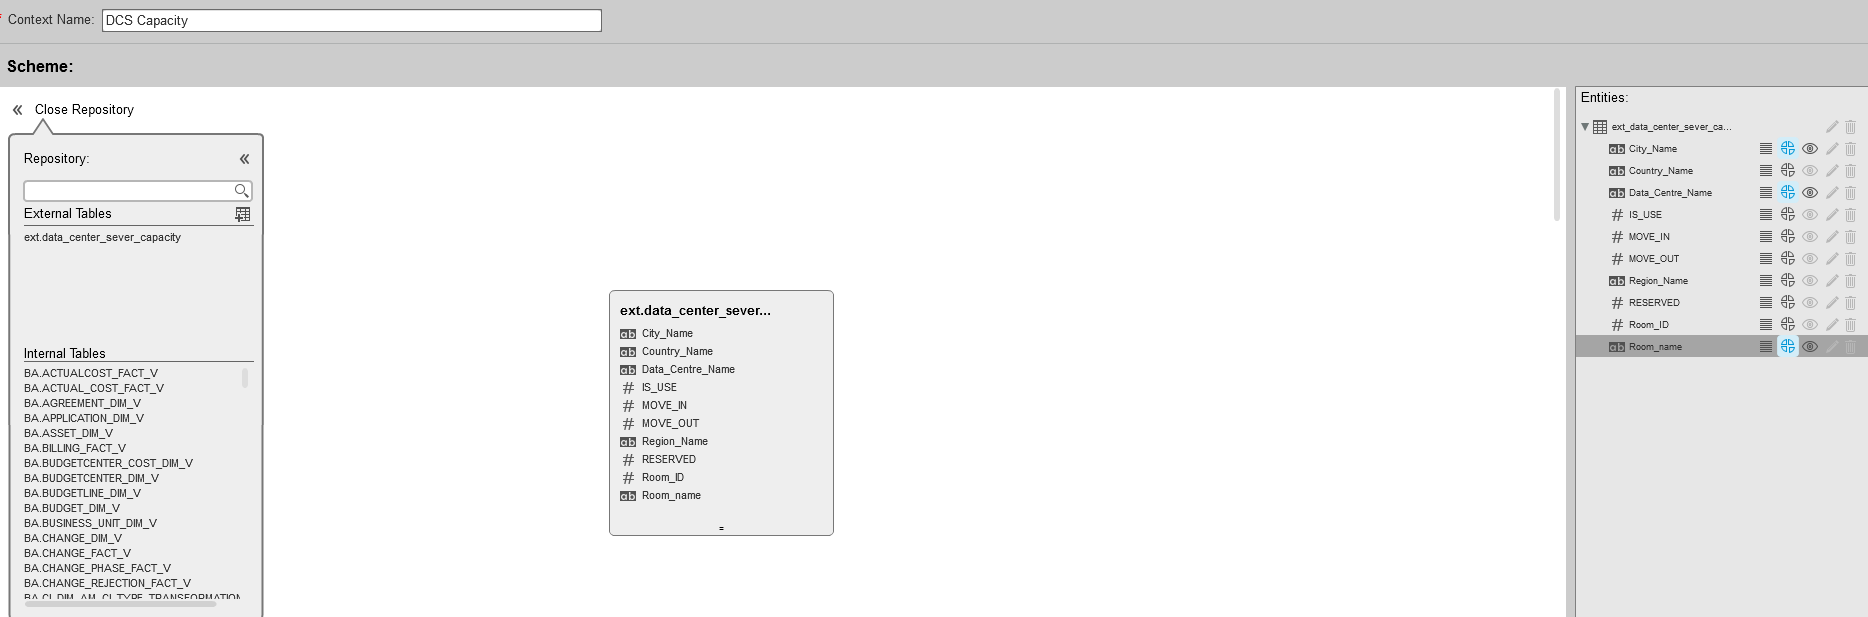
Update the context as below, enable breakdowns and click Save.
-
Open Studio and build a Scorecard tree as follows:
-
-
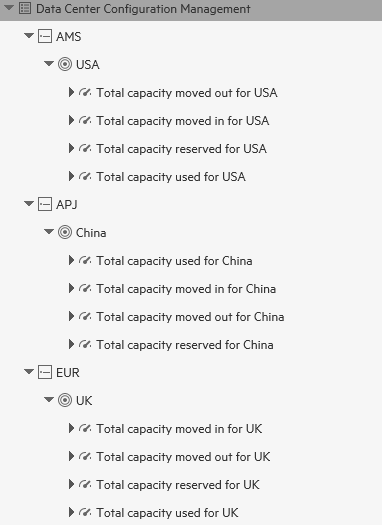
Create 4 KPIs foreach Objective asfollows:
-
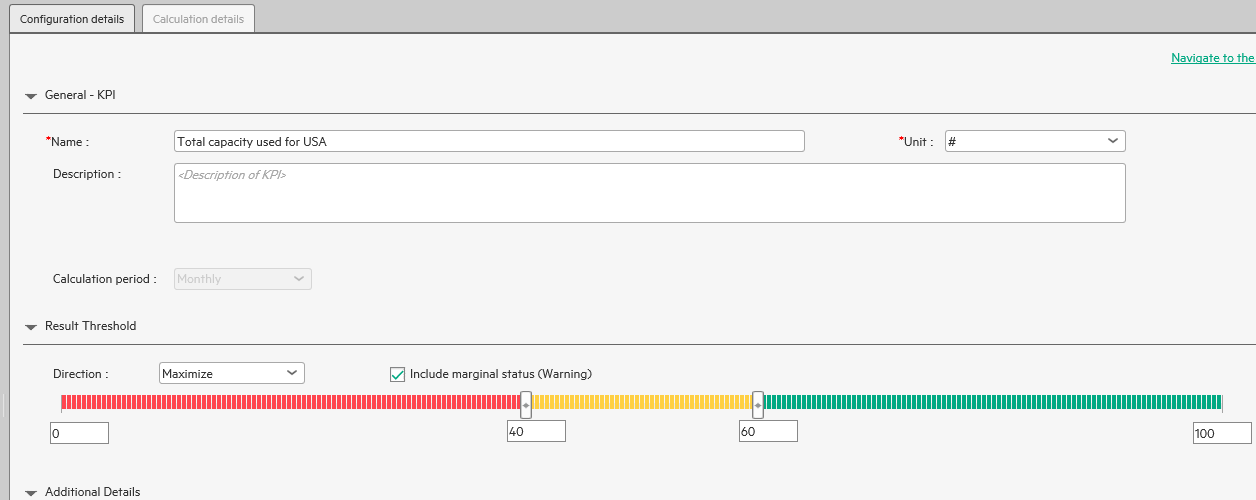
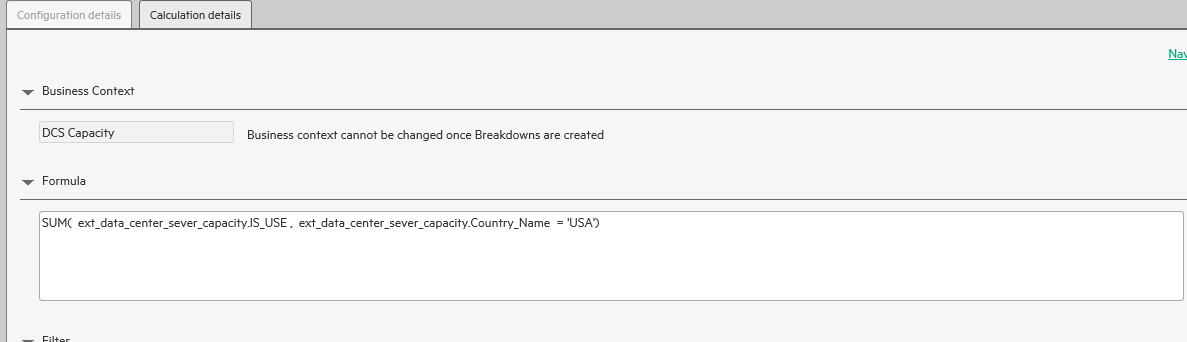
Total capacity used for USA:
KPI configuration details
KPI Calculation details
-
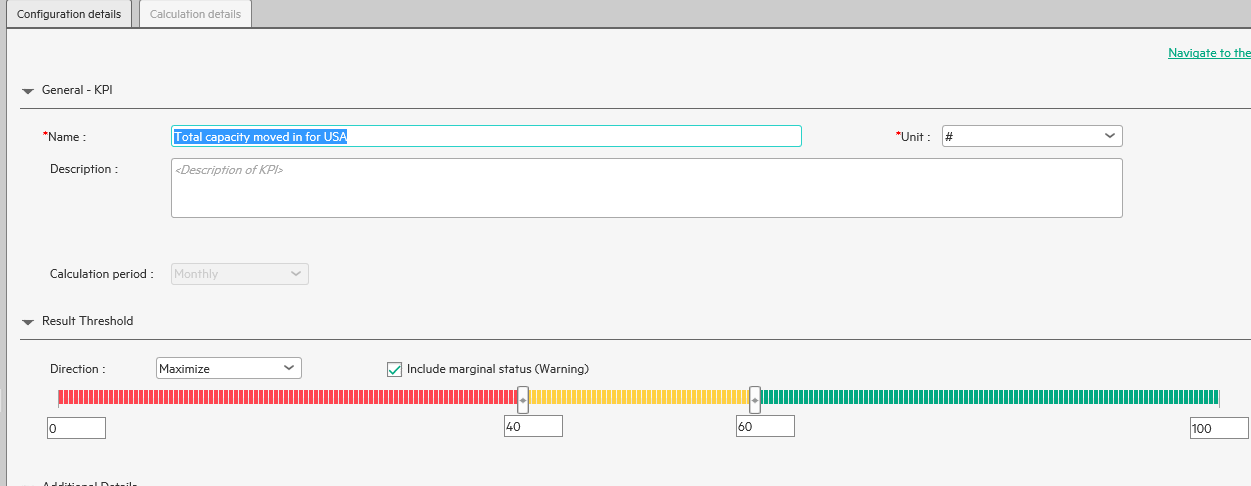
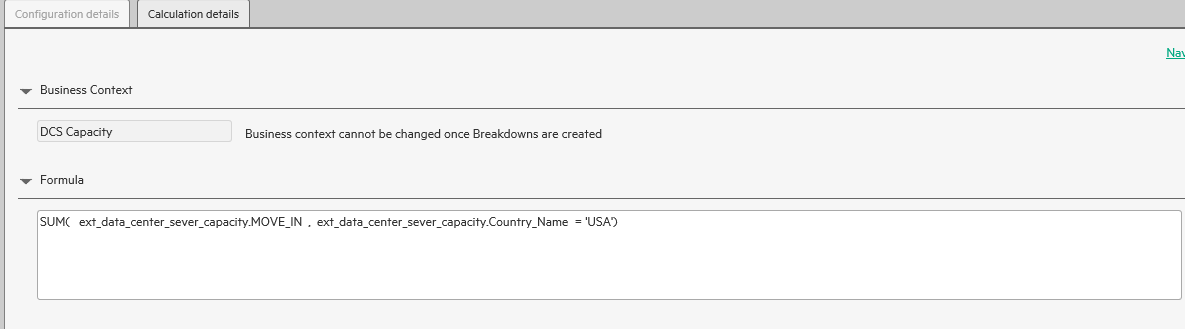
Total capacity moved in for USA:
KPI configuration details:
KPI calculation details:
-
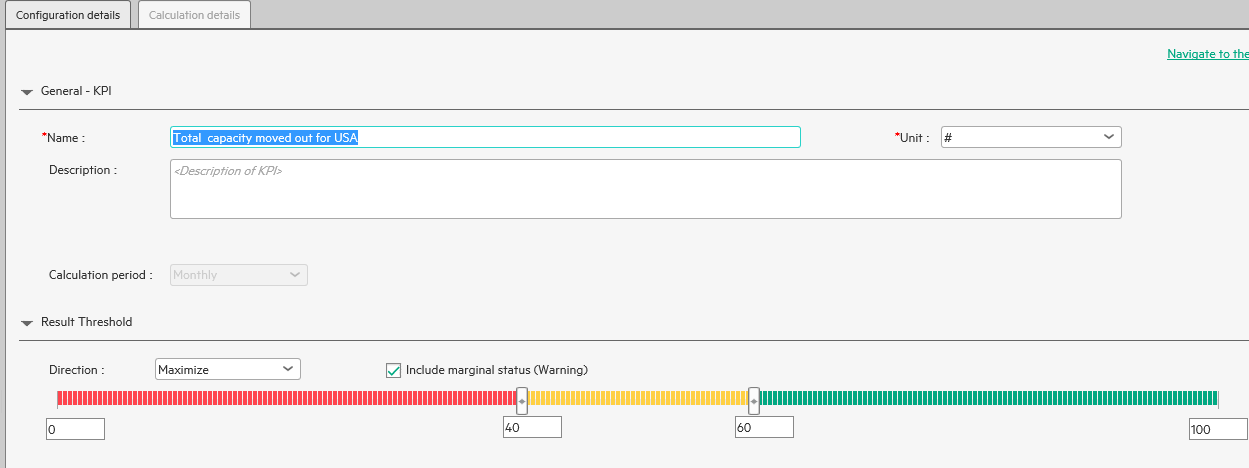
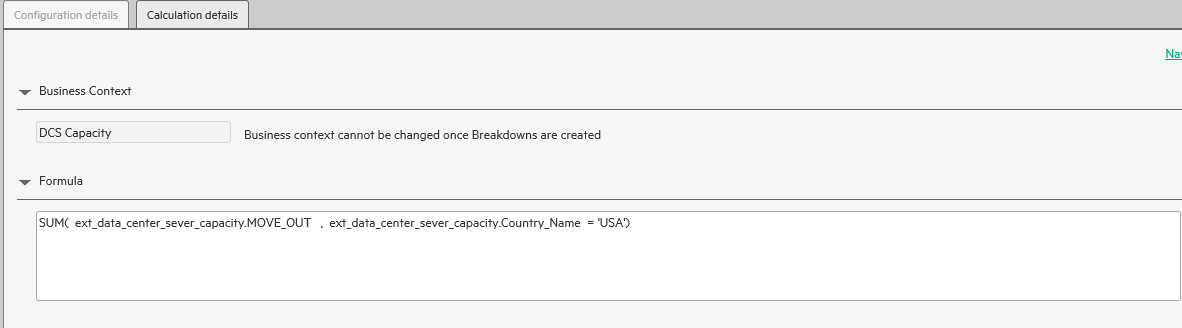
Total capacity moved out for USA:
KPI configuration details
KPI calculation details:
-
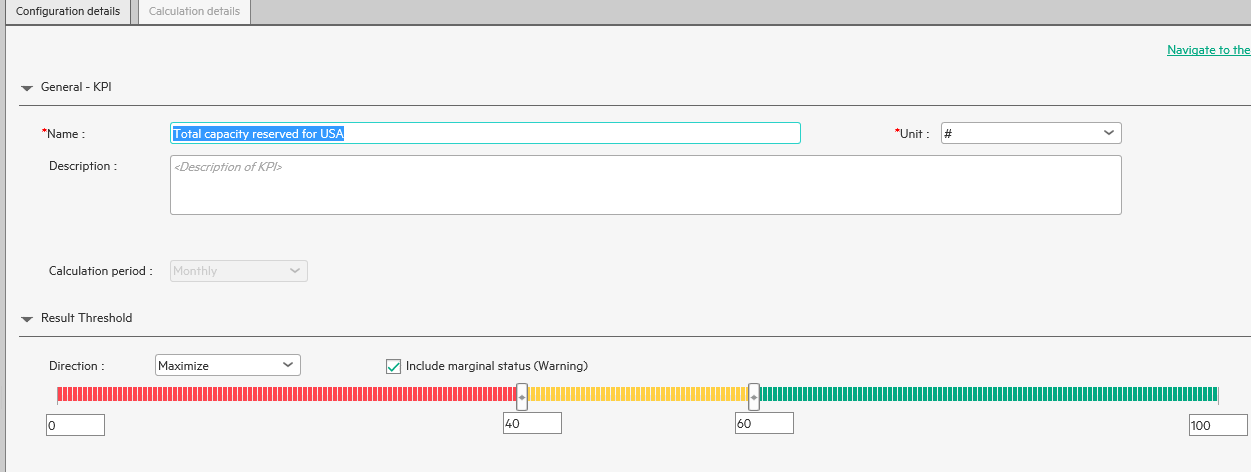
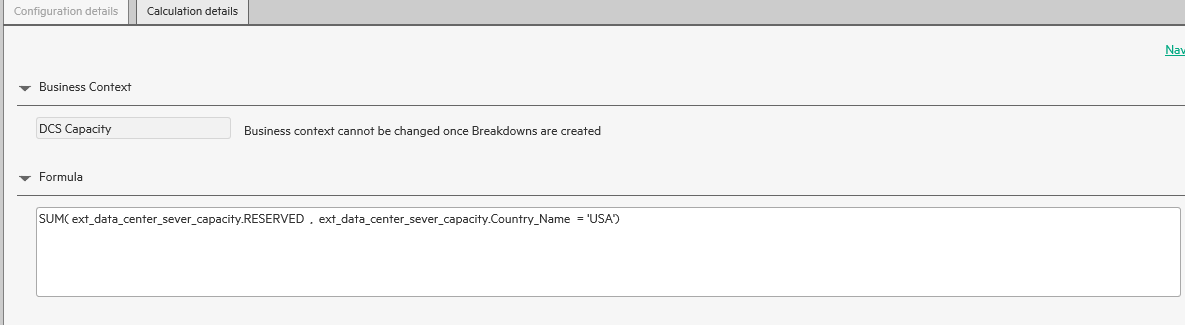
Total capacity reserved for USA
KPI configuration details:
KPI calculation details:
-
-
Create breakdowns (City, Data Center, Room Hierarchy structure) for each KPI
-
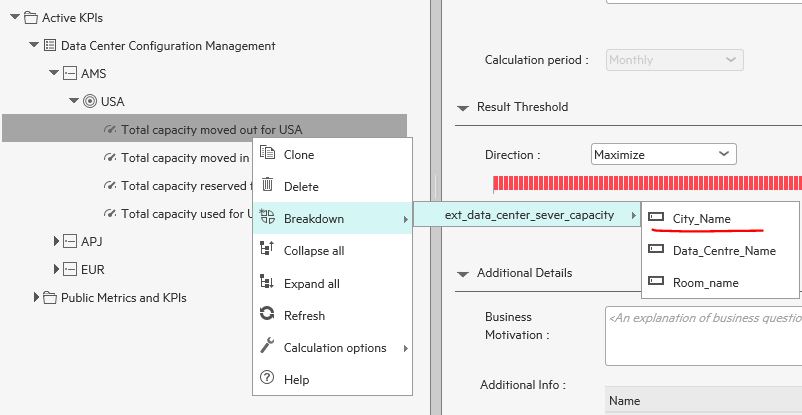
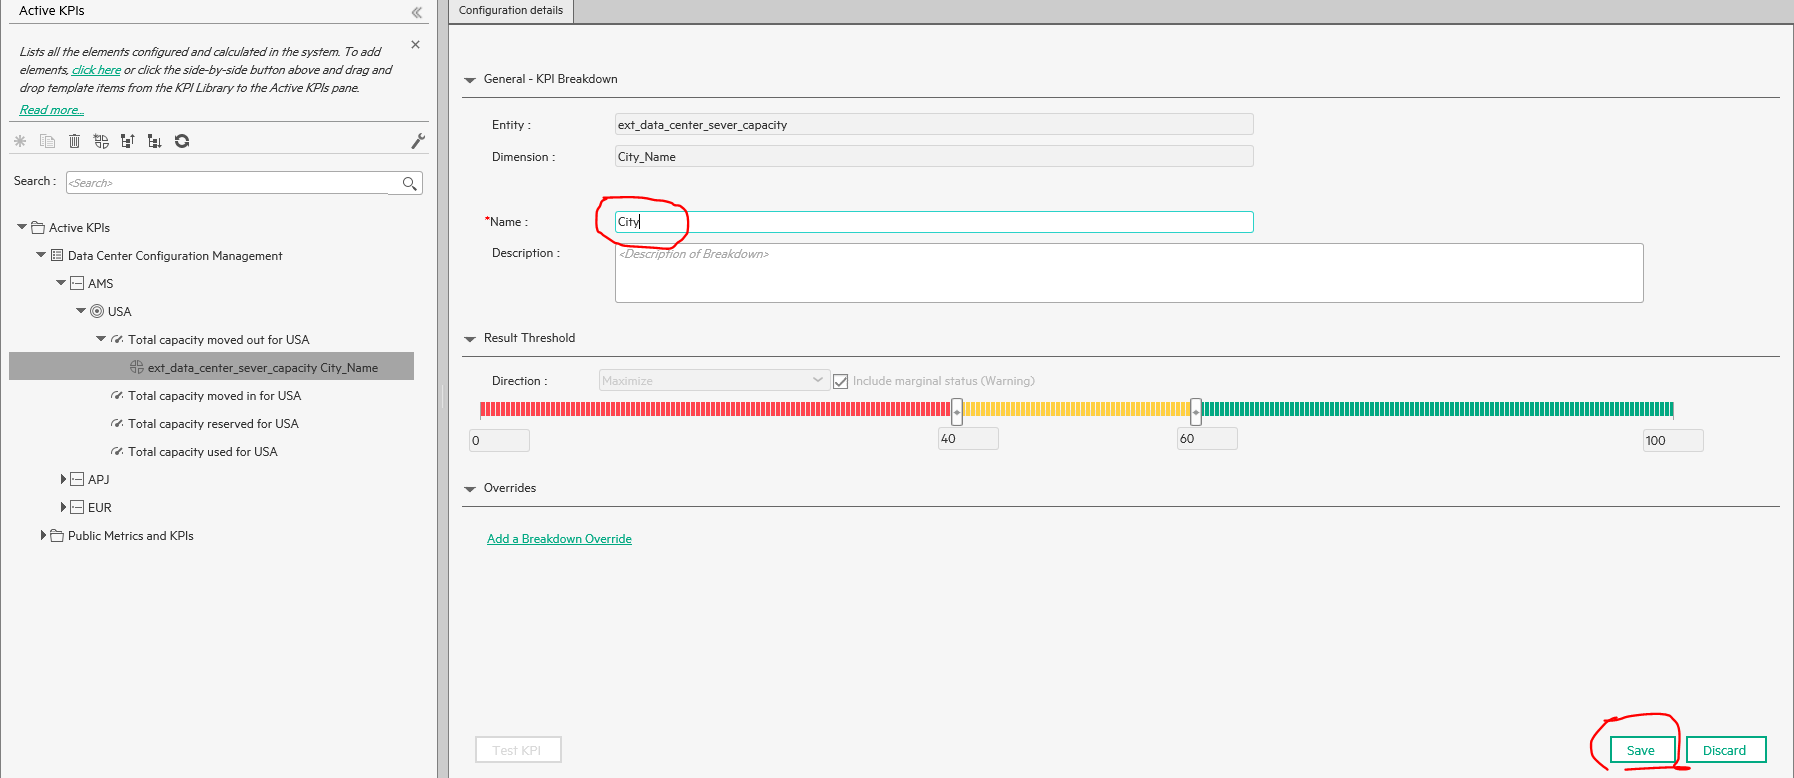
: Createthefirstlevelbreakdown City forTotal capacity moved out for USA:
Modify the breakdown name to City and click save button:
-
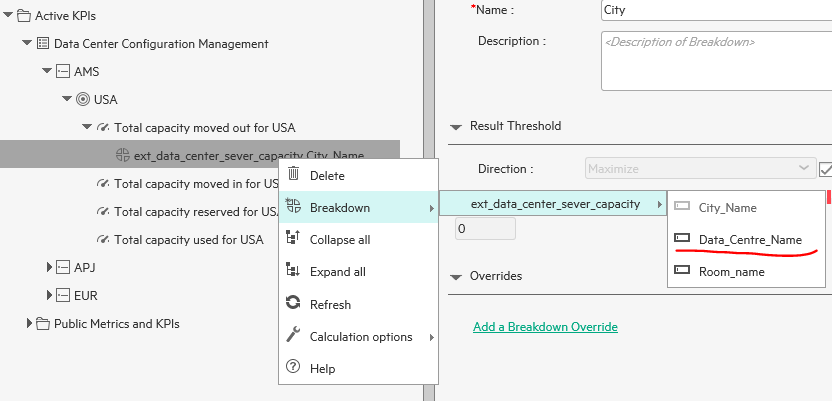
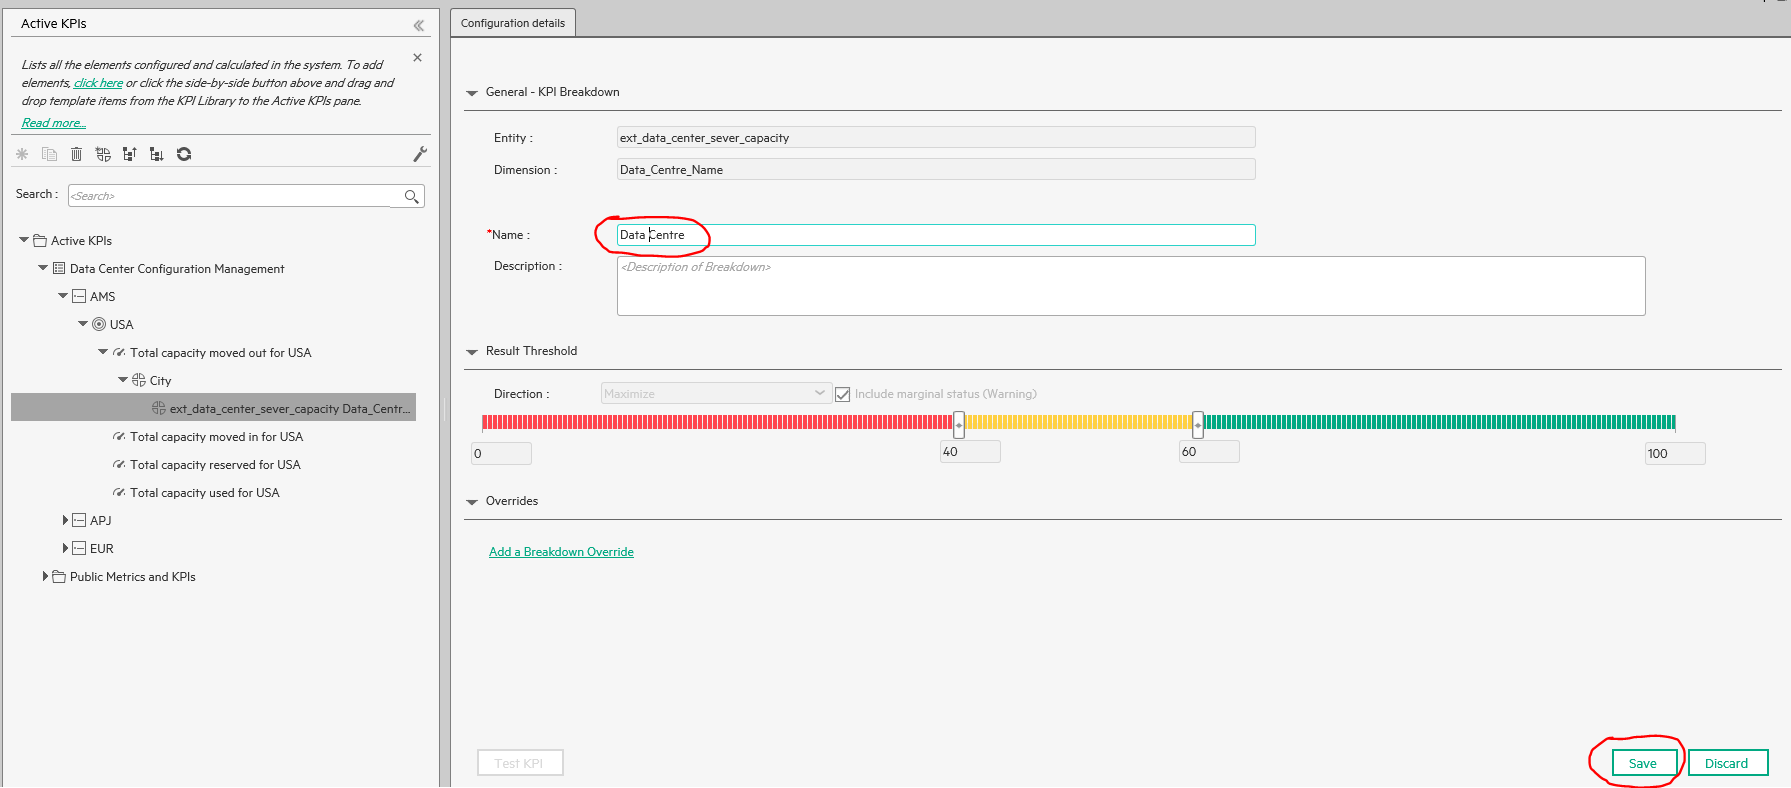
Create the second level breakdown Data Center for Total capacity moved out for USA:
Modify the breakdown name to Data Center and click save button:
-
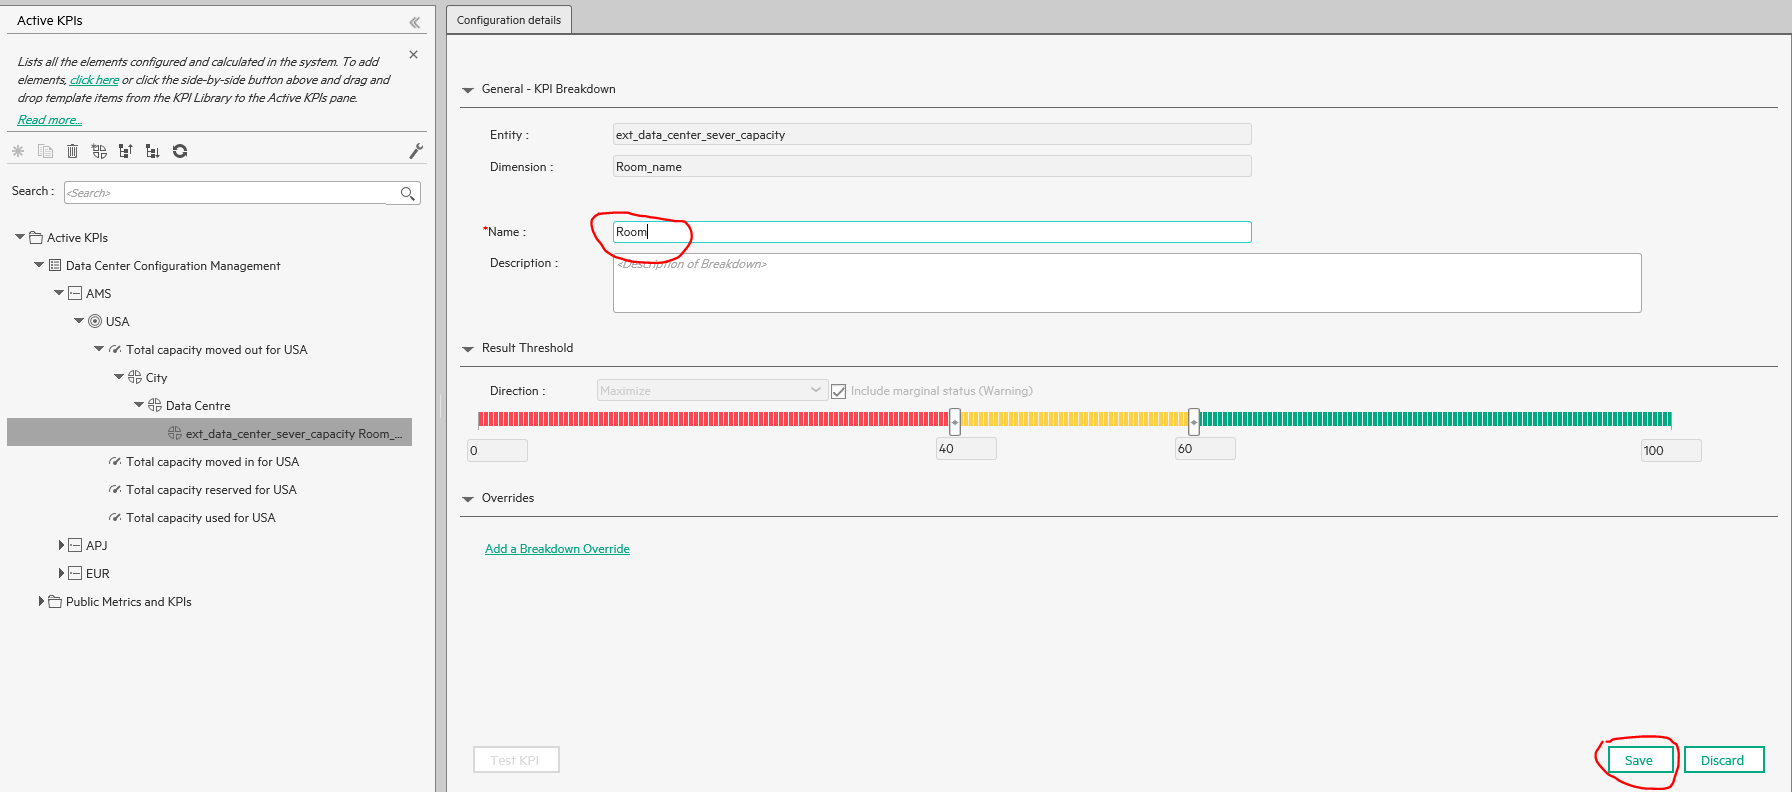
Create the third level breakdown Room for Total amount of capacity that Used for:
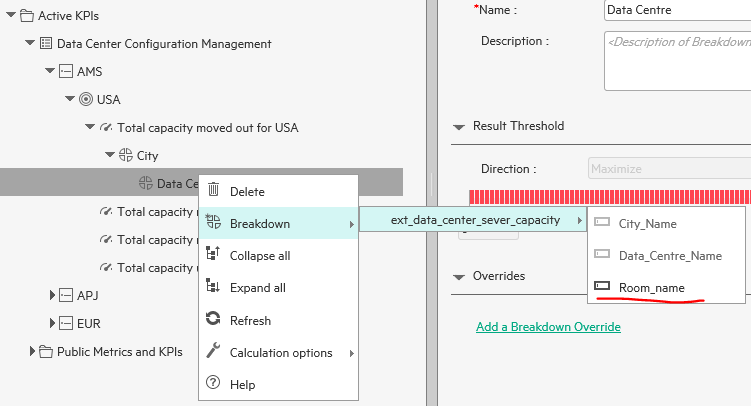
Modify the breakdown name to Room and click save button:
-
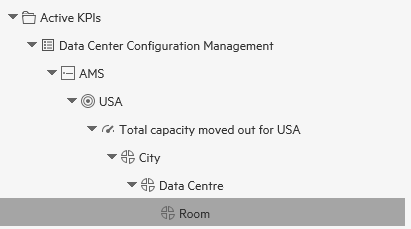
The breakdown Hierarchy structure:
-
-
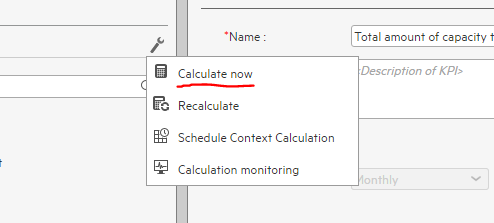
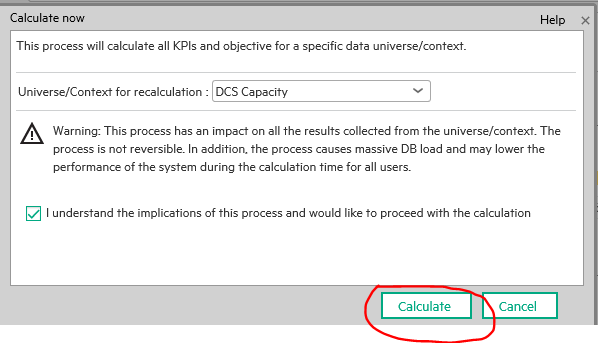
Do the KPI calculation:
-
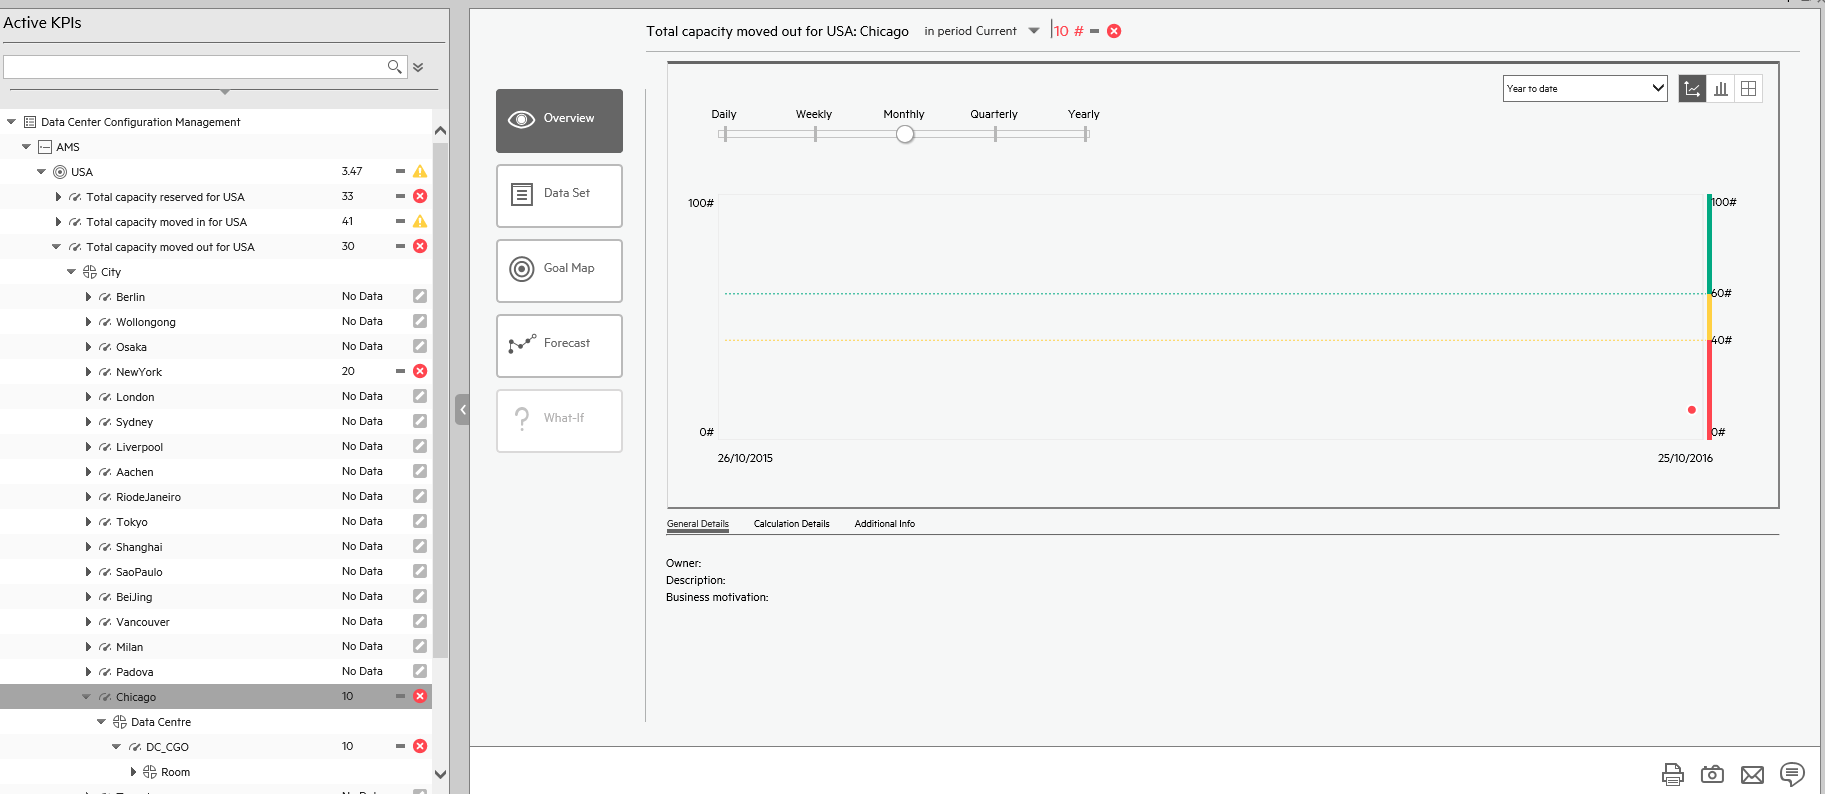
Check the result in explorer
-
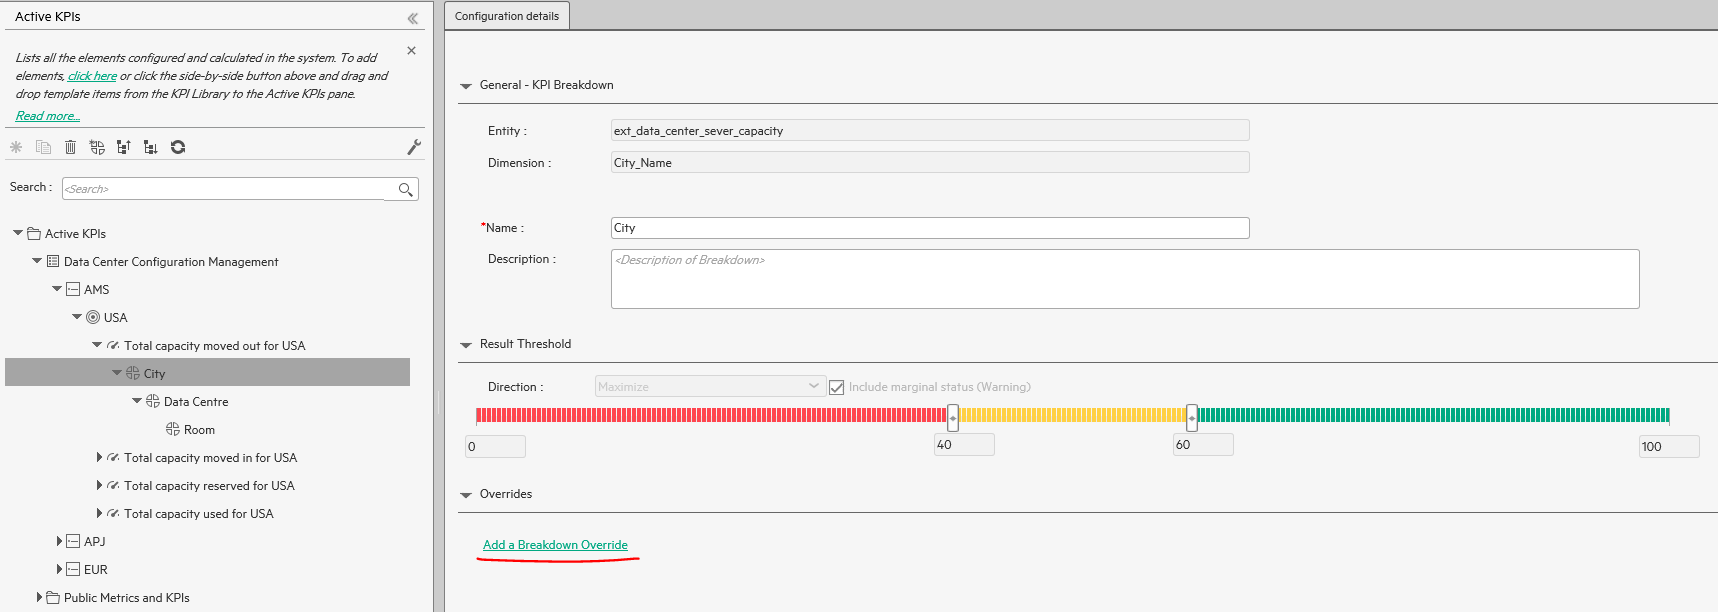
Create breakdown overwrite for the breakdown:
-
Click Add Breakdown Override button:
-
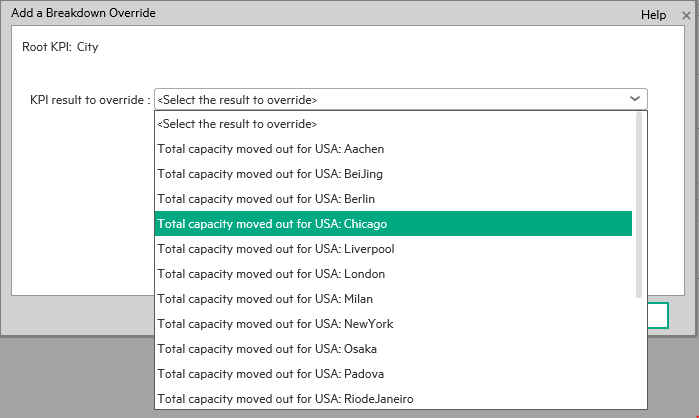
Add one override for this breakdown as following:
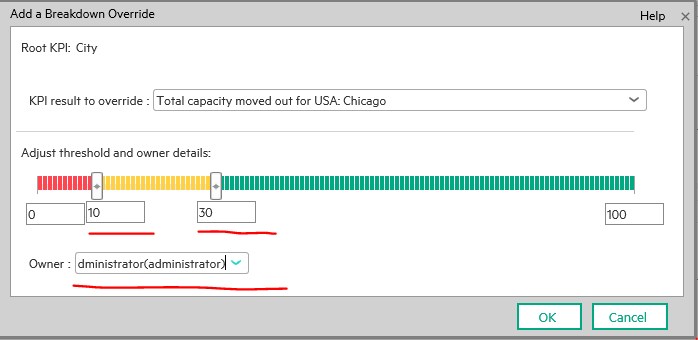
-
-
Save this breakdown
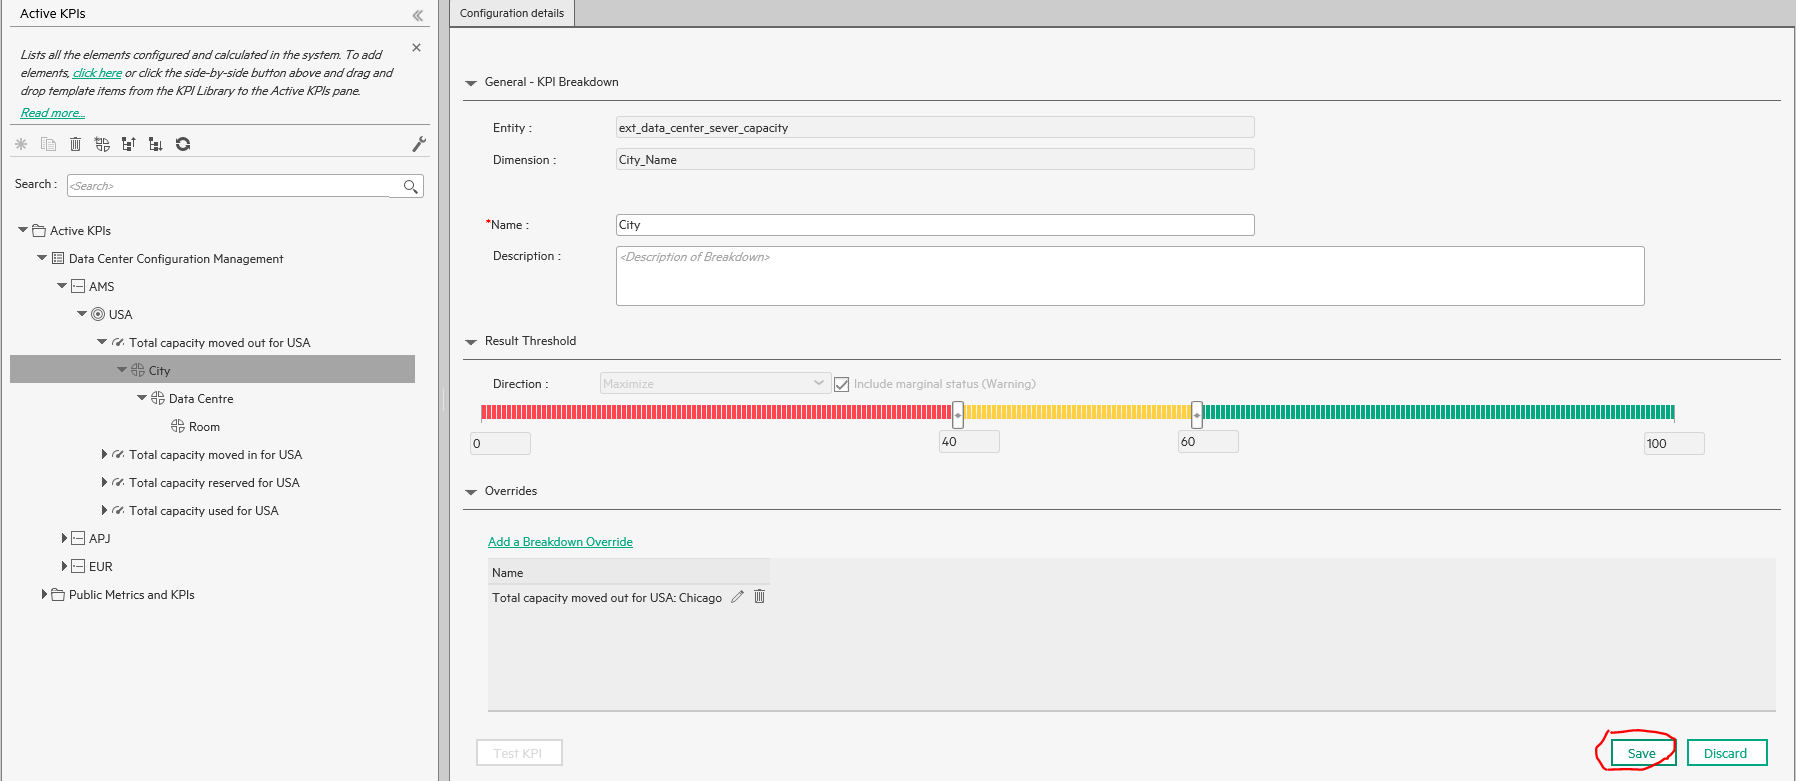
-
Do the KPI calculation:
-
Check the result in explorer:
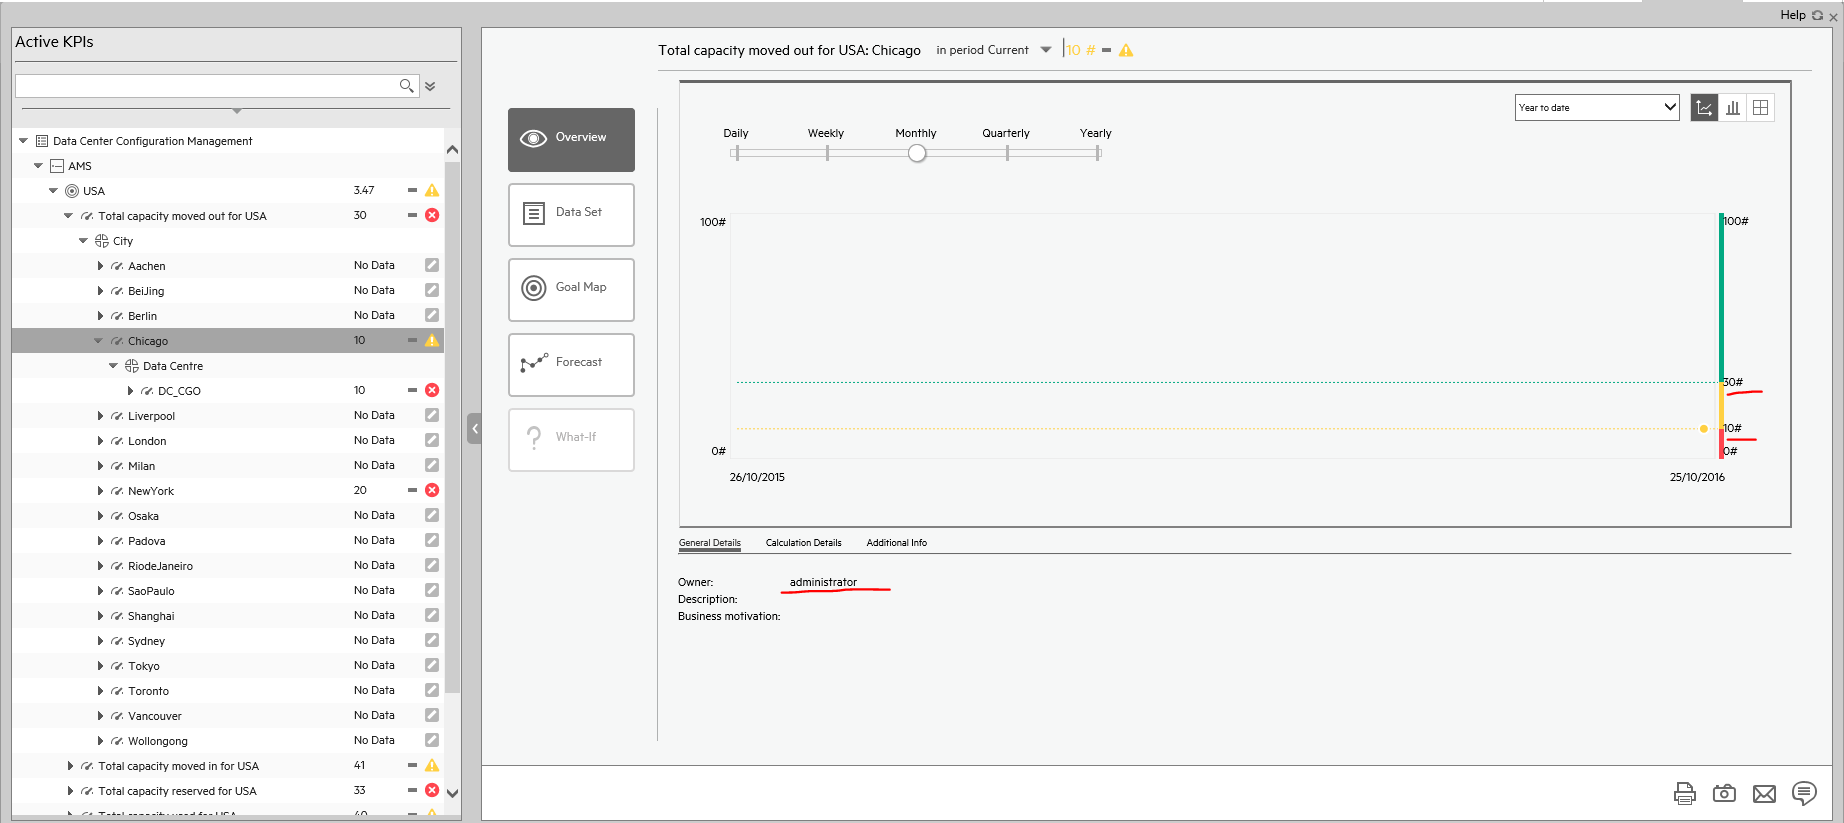
-
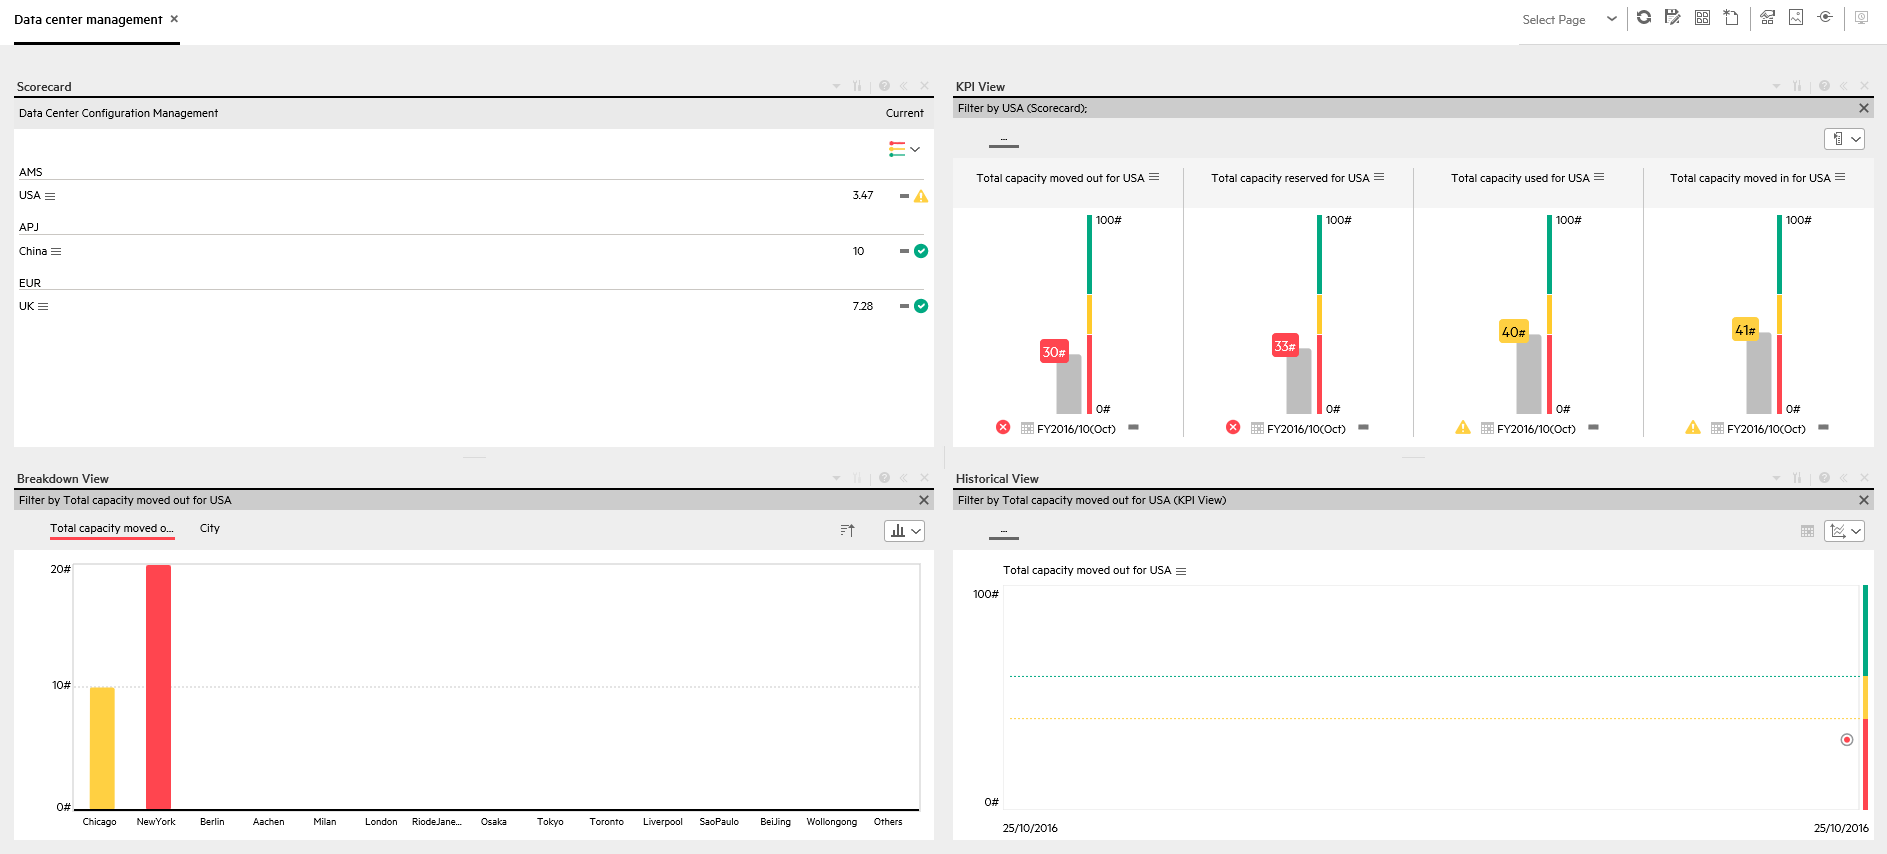
Present data in dashboard page: