


Viewing Charts and Statistics
Viewing Charts
Charts provide a graphical representation of selected data. There are a number of standard charts provided by Analysis Workbench to help visualize various data splits. The standard charts include the variation in scan age, the Scanner used and the split of recognition levels.
In addition, there are two bar charts which plot the number of recognized and unrecognized files against the frequency of their occurrences. The frequency is expressed as a percentage to allow for different numbers of machines loaded.
Charts are available from two sources:
- By selecting an option from the View menu.
- By right-clicking on a column header and clicking the Chart option. These displays a summary count of the column contents with a graphical representation of the results. This option is only available if there is text in that particular column.
The following buttons are available in all charts:
| Button | Function |
|---|---|
| Save As |
The chart can be saved to three different file formats:
|
| Copy |
This button has a drop-down list menu. The chart can be copied to the clipboard in following formats:
|
| Displays a print preview of the chart and allows you to set various print settings. | |
| Options | Displays the Chart Options dialog box, where various options and filters can be set for the chart. |
| Refresh | Refreshes the chart to show any updated information. The chart can be viewed while data is being loaded. |
| OK | Click this button to return to the Analysis Workbench workspace. |
The following options are available in all charts:
| Option | Function |
|---|---|
| Options | |
| 3D chart | Displays the chart in three dimensional graphical form. |
| Show Marks | Displays percentage labels for each segment in the chart. |
| Show Legend | Displays a key to the chart. This allows you to identify what each of the segments or bars represent. |
| Show User-defined Title | Allows you to enter a title of your choice for the chart. Enter the text in the User-defined Chart Title box. |
| Pie Chart | |
| Circular | Displays the statistics as a circular pie chart, otherwise the chart is displayed as an ellipse. |
| Use patterns | Uses a patterned fill for the segments of the pie chart. |
| Explode largest | The largest segment is offset from the main body of the pie chart for emphasis. |
| Other group,% |
Combines the segments less than the defined percentage into one group called Other. Use the arrows to increase or decrease the Other group sections. |
| Legend Position | |
| Left | Positions the legend to the left of the chart |
| Right | Positions the legend to the right of the chart |
| Top | Positions the legend to the top of the chart |
| Bottom | Positions the legend to the bottom of the chart |
| Data Filter (Filters can be applied to reduce the amount of data reported) | |
| Machines | Applies a machines filter to the chart data. |
| Applications | Applies an applications filter to the chart data. |
| Files | Applies a files filter to the chart data. |
| Directories | Applies a directories filter to the chart data. |
| Local | Applies a local tag filter to the chart data. |
| Background Color | Allows you to select a background color from the drop-down list. |
| User-defined Chart Title | Allows you to configure the chart titles as required. This option is only available if the Shown User-defined Title option is checked. |
| Auto Apply | If checked, all changes are applied to the chart as soon as you make them. Otherwise, they are applied when the OK or Apply button is click. |
This chart is displayed by selecting the Charts > Scan file Age option from the View main menu.
The Time since data collected, in months chart is displayed which shows the date of the loaded scan files.
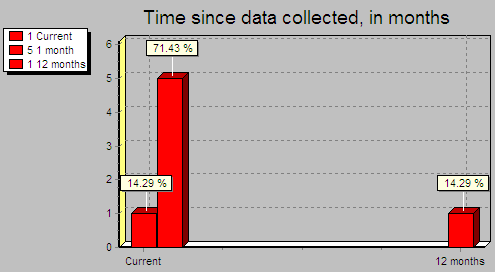
The X axis shows the age of the scan files (in months). The Y axis shows the number of scan files.
The legend (shown in the left corner) allows you to identify the number of scans that belong in an age category.
This example shows:
- One scan (14.29% of the scan files loaded) is 12 months old.
- Five scans (71.43% of the scan files loaded) are 1 month old.
- One scans (14.29%of the scan files loaded) is current (less than 1 month old).
Filters can also be used in the scan file age chart to narrow down and highlight items of particular interest. These filters are set from the Chart options page (click the Options button to access the filters).
Example:
To view the age of the scan for selected machines:
- Tag the machines in the Machines page.
- Apply a Machines filter to the chart data. The chart will display the age of the selected scans only.
The legend shows the number of scans that belong in an age category and the color of the bar that represents it.
This chart is displayed by selecting the Charts > Scan Method option from the View main menu.
This displays a chart of the Scanners used for collecting data chart. For example:
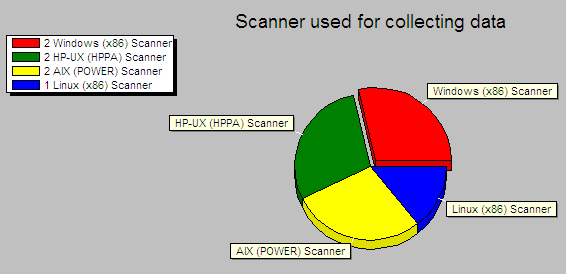
This example shows four segments of a pie chart. It indicates that four types of Scanner have been used to created the scans loaded in Analysis Workbench.
The legend (shown in the left corner) enables you to identify the type of Scanner, the number of scans created using that Scanner and the color of the segment that represents it.
This example shows:
- Two scans have been created using a Windows (x86) Scanner.
- Two scans have been created using an HP-UX (HPPA) Scanner.
- Two scans have been created using a AIX (POWER) Scanner.
- One scan has been created using a Linux (x86) Scanner
Filters can also be used in the Scan method chart to narrow down and highlight items of particular interest. These filters are set from the Chart options page (click the Options button).
Example:
To view the method used for scanning a machine that contains a particular application:
- Tag the application in the Applications page.
- Apply an Applications filter to the chart data. The chart will display the Scanner that was used to scan the machine containing that application.
The legend shows the type of Scanner used, the number of scans created using that Scanner and the color of the segment that represents it.
This chart is displayed by selecting the Charts > Recognition option from the View main menu.
This displays the Recognition statistics chart which shows Main, Associated, 3rd Party and Unknown files.
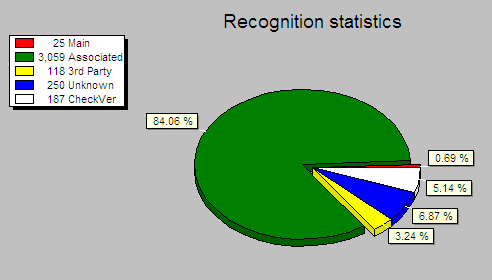
This example shows a pie chart with five segments.
The legend (shown in the left corner) enables you to identify the type of files recognized, the number of files in that category and the segments that represents them.
This example shows:
- 25 files (0.69%) have been recognized as Main files.
- 3,059 files (84.06%) are Associated files.
- 118 files (3.24%) are 3rd Party files.
- 250 files (6.87%) have been recognized as Unknown files.
- 187 files (5.14%) are CheckVer files.
For more information, see the section describing Display/Storage Filter for descriptions of these file recognition categories.
Filters can also be used in the Recognition chart to narrow down and highlight items of particular interest. These filters are set from the Chart options page (click the Options button).
Example:
To view the recognition statistics for all Main files recognized:
- In the Files window, locate an entry that has Status of 1 Main. This is the status setting for Main files.
- Right-click on this entry in the Status column and select the Tag > Status is 1 Main option. A Global tag is applied to all files in this window that are Main files.
- Apply a Files filter to the chart data. The chart will display the Scanner that was used to scan the machine containing that application.
The legend (shown in the left corner) allows you to identify the type of files recognized, the number of files in that category and the color of the segments that represents them.
This chart is displayed by selecting the Charts > Unrecognized/File frequency option from the View main menu.
This displays a bar chart that can be used to determine the quality of recognition on a population.
Unrecognized files are shown split by the number of copies.
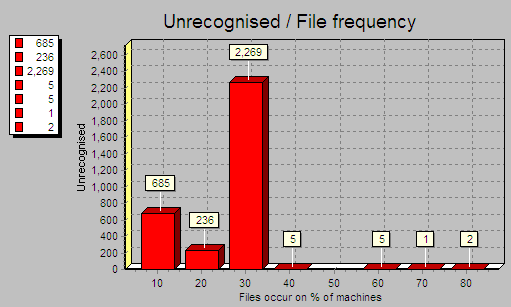
The X axis shows number of files that occur on a given percentage of machines loaded.
The Y axis shows the number of unrecognized files. It is an absolute count of different, unrecognized file entries.
The legend (shown in the left corner) enables you to identify the number of unrecognized files.
Filters can also be used in the Unrecognized/File Frequency chart to narrow down and highlight items of particular interest. These filters are set from the Chart options page (click the Options button).
Other charts are available by right-clicking on a column header and clicking the Chart option.
These charts display a summary count of the column contents with a graphical representation of the results. This option is only available if there is text in that particular column.
To display a chart for a particular column:
- Right-click on a column header
- Select the Chart option
Example
To view the version of the Universal Discovery software that was used to create the scans:
- In the Machines window. Click on the Columns button to display the Select columns to display dialog box.
- Click on the + sign next to the Scan file category.
- Select Scan file version. The Scan file version column will now be displayed in the Machines window.
- Right-click on the Scan file Version column header and select the Chart option.
A chart is displayed, which shows the versions of the software that was used to create the scans.
The legend shows the number of scans created by a particular version and the color of the segment that represents the version.
The Audit statistics option in the View menu displays the Audit Statistics dialog box.
Audit statistics present summary information about the loading and recognition data as well as memory consumption. The statistics are:
- Files scanned
- Files loaded
- Files recognized
- Different files loaded
- Different directories loaded
- Machines loaded
- Dynamic memory in use
- Operating System memory committed
Note If one or more scan files have been unloaded, the audit statistics are no longer available until Analysis Workbench has been closed down and restarted.