


Navigate OO Designer
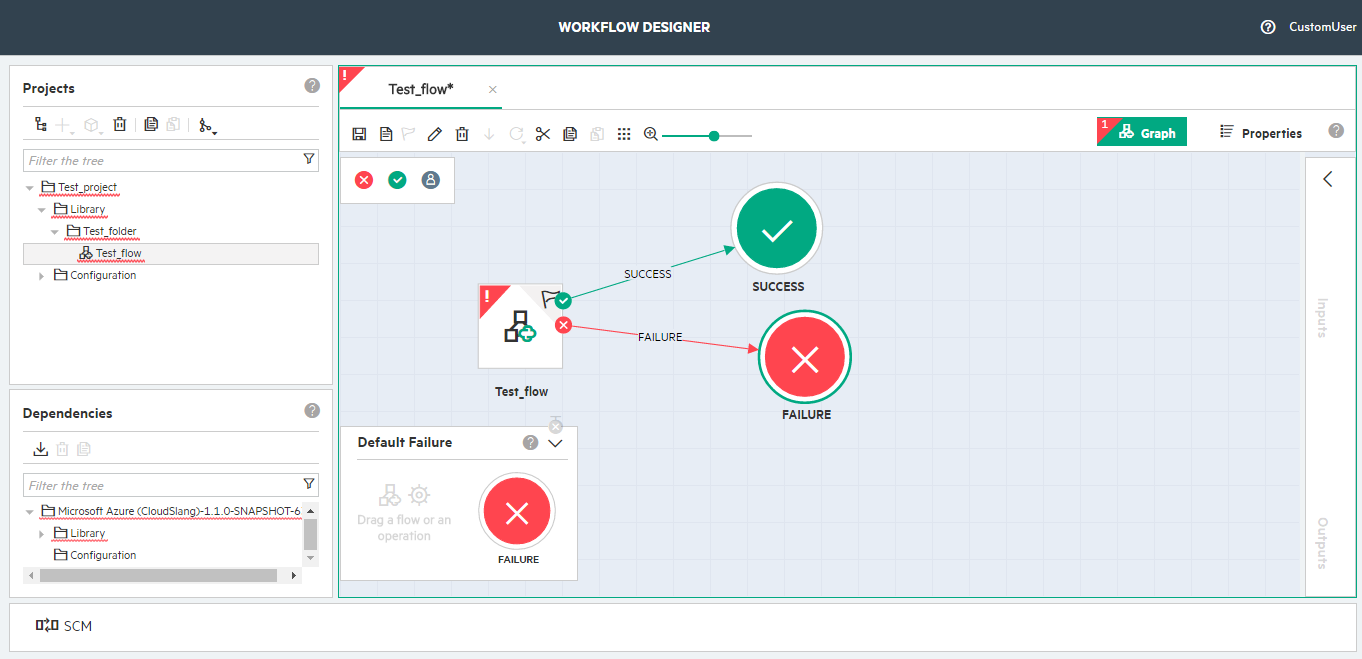
The OO Designer UI includes several sections:
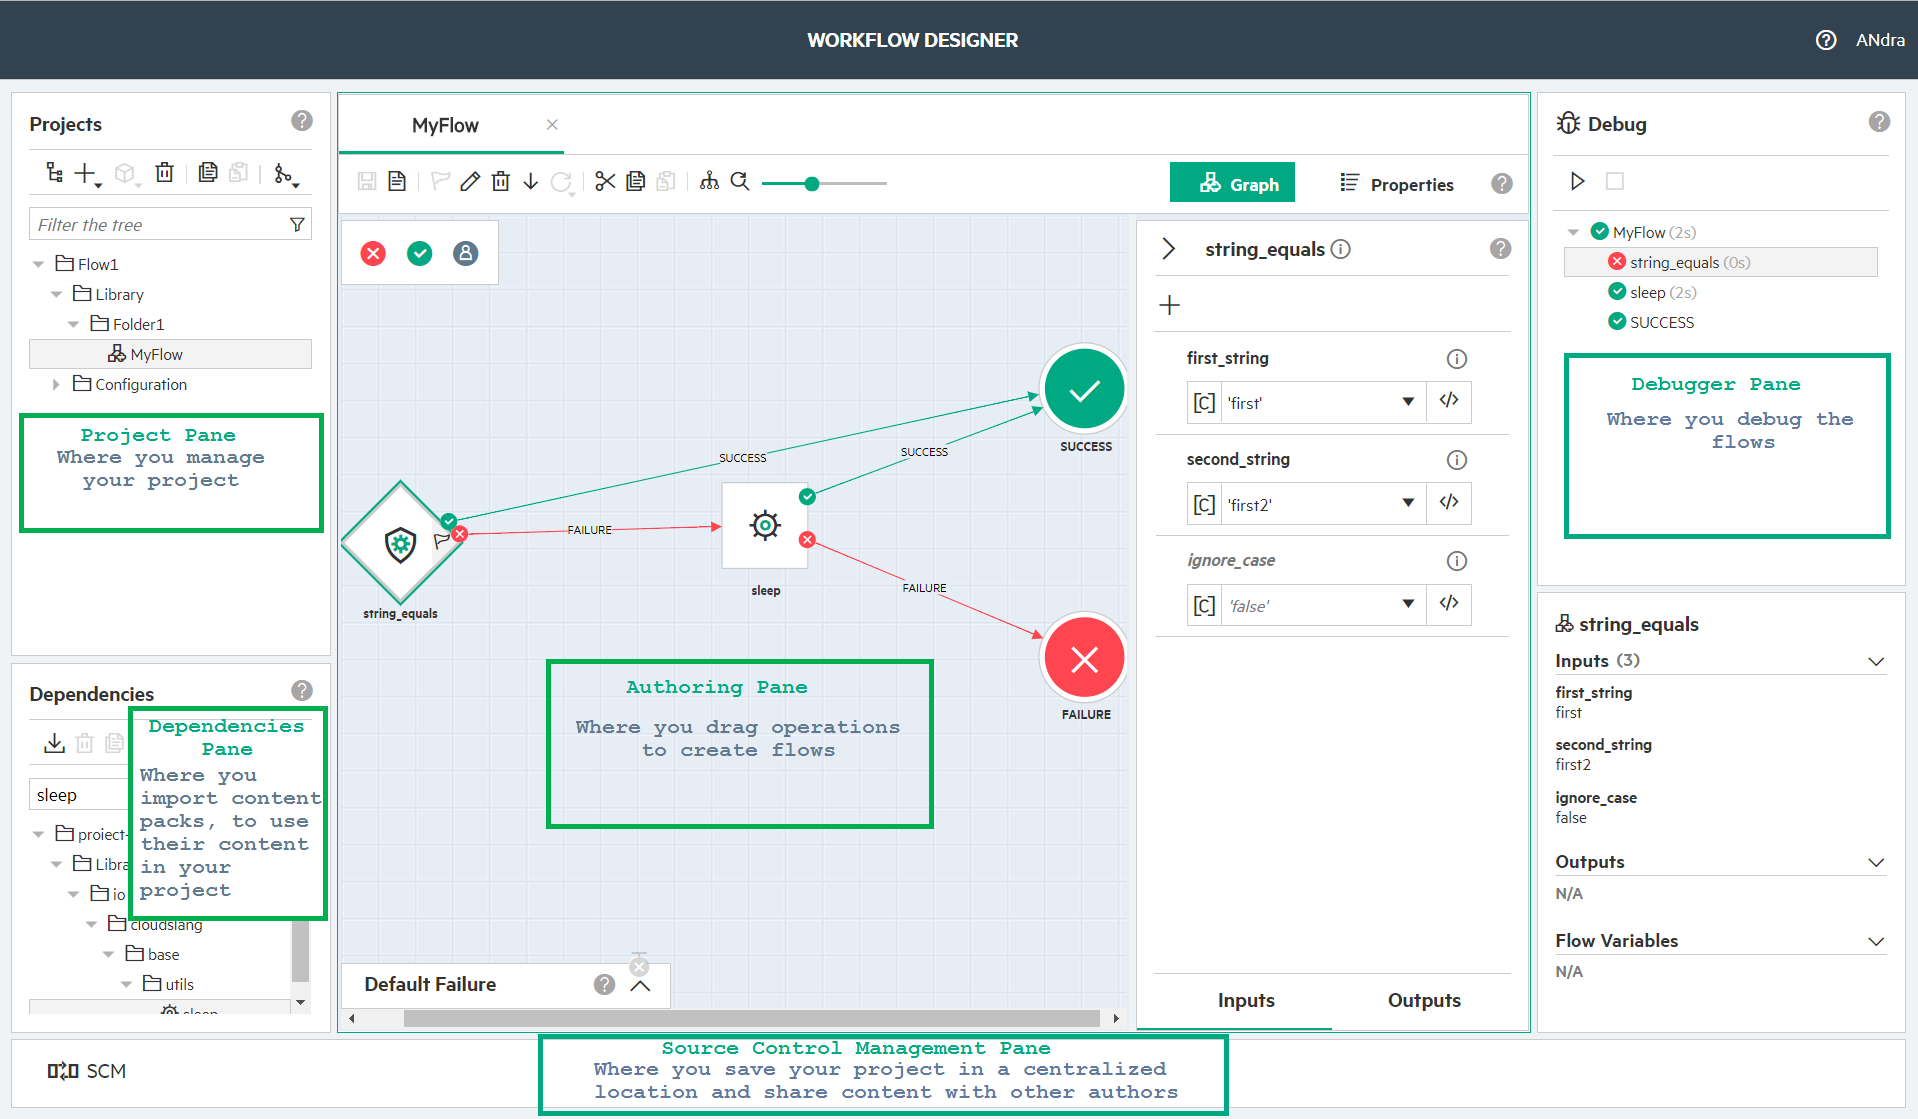
Projects Pane
The Projects pane on the top-left shows the project you are currently working on. It displays the editable flows and configuration items that you can use in the project.
For more information about how to work with the OO Designer panes, see Set up the OO Designer Project
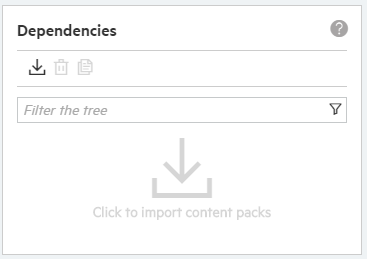
Dependencies Pane
The Dependencies pane on the bottom-left shows the imported content packs. You can import existing content packs and use its flows, operations and configuration items in your flows.
For more information on how to work with the OO Designer panes, see Set up the OO Designer Project.
Authoring Pane
The Authoring pane is a rectangular box in the middle. It contains the canvas to work on flows. You can launch a flow onto the canvas area by double-clicking a flow from the Projects pane.
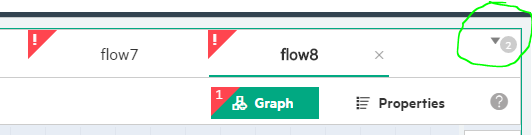
If you are working on multiple flows, they are indicated in tabs with the corresponding flow names. Some of these tabs are hidden from view and are displayed in the top-right corner of the authoring pane with a number indicating a number of hidden tabs  .
.
Click the arrow to view a list of hidden tabs, and then point and click to select a hidden flow to open.
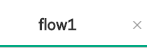
You can close a flow by clicking the x displayed next to the flow name.
For more information about how to work with the OO Designer panes, see Set up the OO Designer Project.
Properties Pane
The Properties pane contains the Description/Inputs/Outputs/Results tabs about the current flow. For details, see Define Flow Properties.
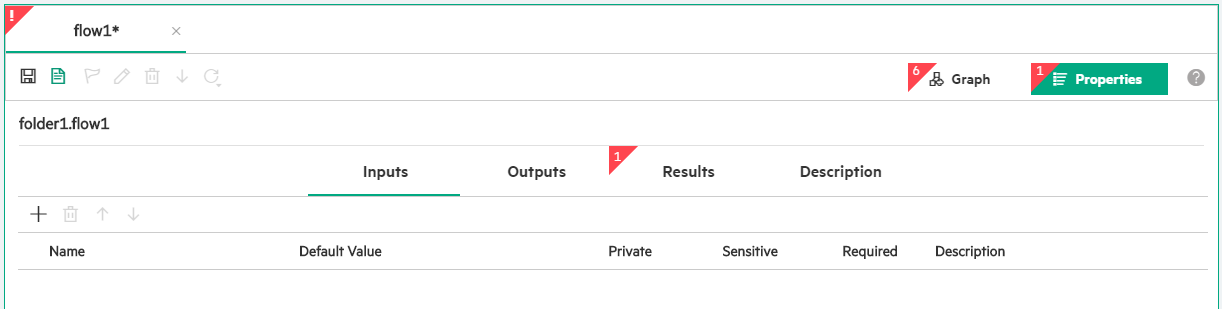
- Click the Inputs tab to display the Inputs pane. This is where you can add and configure inputs for the flow.
- Click the Outputs tab to display the Outputs pane. This is where you can add and configure outputs for the flow.
- Click the Results tab to display the Results pane. This is where you can view the results for the flow, and also configure the descriptions.
- Click the Description tab to display the Description pane. This is where you can enter the description for the flow.
For more information about how to work with the OO Designer panes, see Set up the OO Designer Project.
Graph Pane
The Graph pane is the graphical representation of a flow with the Inputs and Outputs in tabs.
Select the relevant step on the canvas, and:
- Click the Inputs tab at the bottom of the right pane to display the Inputs pane. This is where you can view the inputs for the step that correspond to the step operation inputs.
- Click the Outputs tab at the bottom of the right pane to display the Outputs pane. This is where you can add and configure outputs for the step.
For more information about how to work with the OO Designer panes, see Set up the OO Designer Project.
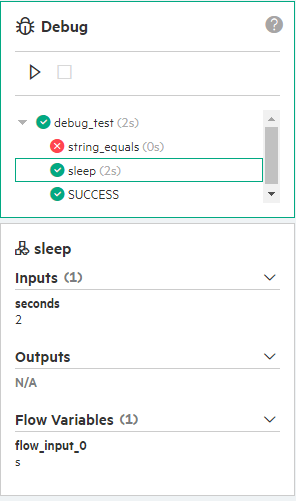
Debugger Pane
The Debugger pane enables you to test the Flows.
To open the Debugger pane:
- Select the relevant Flow on the canvas.
- Click
 or inverted Debug text to expand or collapse the pane with the Run Tree that has expandable nodes of the flow in a graphical mode.
 - Select a node in the tree to display the context of that Flow in the Context Inspector
For more information about how to Debug the Flow or Step, see Debug the Flow
SCM Pane
This is where you save your project in a centralized location and share content with other authors. For details, see Set up and work with Source Control Management.