
Searching the Help
To search for information in the Help, type a word or phrase in the Search box. When you enter a group of words, OR is inferred. You can use Boolean operators to refine your search.
Results returned are case insensitive. However, results ranking takes case into account and assigns higher scores to case matches. Therefore, a search for "cats" followed by a search for "Cats" would return the same number of Help topics, but the order in which the topics are listed would be different.
| Search for | Example | Results |
|---|---|---|
| A single word | cat
|
Topics that contain the word "cat". You will also find its grammatical variations, such as "cats". |
|
A phrase. You can specify that the search results contain a specific phrase. |
"cat food" (quotation marks) |
Topics that contain the literal phrase "cat food" and all its grammatical variations. Without the quotation marks, the query is equivalent to specifying an OR operator, which finds topics with one of the individual words instead of the phrase. |
| Search for | Operator | Example |
|---|---|---|
|
Two or more words in the same topic |
|
|
| Either word in a topic |
|
|
| Topics that do not contain a specific word or phrase |
|
|
| Topics that contain one string and do not contain another | ^ (caret) |
cat ^ mouse
|
| A combination of search types | ( ) parentheses |
|


![]()
![]()

- End User - View and Analyze the Business Objectives
- Dashboard
- Change, On-the-fly, the Component Display Format
- Change, On-demand, the Periodicity Used in a Component Display
- Change, On-Demand, the Breakdown Display
- First Level Navigation (FLN) for an Objective, a KPI, or a Metric
- Explorer
- Explorer - Overview
- Explorer - Data Set
- Explorer - Goal Map
- Explorer - Forecast
- Explorer - What If
- Explorer - Annotations
From a Scorecard component in a page, move the cursor above the ![]() or
or ![]() icon at the end of the Objective's name to view over time information about the Objective, details about the Objective's KPIs and the annotations added to the Objective by users.
icon at the end of the Objective's name to view over time information about the Objective, details about the Objective's KPIs and the annotations added to the Objective by users.
From any other out-of-the-box component, moving the cursor above the ![]() or
or ![]() icon near the KPI name to view over time information about the KPI, its value, trend, status, breakdowns details and the annotations added to the KPI.
icon near the KPI name to view over time information about the KPI, its value, trend, status, breakdowns details and the annotations added to the KPI.
From the Pie Chart and the Historical Metric View components, moving the cursor above the ![]() or
or ![]() icon near the Metric name to view over time information about the Metric, its value, trend, breakdowns details and the annotations added to the Metric.
icon near the Metric name to view over time information about the Metric, its value, trend, breakdowns details and the annotations added to the Metric.
Move the cursor above the ![]() or
or ![]() near a KPI or Metric in a Dashboard component to display the KPI First Level Navigation (FLN) area.
near a KPI or Metric in a Dashboard component to display the KPI First Level Navigation (FLN) area.
Move the cursor above the ![]() or
or ![]() near an Objective in a Scorecard component to display the Objective First Level Navigation (FLN) area.
near an Objective in a Scorecard component to display the Objective First Level Navigation (FLN) area.

 Display more information about a specific Objective
From a Scorecard component in a page, move the cursor above the ![]() or
or![]() icon at the end of the Objective's name to view over time information about the Objective, details about the Objective's KPIs and the annotations added to the Objective by users.
icon at the end of the Objective's name to view over time information about the Objective, details about the Objective's KPIs and the annotations added to the Objective by users.
You can also add annotations, send them by email, reach Additional Info, PDF it, or print it. For details, see Objective First Level Navigation (FLN) area.
Display more information about a specific KPI or Metric
From any other out-of-the-box component, move the cursor above the ![]() or
or![]() icon at the end of the KPI name to view over time information about the KPI, its value, trend, and status,details of KPI Breakdowns, and the annotations added to the KPI by other users.
icon at the end of the KPI name to view over time information about the KPI, its value, trend, and status,details of KPI Breakdowns, and the annotations added to the KPI by other users.
From any other out-of-the-box component, move the cursor above the ![]() or
or![]() icon at the end of the Metric name to view its over time information, value, trend, breakdowns details and the annotations added to the Metric.
icon at the end of the Metric name to view its over time information, value, trend, breakdowns details and the annotations added to the Metric.
You can also add annotations, send them by email, PDF it, or print it, and if relevant view additional information for the KPI or Metric. For details, see First Level Navigation (FLN) area.
Use Case - Add an Annotation, Send Email, Save as PDF, and Print
For details, see Add an Annotation, Send Email, Save as PDF, and Print .

First Level Navigation (FLN) area
For a KPI

For a Metric:
User interface elements are described below (when relevant, unlabeled elements are shown in angle brackets):
|
UI Element |
Description |
|---|---|
|
Name> |
The name of the KPI or Metric. |
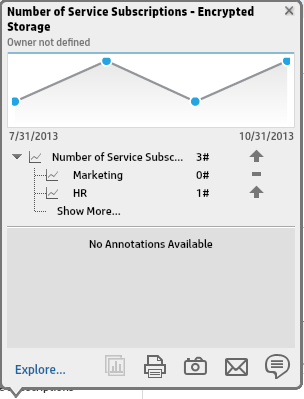
| <Over Time value> |
The graph displays the over time value of the KPI or Metric for 5 periods in the past from the period configured in the Display Period for the KPI or Metric. Example If the KPI or Metric Display Period is 1 month, the graph displays the value of the KPI or Metric over the past 5 months from the period configured in the Display Period. To add an annotation to the chart, you can click |
| <KPI, KPI Breakdown, Metric, or Metric Breakdown> |
This section displays:
|
|
Annotations |
Lists the last 2 annotations sent by all users (including the current user). If more than 2 annotations have been sent for the selected KPI or Metric, only 2 are displayed followed by a Show more link. Click the link to open Explorer filtered for the selected KPI or Metric, where you can see all the annotations of the selected KPI or Metric. |

|
Add annotation. Opens a box where you can add your annotation:
Enter the text of the annotation and click Add to add the annotation to the list or Discard to discard the annotation. |

|
Send mail. Opens an Outlook email that includes:
Note The link does not request a user/password combination when it is activated during the same session. |
|
|
Save snapshot. Opens your list of directories, where you can select the location of the PDF you are creating. |

|
Print. Opens a dialog box where you can select and configure the printer, and send the FLN area contents to print. |

|
Additional info. Opens a pop up that lists all the additional info configured for the KPI or Metric: reports, Dashboard pages, or external URLs. The button is enabled only when the KPI or Metric has additional information.
|
| Explore |
Click to open Explorer filtered by the selected KPI or Metric. For details, see About Explorer. |


Objective First Level Navigation (FLN) area

User interface elements are described below (when relevant, unlabeled elements are shown in angle brackets):
|
UI Element |
Description |
|---|---|
|
Name> |
The name of the Objective. |
| <Over Time value> |
The graph displays the over time value of the Objective for 5 periods in the past from the period that was configured for the Objective. The periods displayed are based on the period configured for the Objective. Example If the Objective period is 1 month, the graph displays the value of the Objective over the past 5 months. To add an annotation to the chart, you can click |
| <Objective> |
This section displays:
Note
|
|
Annotations |
Lists the last 2 annotations sent by all users (including the current user). If more than 2 annotations have been sent for the selected Objective, only 2 are displayed followed by a Show more link. Click the link to open Explorer filtered for the selected Objective, where you can see all the annotations of the selected Objective. |
|
|
Add annotation. Opens a box where you can add your annotation:
Enter the text of the annotation and click Add to add the annotation to the list or Discard to discard the annotation. |
|
|
Send mail. Opens an Outlook email that includes:
Note The link does not request a user/password combination when it is activated during the same session. |
|
|
Save snapshot. Opens your list of directories, where you can select the location of the PDF you are creating. |
|
|
Print. Opens a dialog box where you can select and configure the printer, and send the FLN area contents to print. |
|
|
Additional info. Opens a pop up that lists all the additional info configured for the Objective: reports, Dashboard pages, or external URLs. The button is enabled only when the Objective has additional information.
|
| Explore | Click to open Explorer filtered by the selected Objective. For details, see About Explorer. |

We welcome your comments!
To open the configured email client on this computer, open an email window.
Otherwise, copy the information below to a web mail client, and send this email to SW-Doc@hpe.com.
Help Topic ID:
Product:
Topic Title:
Feedback: