
Searching the Help
To search for information in the Help, type a word or phrase in the Search box. When you enter a group of words, OR is inferred. You can use Boolean operators to refine your search.
Results returned are case insensitive. However, results ranking takes case into account and assigns higher scores to case matches. Therefore, a search for "cats" followed by a search for "Cats" would return the same number of Help topics, but the order in which the topics are listed would be different.
| Search for | Example | Results |
|---|---|---|
| A single word | cat
|
Topics that contain the word "cat". You will also find its grammatical variations, such as "cats". |
|
A phrase. You can specify that the search results contain a specific phrase. |
"cat food" (quotation marks) |
Topics that contain the literal phrase "cat food" and all its grammatical variations. Without the quotation marks, the query is equivalent to specifying an OR operator, which finds topics with one of the individual words instead of the phrase. |
| Search for | Operator | Example |
|---|---|---|
|
Two or more words in the same topic |
|
|
| Either word in a topic |
|
|
| Topics that do not contain a specific word or phrase |
|
|
| Topics that contain one string and do not contain another | ^ (caret) |
cat ^ mouse
|
| A combination of search types | ( ) parentheses |
|


![]()
![]()

- End User - View and Analyze the Business Objectives
- Dashboard
- Change, On-the-fly, the Component Display Format
- Change, On-demand, the Periodicity Used in a Component Display
- Change, On-Demand, the Breakdown Display
- First Level Navigation (FLN) for an Objective, a KPI, or a Metric
- Explorer
- Explorer - Overview
- Explorer - Data Set
- Explorer - Goal Map
- Explorer - Forecast
- Explorer - What If
- Explorer - Annotations
In some Dashboard page components, you can change locally the periodicity used in the component display.
In the relevant component, click  and select the relevant periodicity to modify the display on-the-fly.

 Change, on-demand, the periodicity used in the component display
Note In the following components and only for specific formats , the icon indicates that you can select a different periodicity to display the data. The components are:
-
Click the
icon in the relevant component.Note After activating the on-demand periodicity:
- The component does not show the
 or
or  FLN icon because the calculation is temporary, except for KPIs or Metrics for which the selected on-demand periodicity corresponds to their default periodicity.
 - To restore the original display, click the Breadcrumbs blue line when available or in multi-line format, slide the button to the Default position in the on-demand periodicity slider.
- When you click a gauge or a line (in a multi-line format) for a KPI or Metric with Breakdowns, their values are displayed for the selected on-demand periodicity. Click the Breadcrumbs blue line to restore the original display.
- The calculations are performed on-demand and are temporary. When you leave the page and return to it, the original display is restored.
- The component does not show the
-
In the Gauge or Bar format:
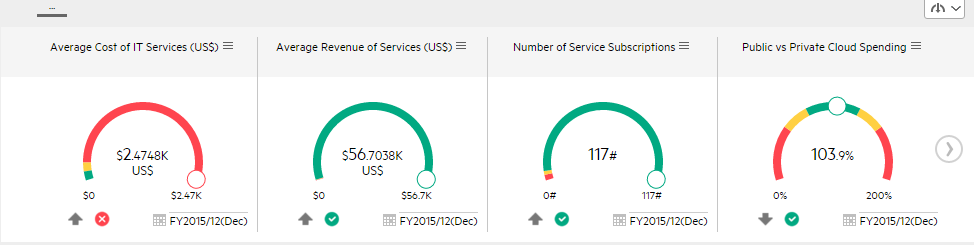
-
Click the
icon at the bottom of the graph to display the on-demand periodicity calendar: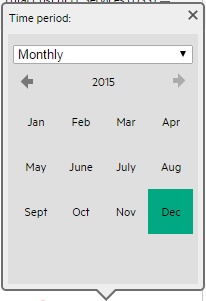
-
Select the time period in the dropdown list:
-
Current
The KPI or Metric is recalculated (temporarily) for the current period corresponding to the periodicity defined for the KPI or Metric.
For example, if the KPI periodicity is monthly, the recalculation is performed for the current month up to the current day; if the KPI periodicity is weekly, the recalculation is performed for the current week up to the current day.
-
Last Closed
The KPI or Metric is recalculated (temporarily) for the closed period preceding the current period, corresponding to the periodicity defined for the KPI or Metric.
For example, if the KPI periodicity is monthly, the recalculation is performed for the previous month; if the KPI periodicity is weekly, the recalculation is performed for the previous week.
-
Yearly
Select the required year in the KPI or Metric list of years. Future years are disabled. The KPI or Metric is recalculated (temporarily) for that year.
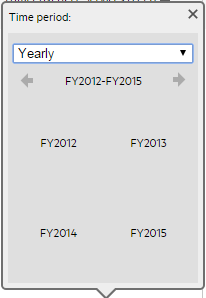
Note When the KPI or Metric default periodicity is yearly, the yearly calendar is automatically displayed.
-
Quarterly
Select the required quarter in the calendar. Future years are disabled. The KPI or Metric is recalculated (temporarily) for the selected quarter.
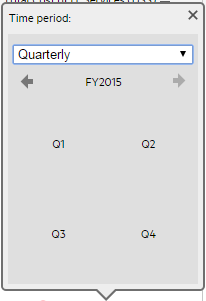
Note When the KPI or Metric default periodicity is quarterly, the quarterly calendar is automatically displayed.
-
Monthly
Select the required month in the calendar. Future months, and years are disabled. The KPI or Metric is recalculated (temporarily) for the selected month.
Note When the KPI or Metric default periodicity is monthly, the monthly calendar is automatically displayed.
-
Weekly
Select the required week in the calendar. Future weeks, months, and years are disabled. The KPI or Metric is recalculated (temporarily) for the selected week.

Note When the KPI or Metric default periodicity is weekly, the weekly calendar is automatically displayed.
-
Daily
Select the required day in the calendar. Future days, months, and years are disabled. The KPI or Metric is recalculated (temporarily) for the selected day.
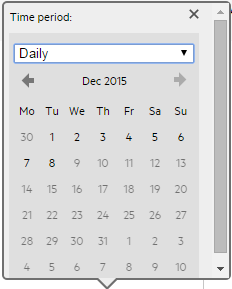
Note When the KPI or Metric default periodicity is daily, the daily calendar is automatically displayed.
-
- The display is automatically and locally modified.
-
-
In a multi-line format.
-
Click the
icon at the top right-corner of the graph to display the on-demand periodicity slider: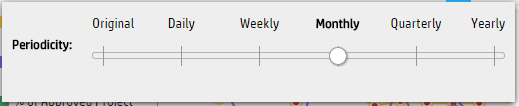
Slide the button to the relevant periodicity to temporarily recalculate the selected (checked) KPIs or Metrics displayed in the component. When you select the KPIs or Metrics that you had not selected for the on-demand periodicity, their default periodicity is restored and the calculated results are redisplayed.
To restore the original display, do one of the following:
- Slide the button back to the Original position that represents the default periodicity of the KPIs or Metrics displayed in the graph.
- Click the blue line in the breadcrumbs.
- The display is automatically modified.
-
We welcome your comments!
To open the configured email client on this computer, open an email window.
Otherwise, copy the information below to a web mail client, and send this email to SW-Doc@hpe.com.
Help Topic ID:
Product:
Topic Title:
Feedback: