
Searching the Help
To search for information in the Help, type a word or phrase in the Search box. When you enter a group of words, OR is inferred. You can use Boolean operators to refine your search.
Results returned are case insensitive. However, results ranking takes case into account and assigns higher scores to case matches. Therefore, a search for "cats" followed by a search for "Cats" would return the same number of Help topics, but the order in which the topics are listed would be different.
| Search for | Example | Results |
|---|---|---|
| A single word | cat
|
Topics that contain the word "cat". You will also find its grammatical variations, such as "cats". |
|
A phrase. You can specify that the search results contain a specific phrase. |
"cat food" (quotation marks) |
Topics that contain the literal phrase "cat food" and all its grammatical variations. Without the quotation marks, the query is equivalent to specifying an OR operator, which finds topics with one of the individual words instead of the phrase. |
| Search for | Operator | Example |
|---|---|---|
|
Two or more words in the same topic |
|
|
| Either word in a topic |
|
|
| Topics that do not contain a specific word or phrase |
|
|
| Topics that contain one string and do not contain another | ^ (caret) |
cat ^ mouse
|
| A combination of search types | ( ) parentheses |
|


![]()
![]()

- End User - View and Analyze the Business Objectives
- Dashboard
- Change, On-the-fly, the Component Display Format
- Change, On-demand, the Periodicity Used in a Component Display
- Change, On-Demand, the Breakdown Display
- First Level Navigation (FLN) for an Objective, a KPI, or a Metric
- Explorer
- Explorer - Overview
- Explorer - Data Set
- Explorer - Goal Map
- Explorer - Forecast
- Explorer - What If
- Explorer - Annotations
Change, On-Demand, the Breakdown Display
In some Dashboard page components, you (the end-user) can change locally the display of the Breakdown KPI.
- The total number of KPI Breakdowns (STUDIO and on-Demand) is limited to 5000 per dimension.
- If the calculation of a KPI or Metric ends in error, check the engine.log for a number of Breakdowns being larger than the default value. You can update the default value in $HPBA_Home\glassfish\glassfish\domains\BTOA\config\settings\engine-settings.xml to be more or less 5000. 5000 is the recommended breakdown size. Larger numbers may bring performance and stabilization issue.
In the Dashboard page, in the relevant component, you (the end-user) click the relevant component and select the relevant Breakdown to modify the display on-the-fly.

 Studio Breakdowns and Potential Breakdowns
The on-demand Breakdown feature is available in components where you can select the Gauge format ( and
and  ), the Column format (
![]() and
and  ), the Pie format (
 ), or the Bubble format (
![]() ).
).
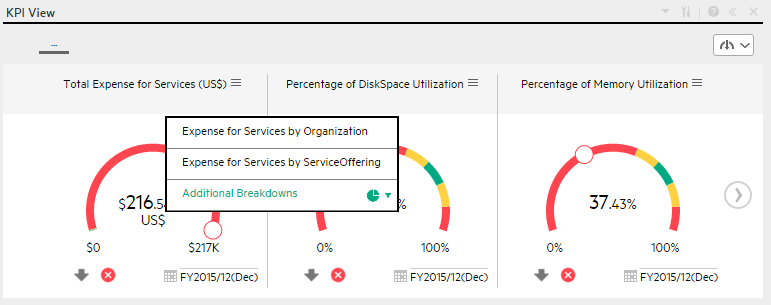
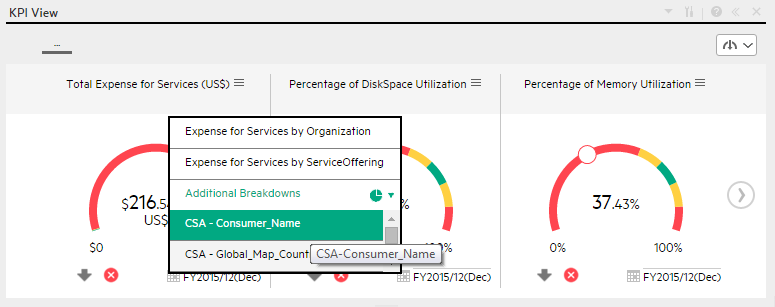
In a Dashboard page component, when the end-user clicks the relevant component, a list of the available KPI Breakdowns is displayed:
Note The color of the KPI Breakdowns or On-Demand Breakdowns depend on the end-user permissions:
- black - the end-user has permission to view the Breakdown and the Breakdown has been calculated.
-
grey:
- the end-user does not have permission to view the Breakdown. For details, see Users and Roles - Dimension Permissions
- the dimension was already used in the Breakdown drilldown.
The end-user can click the Breakdowns listed above the Additional Breakdowns section or the Breakdowns listed below to display the corresponding information. The component display is then automatically modified for the selected Breakdown.
The difference between the Breakdowns above and the Breakdowns in the Additional Breakdown section is as follows:
| Breakdowns listed above Additional Breakdowns |
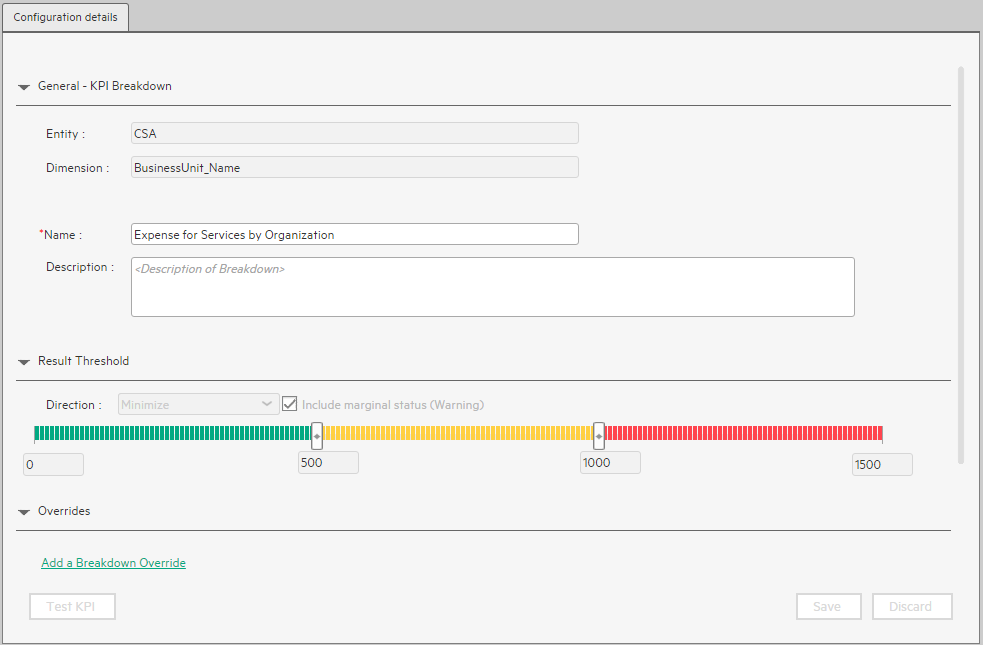
These Breakdowns were configured in the STUDIO. For details, see KPI Breakdowns. Example: The names of the displayed Breakdowns are the names specified in the STUDIO in the Name field in the Configuration details tab.
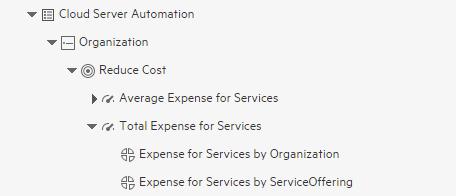
Knowing that the context of the KPI is CSA_Demo, go to the STUDIO, and display the configuration of one for the KPI Breakdowns: Expense for Services by Organization, the Entity is CSA and the Dimension is BusinessUnits_Name.
|
| Breakdowns listed below Additional Breakdowns |
The on-demand Breakdowns are additional potential Breakdowns that were not created in the Studio but were configured with the Breakdown option in the Context Designer. When the end-user selects them in the Dashboard page component, they are calculated and the results are displayed on-demand in the component. Example: In the Context Designer for the CSA_Demo context, in the Entities area, the Service Management entity has other entities, for example Agreement Category. The Agreement Category options are:
|
 to enable to set permissions for the entity.
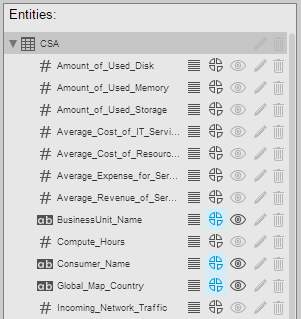

Change, on-demand, the Breakdown KPI displayed in the component
-
As the end-user, in the relevant component in the Dashboard page, select the format that supports the on-demand Breakdown feature.
The on-demand Breakdown feature is available in components where you can select the Gauge format (
and ), the Column format ( and ), the Pie format (), or the Bubble format (
 ).
). -
Click the component. The list of available Breakdowns is displayed.
-
Click the relevant Breakdown listed above the Additional Breakdowns section to display the corresponding information. The component display is automatically modified.
-
Click Additional Breakdowns to display the list of additional potential Breakdowns that were not created in the Studio but that are calculated and displayed on-demand when you select them.
Note After activating the on-demand Breakdown:
- To restore the original display, click the Breadcrumbs grey line when available.
- The calculations are performed on-demand and are temporary. When you leave the page and return to it, the original display is restored.
We welcome your comments!
To open the configured email client on this computer, open an email window.
Otherwise, copy the information below to a web mail client, and send this email to SW-Doc@hpe.com.
Help Topic ID:
Product:
Topic Title:
Feedback: