Dashboard

Once the Administrator has set up the relevant pages in Dashboard, you can view the information contained in the pages and analyze it using the capabilities described below.

Permissions. In the Dashboard components and in their configuration dialog boxes, you can only see the Scorecards, Perspectives, Objectives, KPIs, or KPI Breakdowns for which you have permission. If you do not have permission, you do not see that element. If you do not have permission to see all the elements in a component, the error message Data is not displayed because it does not exist or you do not have the correct viewing permissions. Contact your administrator is displayed.

ClosedTo access:

Click the relevant tabs in the Dashboard

ClosedOut-of-the-box pages

The out-of-the-box pages provide the tools that help the Executive plan, expand and monitor the strategies that help managing the business challenges of that Executive. For details on the business challenges for each role, see Executive Personas and their Business Challenges .

ClosedDecimal precision

ClosedView the relevant objectives in your pages

The administrator has prepared pages for your use. These pages reflect the objectives you set for yourself or your department.

In the Dashboard, click the relevant tab. It includes several components that can enable you to analyze these objectives.

ClosedAnalyze your objectives using the components on your pages

Depending on your permissions, the pages may include specific Scorecard components or not. Each Scorecard component represents the results of the list of selected Perspectives and their Objectives with their value, trend, and status for the measurement period. It represents strategic goals for the organization headed by the executive for whom the page was created.

For details about permissions, see Users and Roles - User Management

In addition, the pages may include other components that provide additional information:

ClosedDrill down to your subordinate's Scorecards

If the administrator has prepared the relevant capability, you can drill down from your Scorecard to your subordinate Scorecard.

If the Scorecard component you are analyzing has drilldowns to subordinate (cascading) Scorecards, a small black arrow is displayed to the right of the Scorecard title.

Click the arrow to display the list of subordinate Scorecards and select the relevant one to display it.

To return to the parent Scorecard, click the X to close the subordinate Scorecard display. Note that you can only access one level down (meaning that if the subordinate Scorecard has subordinates, to access their information, you must create a Scorecard component for the first level of subordinate Scorecard).

For details, see The Scorecard Component.

ClosedDisplay more information about a specific Objective or KPI

From a Scorecard component, move the cursor above the icon at the end of the Objective's name to view over time information about the Objective, details about the Objective's KPIs and the annotations added to the Scorecard by users.

You can also add annotations, send the tooltip by email, PDF it, or print it. For details, see First Level Navigation (FLN) for an Objective, a KPI, or a Metric.

From any other out-of-the-box component, moving the cursor above the 
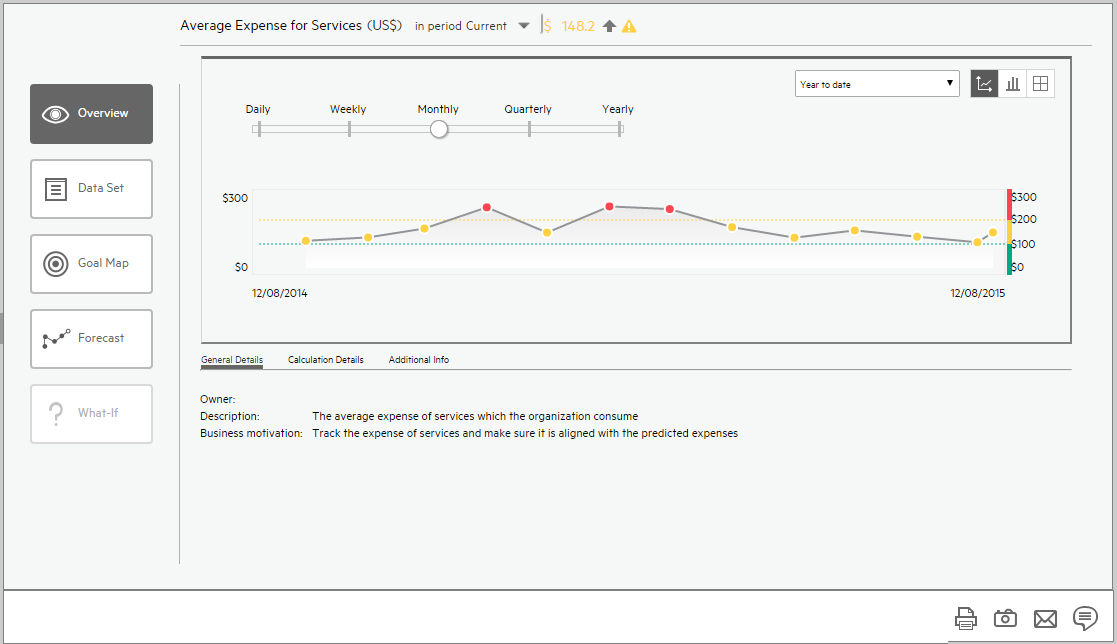
icon at the end of the KPI's name to view over time information about the KPI, its value, trend, and status, and the annotations added to the KPI by other users.

You can also add annotations, send the tooltip by email, PDF it, or print it. For details, see First Level Navigation (FLN) for an Objective, a KPI, or a Metric.

ClosedUse the wiring feature to display more details about a KPI

Component wiring defines how components on the same page interact with each other. When two components are wired, you may select one element on the first component, and immediately, the second component's display changes to view the relevant information for the selected element.

Example You select one KPI in the KPI View component that is wired to the Historical View and the details of the same KPI are immediately displayed in the Historical View component, on the same page, using the format of the Historical View component.

For details, see Wiring Between Components

ClosedDrill down to more details about the Objectives, KPIs, or KPI Breakdowns in the EXPLORER tab

From an Objective or KPI tooltip, click More Info to open the EXPLORER tab filtered for the Objective, KPI, or KPI Breakdown. The EXPLORER tab provides over time information, details about the Objective or KPI's configuration, the complete list of annotations, the location of the Objective or KPI in the active tree, and a Goal map for the element. For details, see About Explorer.

ClosedView details about the Scorecards, Perspectives,Objectives, KPIs, KPI Breakdowns, Metrics, Metric Breakdowns,or Unassigned KPIs in the EXPLORER tab

Depending on the selected type of entity (Scorecard, Perspective, Objective, KPI, KPI Breakdown, Metric, Metric Breakdown, or Unassigned KPI), the EXPLORER tab provides over time information, configuration details, the complete list of annotations, the capability to add or edit annotations, the location of the selected item in the active tree, and a Goal map for the item. For details, see About Explorer.

ClosedUnderstand the meaning of an Objective or KPI

The Objectives that are displayed in the pages and components represent the overall performance goal that you want to track. For details, see Objectives.

The Objectives include groups of KPIs of different types that can represent different aspects of the goal. For details, see Activate Scorecards, Perspectives, Objectives, Metrics, or KPIs Using Templates.

Example If you want to measure the IT department responsiveness, you create an Objective that measures different aspects of the IT department related to responsiveness. Each aspect is measured by a different KPI types (for example: project initiation time, PC purchase time, and more). These KPIs provide values, trends, and statuses that help you track your goals.

ClosedDrilldown to KPI Breakdown information

A KPI represents a business context. The value of the KPI is calculated based on the entities (facts or dimensions) that provide information on the business context. A business context can include lots of facts or dimensions.

The administrator creates multiple levels of KPI Breakdowns depending on the definition of the KPI and on the KPI's business context. These definitions provide the different levels of Breakdown that enable you to obtain very detailed information about the business aspect that you are measuring.

For details, see KPI Breakdowns.

ClosedAccess the Explorer to display detailed information about a selected KPI or Objective

You can view more detailed information for a selected KPI or Objective by moving the cursor over the relevant item in the page, component, or Scorecard component, in the Dashboard. In the tooltip that opens, click Analyze. The EXPLORER tab opens for the selected item.

You can also click the Explorer tab to display the Active KPIs tree, and by clicking the Objectives and KPIs in the tree, display detailed information about the selected item in the EXPLORER tab.

The information includes the items description, value or score, value over time, annotations sent by other users, links to relevant pages, external URLs, reports, and more.

For additional details, see About Explorer.

ClosedAdd annotations to a specific Objective or KPI

  1. In Explorer page, click the relevant Objective or KPI in the Active KPIs tree.
  2. Examine the information displayed in the Explorer Overview, Data Set, and Goal Map tabs.
  3. If you have comments, click the Show annotations button at the bottom of the Annotations area.
  4. In the box that opens, enter your annotation, and click Add to add the annotation to the list of annotations in the Annotations area.


  5. The annotation is added to the list.


For additional details, see About Explorer.

ClosedPrint, email, or PDF the relevant annotation

You can email the owner of the Objective or KPI you are analyzing.

You can also save a snapshot of the information displayed in the Overview tab (chart, annotations, and additional information for the KPI or Objective), in PDF format, or you can print that snapshot.

For additional details, see About Explorer

ClosedView a Scorecard, Objective, Perspective, KPI, KPI Breakdown, Metric, Metric Breakdown, or Unassigned KPI Details

  1. In Explorer, click the relevant Scorecard, Objective, Perspective, KPI, KPI Breakdown, Metric, Metric Breakdown, or Unassigned KPI in the Active KPIs tree.
  2. Click the Overview button.

    The Overview area in Explorer displays information about the selected Scorecard, Objective, Perspective, KPI, KPI Breakdown, Metric, Metric Breakdown, or Unassigned KPI, over time information beginning from the current period. You can also display past information by selecting a past period of time. The area displays different information depending on the type of item you selected.

    For details, see Explorer - Overview.

ClosedAnalyze the raw data for a KPI or Metrics

  1. In Explorer, click the relevant KPI or Metric in the Active KPIs tree.
  2. Click the Data Set button. It provides the ability to drill down into the details of the formula used to calculate the KPI or Metric, to see the building blocks of the calculation results, and to analyze the data used for the calculation. The page provides the formula, the filter, and the display of the data. For details, see Explorer - Data Set.

ClosedUnderstand the impact of one KPI on Objectives, Perspectives, and Scorecards

  1. In Explorer, click the relevant KPI in the Active KPIs tree.
  2. Click the Goal Map button. Examine the information displayed in the Goal Map tab. The Goal Map provides a tree of nodes that represents the display of the impact of the selected KPI on the relevant Objectives, Perspectives, and Scorecards, or of the selected Objective on the relevant Perspectives, and Scorecards. The Goal Map displays the impact configuration only for the current period of the selected KPI or Objective. The information displayed on the Goal Map depends on the user permission. You can double-click on a node (KPI or Objective) to select the KPI or Objective in the Active Tree and to display the Overview tab for the selected node and the current period. For details, see Explorer - Goal Map.

ClosedAnalyze the Forecast for the KPI

  1. In Explorer, click the relevant KPI in the Active KPIs tree.
  2. Click the Forecast button.

    IT Business Analytics provides information regarding the status and values of Objectives, KPIs, or Metrics on the past and current periods in the Dashboard and Explorer tabs. The Forecast tab in Explorer provides a glimpse into the future by forecasting the entity future behavior, based on historical data, so you will be able more easily understand the underlying trend and to do all you can now to improve or maintain the desired behavior.

    You can view the forecast of the upcoming future of the selected Objectives, KPIs, or Metrics (for which you have permission), in a period of up to 1 year from the current period.

    For details, see Explorer - Forecast.