


Shared memory sizing
Because the storage area of shared memory is not directly related to the number of users in the system, the per-user shared memory requirement can only be estimated. A user requires 512 bytes of storage for their user block, plus small amounts of storage for various overhead tasks. The user’s total shared memory depends on the number of modules used, and the number of forms, dbdict records, links, format controls, and code records they access. The estimated amount of shared memory per user will be higher for a smaller user base, because the cached information in the system is usually relatively static and does not depend on the number of users in the system.
A sample calculation for shared memory is:
48 MB + 1MB per 10 users + Shared Memory for IR (see below).
Note Shared memory in a horizontally scaled environment must be calculated per machine based on how many users this machine handles during peak times.
If the Service Manager Information Retrieval (IR) process is used, the IR Cache section of shared memory should accommodate the size of all IR files that are used.
The default size allocated for IR is 30% of the total shared memory. If this amount does not match the recommended size of shared memory for IR, use the ir_max_shared:<size_in_bytes> parameter to set aside additional shared memory for the IR process.
Shared Memory Adjustments
These suggestions offer a good baseline for most customer systems. However, it may still be necessary to periodically adjust the amount of shared memory. The amount of free storage should be monitored regularly using the Service Manager Shared Memory Report, sm –reportshm.
HPE recommends never letting the amount of free space fall below 25%. If continuous monitoring of the shared memory report indicates that free space is constantly above 75%, the shared_memory parameter in the sm.ini file can be set to a lower number to ensure memory is being used efficiently.
Note Adjustments to the shared_memory parameter must not be made when the Service Manager server is running.
Cache Sizing
Cache is stored in slots. By default Service Manager uses 2003 cache slots. The cache report (sm -reportcache) shows the cache slots used and average and maximum depths.
C:\scs\sm7\server\RUN>sm -reportcache
---------------------- Cache Statistics      ----------------------


Slot use: 42%; Average Slot Depth: 1; Maximum Slot Depth: 13
The average slot depth should be below 3 and the maximum should be below 10. If the average slot depth is too deep, increase the cache_slots parameter to a larger prime number, such as 11001. Prime numbers are most efficient for cache_slots. This is due to the fact that we calculate a hash for each item in the cache resulting in numbers between 0 and 2 32 -1 (32-bit integer). These hash numbers have to be distributed – if possible evenly – between the available cache slots. This is done with a modulus function against the cache_slots. Using a prime number has a higher probability of distributing the cache items evenly amongst the cache slots.
Unused items are removed from cache by the sync process. During the cache_clean_interval, the sync process enters a timestamp into all cache items that have a use count of 0. During the next cache_clean_interval, if it still shows the timestamp the item will be removed from cache. If the cache item was used after the first interval, the use count overwrites the timestamp indicating the item has been recently used. Thus cache items that were unused for cache_clean_interval (seconds) * 2 will be removed from the cache.
Shared Memory Reports
You can monitor the allocation and growth of shared memory by using the Service Manager Shared Memory Report, sm –reportshm. The following figure is an example of a shared memory report. The report contains a list of all the items currently stored in shared memory in addition to the amount of storage each item is using.
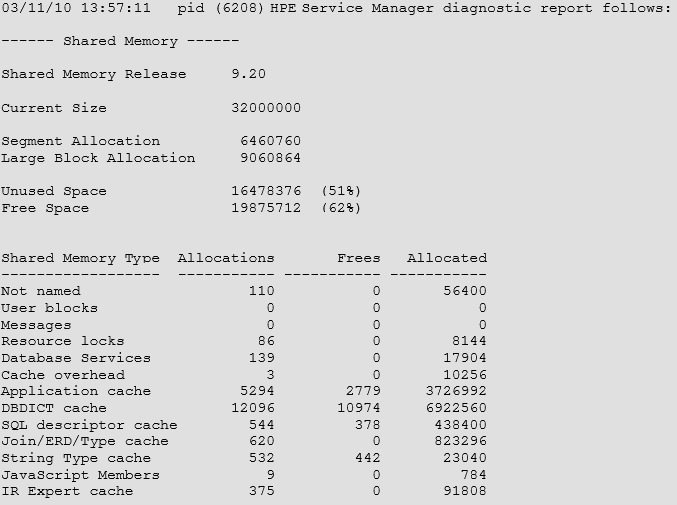
Current Size is the amount of shared memory allocated in bytes as defined by the shared_memory parameter in the sm.ini file.
Free Space is the amount of shared memory that is available for use by processes. Free Space is gained when previously used Shared Memory areas are made available again. Also, Free Space is the sum of "Unused Space" (memory never before allocated) and "Freed Space" (memory in the free list chain that was previously allocated) Free Space is shown as total bytes and as an overall percentage.
Unused Space represents available shared memory that has not yet been allocated. When Service Manager starts, the entire amount of memory defined by the shared_memory parameter is allocated, and blocks may then be allocated from within that shared memory as needed. Unused Space is shown in total bytes and as an overall percentage.
Using sm -reportshm:1 to generate the Service Manager Shared Memory Report will produce a more detailed listing of shared memory allocation.
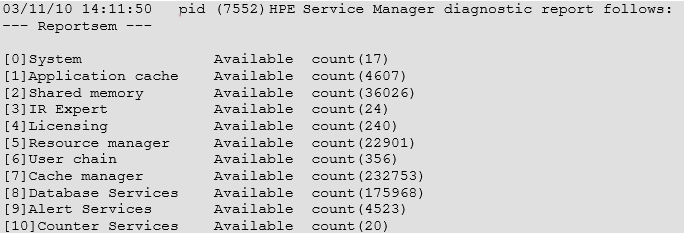
Service Manager Semaphore Report
Shared Memory Areas
Not named = User Blocks (area moved)
Every user process allocates a user block of 512 bytes. This block of shared memory contains user specific information like userid, device, license (specific to the user, such as floating or named license, when last logged in etc.), and system monitor information.
Messages
Every message that is sent from one user to another is put into the message block section of shared memory. The amount of shared memory allocated per message depends on the size of the message.
Resource Locks
Resource locks are created whenever the lock application is executed from RAD. For example when a user edits an incident ticket, a resource lock is created for that ticket. If the ‘show locks’ option from the system status is selected and you have a vertically-scaled environment, the information on existing locks is taken from shared memory for all versions of Service Manager. However, in horizontally-scaled environments, the information is taken from JVM private memory of each node for versions of Service Manager earlier SM 9.31, or from the database for SM 9.31 and later versions.
Database Services
Tuning statistics regarding executed queries and database access are stored in this area. Statistics indicating possible performance issues are written to the sc.alert.log.
Cache Overhead
Contains operators and other system information; It also contains overhead or miscellaneous items that need to be stored for multi-process access
Application Cache
This area in shared memory holds code records, pre-parsed and split up by panel.
DBDict Cache
This area contains cached Table Definitions (dbdict records) as well as other cached data records such as: format, link, format control, category, scmessage.
SQL Descriptor Cache
This area in shared memory is used by the RDBMS mapping engine and contains the mapping information between the dbdict and the RDBMS table definitions.
JOIN/ERD/TYPE Cache
This area contains records from joindef, erddef, scaccess, scmandant and sctypecheck
String Type Cache
This contains the fastcounters data structure, files and fields using counters, cascade delete definitions, cached charts, list of defined triggers, JavaScript triggers that for ease of Shared Memory storage are wrapped into a STRING.
JavaScript Members
This area contains information used by or required for JavaScript applications. It does not contain JavaScript code, but rather information on the current version of the Script member.
IR Expert Cache
This area in shared memory holds the term and document lists used by Service Manager’s IR expert process.
IR Expert and Shared Memory
IR Expert makes extensive use of shared memory and usually represents the largest allocation type. The default amount of shared memory used by IR is 30% of the total size allocated for shared memory. This percentage can be adjusted by changing the amount of bytes used for IR in Shared Memory using the ir_max_shared parameter in the sm.ini file. The optimum size of the cache is the same as the size of all ir.* files added together.
In general, IR keeps track of all documents that contain search words. The document list for a word is loaded into shared memory as it is referenced. Subsequent searches on the same word will be much faster because the first process that ran the search has already loaded the document into shared memory.
If the IR shared memory area is full, Service Manager will remove the least recently used data structure (such as a term, doc, doc list, term list, adaptive learning) from shared memory to make room for new IR information.
Increasing the overall size of shared memory will only have a performance impact on the IR Expert portion. It will NOT help with general system performance.