
Searching the Help
To search for information in the Help, type a word or phrase in the Search box. When you enter a group of words, OR is inferred. You can use Boolean operators to refine your search.
Results returned are case insensitive. However, results ranking takes case into account and assigns higher scores to case matches. Therefore, a search for "cats" followed by a search for "Cats" would return the same number of Help topics, but the order in which the topics are listed would be different.
| Search for | Example | Results |
|---|---|---|
| A single word | cat
|
Topics that contain the word "cat". You will also find its grammatical variations, such as "cats". |
|
A phrase. You can specify that the search results contain a specific phrase. |
"cat food" (quotation marks) |
Topics that contain the literal phrase "cat food" and all its grammatical variations. Without the quotation marks, the query is equivalent to specifying an OR operator, which finds topics with one of the individual words instead of the phrase. |
| Search for | Operator | Example |
|---|---|---|
|
Two or more words in the same topic |
|
|
| Either word in a topic |
|
|
| Topics that do not contain a specific word or phrase |
|
|
| Topics that contain one string and do not contain another | ^ (caret) |
cat ^ mouse
|
| A combination of search types | ( ) parentheses |
|


![]()
![]()

SA_Demo and SA CAPs
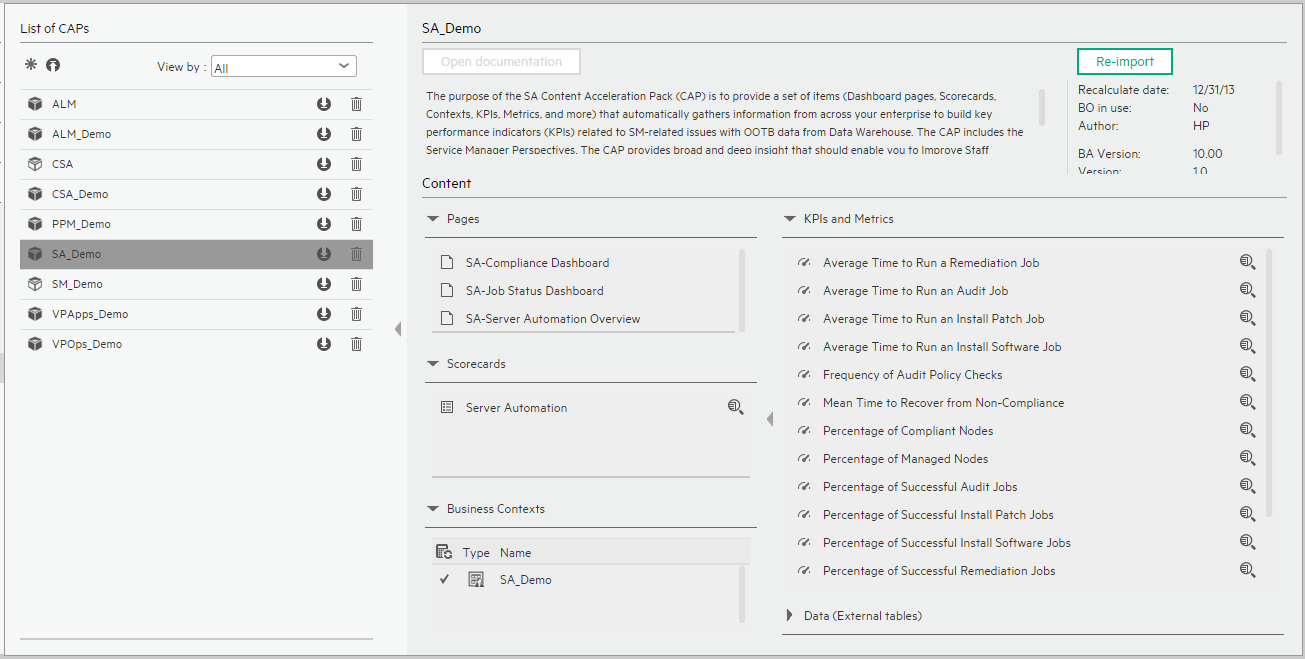
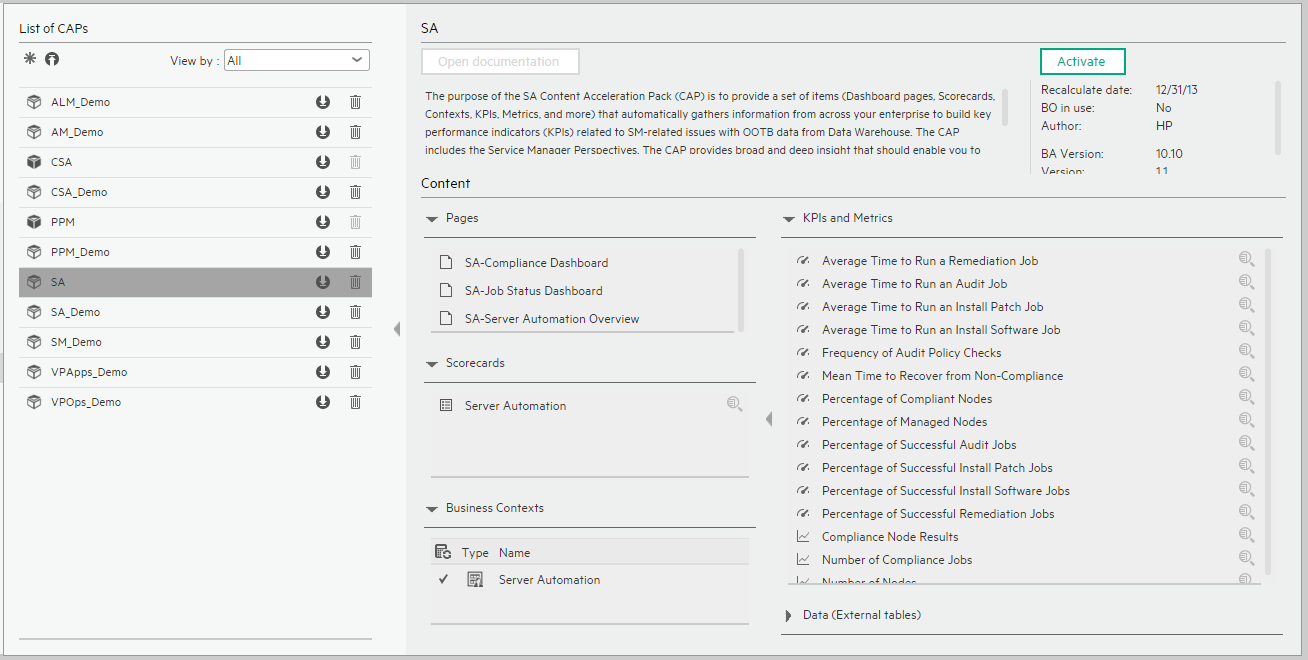
The purpose of the SA Content Acceleration Pack (CAP) is to provide a set of items (Dashboard pages, Scorecards, Contexts, KPIs, Metrics, and more) that automatically gathers information from across your enterprise to build key performance indicators (KPIs) related to SM-related issues with OOTB data from Data Warehouse. The CAP includes the Server Automation Perspectives. The CAP provides a 360 degree Server Automation view.
The SA CAP includes data from the Server Automation data source.
The relevant content pack is SA. For details, see Integration with SA.
 User Story
-
Scott is the IT Security and Compliance Analyst of ABC Inc. IT Security organization.
-
One of his responsibilities is to ensure that all the managed nodes are compliant.
-
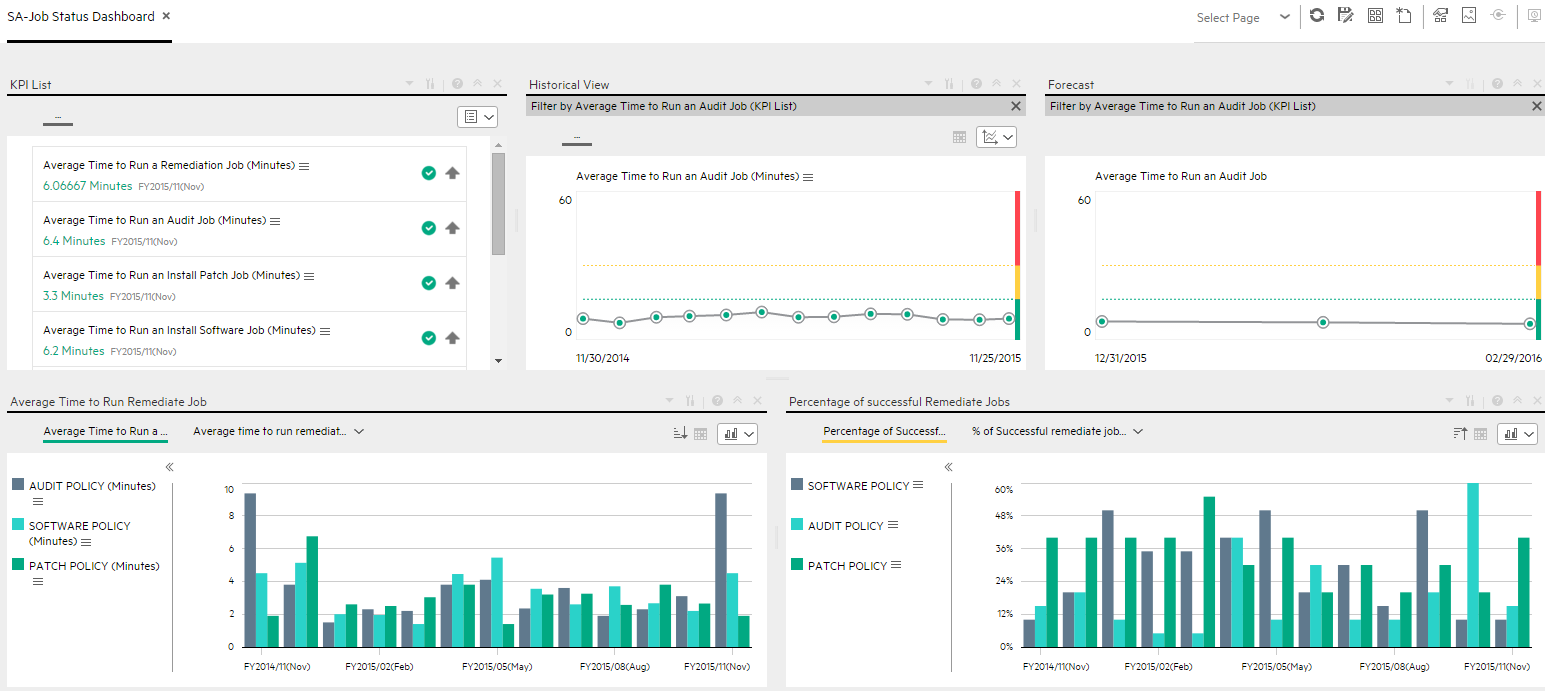
Scott logs on the ITBA application and opens the Job Status page in the Dashboard to make sure that all server automation jobs have completed successfully in the last period. He sees that the status of all job-related KPIs is green.
-
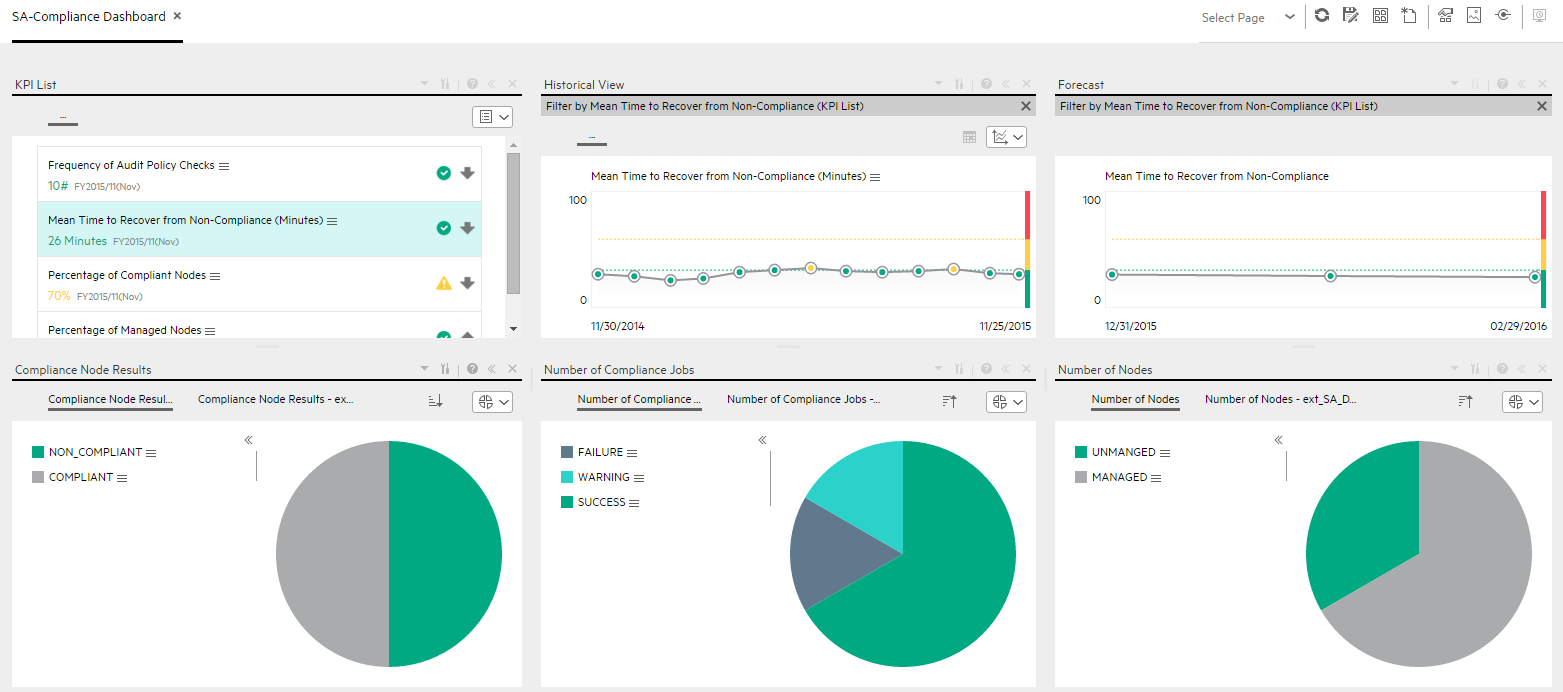
Scott then switches to the Compliance Dashboard and looks at the Percentage of Successful Install Patch Jobs KPI to see if it meets the target. He finds out that the latest KPI value is orange.
-
The Historical View shows the poor weekly performance of the KPI for the past few days. In addition, based on the current results, the Forecast is a continuous decline for the next week and in the future.
-
Drilling into the details, Scott then looks at the Compliance Node Results Pie Chart, and understands how many servers are not compliant. He also notices that there are still a couple of nodes that are not compliant causing the red status of the KPI.
-
He then clicks on Non-compliant in the legend to open the KPI EXPLORER to see the data set that lists all the servers that are not compliant.
-
Scott decides to setup a meeting with Chris who is the Compliance Manager of the IT organization responsible for enforcing the IT compliance policy. They come up with a plan to return the node compliance status back to normal for all managed nodes.
SA_Demo and SA
User interface elements are described below (when relevant, unlabeled elements are shown in angle brackets):
|
UI Element |
Description |
|---|---|
| Pages | |
| Scorecards |
|
| Business Contexts |
For details, see Semantic Layer - Contexts and Universes. |
| KPIs and Metrics |
Note The Demo CAP includes KPIs with names followed by (Demo). The CAP includes the same KPIs with names that do not include (Demo). The KPIs are the same but have different names so that both the Demo CAP and the CAP can be activated at the same time.
Metrics
|
| Data (External Tables) |
SA_Demo |
SA-Compliance Dashboard Page
SA-JOB Status Dashboard Page
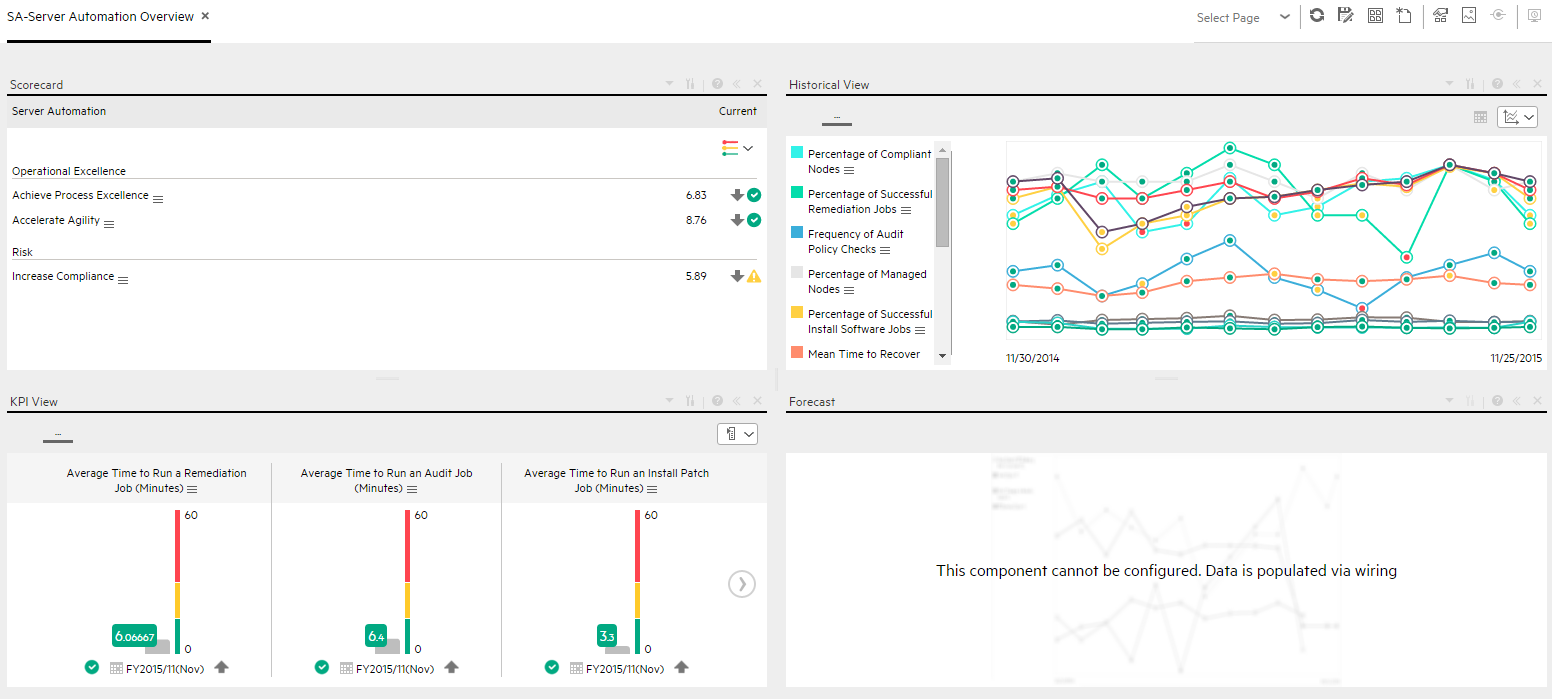
SA-Server Automation Overview Page
We welcome your comments!
To open the configured email client on this computer, open an email window.
Otherwise, copy the information below to a web mail client, and send this email to SW-Doc@hpe.com.
Help Topic ID:
Product:
Topic Title:
Feedback: