
Searching the Help
To search for information in the Help, type a word or phrase in the Search box. When you enter a group of words, OR is inferred. You can use Boolean operators to refine your search.
Results returned are case insensitive. However, results ranking takes case into account and assigns higher scores to case matches. Therefore, a search for "cats" followed by a search for "Cats" would return the same number of Help topics, but the order in which the topics are listed would be different.
| Search for | Example | Results |
|---|---|---|
| A single word | cat
|
Topics that contain the word "cat". You will also find its grammatical variations, such as "cats". |
|
A phrase. You can specify that the search results contain a specific phrase. |
"cat food" (quotation marks) |
Topics that contain the literal phrase "cat food" and all its grammatical variations. Without the quotation marks, the query is equivalent to specifying an OR operator, which finds topics with one of the individual words instead of the phrase. |
| Search for | Operator | Example |
|---|---|---|
|
Two or more words in the same topic |
|
|
| Either word in a topic |
|
|
| Topics that do not contain a specific word or phrase |
|
|
| Topics that contain one string and do not contain another | ^ (caret) |
cat ^ mouse
|
| A combination of search types | ( ) parentheses |
|


![]()
![]()

CMS_Demo and CMS CAPs
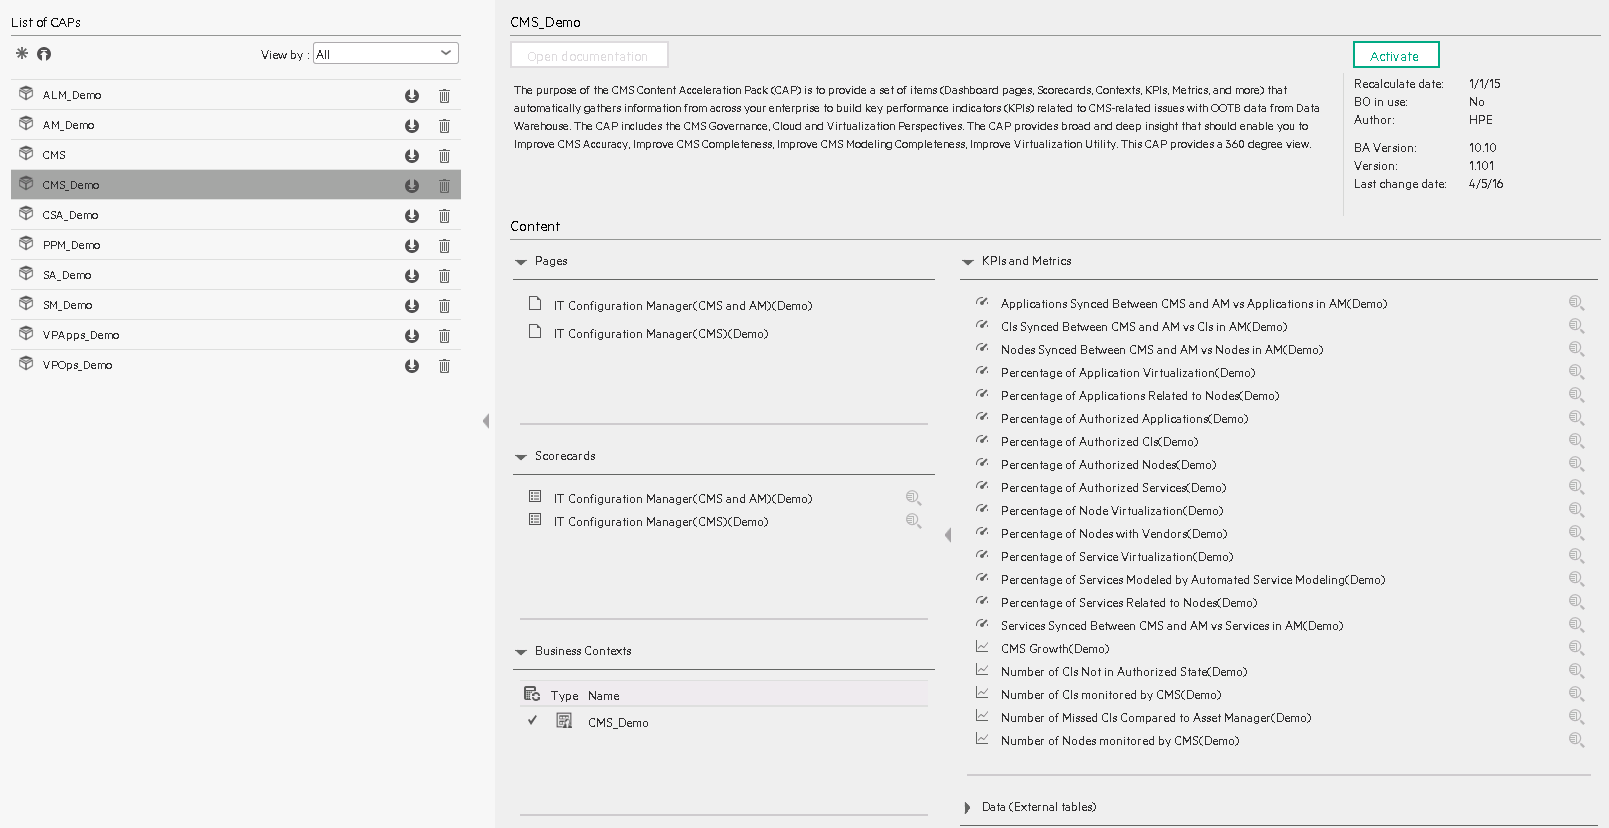
The purpose of the CMS Content Acceleration Pack (CAP) is to provide a set of items (Dashboard pages, Scorecards, Contexts, KPIs, Metrics, and more) that automatically gathers information from across your enterprise to build key performance indicators (KPIs) related to CMS-related issues with OOTB data from Data Warehouse. The CAP includes the CMS Governance, Cloud and Virtualization Perspectives. The CAP provides broad and deep insight that should enable you to Improve CMS Accuracy, Improve CMS Completeness, Improve CMS Modeling Completeness, Improve Virtualization Utility. This CAP provides a 360 degree view.
The CMS_Demo is based on data in .csv files that are part of the CAP package and CMS CAPs include data from the CMS data source.
The relevant content pack is CMS. For details, see Integration with CMS.
 User Story
-
Maggie is the IT Configuration Manager at ABC Inc. She manages the configuration management system in the IT organization.
One of her responsibilities is to ensure that all assets are accurately defined and identified in the configuration management system in support of business needs.
- She logs into the ITBA application and opens the IT Configuration Management (CMS) page in Dashboard.
- She first looks at the Improve CMS Completeness Objective.
- Then she clicks the Objective and finds that the CIs Synced Between CMS and AM vs CIs in AM KPI is red.
- In the Historical View in the same Dashboard page, she finds that the KPI value decreased considerably during the past week.
- To understand why the KPI is red, Maggie clicks on the KPI to open EXPLORER, where the pie clearly shows there are still lots of missing CIs when compared to the CIs in the Asset Manager.
- Maggie sends an annotation to Richard, the Discovery Administrator requesting clarifications: "Richard – We have poor CMS Completeness, please provide insight and set a plan by EOW".
- Richard is responsible for collecting, discovering, and maintaining the configuration information for hardware assets in the configuration management system. After he receives the annotation from Maggie, he checks his report and starts the analysis of the problem.
- Richard then replies to Maggie that he will initiate a meeting with the Discovery Team to discuss the issue.
- Then Maggie looks at the Improve CMS Accuracy Objective.
- She clicks the Objective and finds that the Percentage of Authorized CIsKPI is red
- To understand why the KPI is red, Maggie performs a Breakdown on this KPI by CI Type. She finds out that Network Component only hits 20% of authorized CIs and is the cause of the red ratio of the KPI.
- She clicks on the Network Component in the legend to open the KPI EXPLORER, where the data shows details for which Network Component CIs are not authorized.
-
Maggie sends an annotation to John, the Configuration Team Leader: "John – We have poor CMS accuracy on Network Component CIs. Please provide insight and set a plan by EOW".
The Configuration Team and John are responsible for authorizing the configuration item in the configuration management system.
- When John gets the annotation from Maggie, he checks his report and starts the analysis of the problem.
- John then replies to Maggie that he will work with the team to address the issue by EOW.
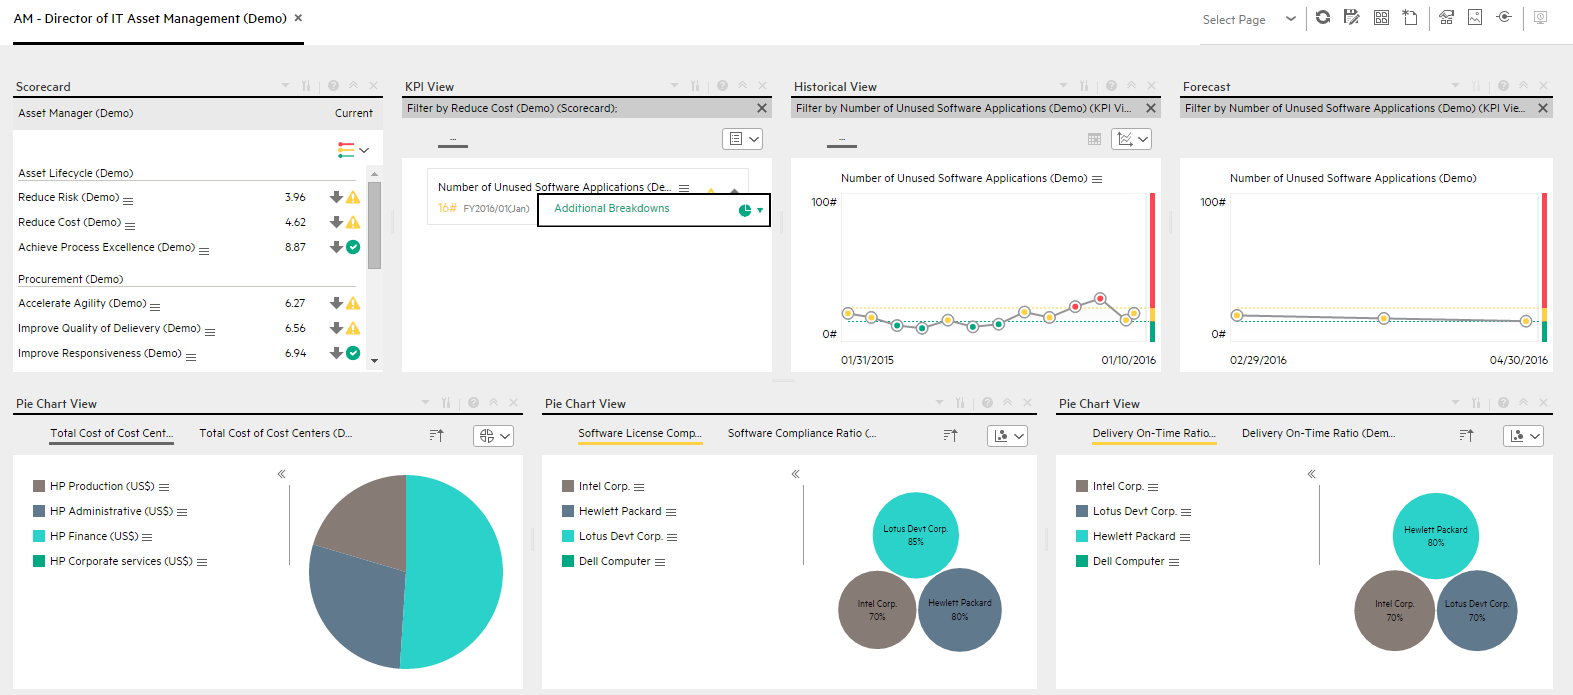
- Then, Maggie updates the server virtualization results to her manager Steve, who is the director of the IT Organization, to help moving their traditional IT to the new style of IT in order to optimize the running of their IT organization.
- She looks at the Improve Virtualization Utility Objective.
- She clicks the Objective and finds that the Percentage of Server Virtualization KPI is red
- To understand why the KPI is red, Maggie looks at the Server by Virtualization pie chart. She sees that only 30% of servers are running on the cloud and virtualization technology.
- Maggie sends an annotation to Steve: "Steve – We have poor performance on server virtualization, I will setup a meeting with the IT infrastructure team to push them move more servers on the cloud".
CMS_Demo and CMS
User interface elements are described below (when relevant, unlabeled elements are shown in angle brackets):
|
UI Element |
Description |
|---|---|
| Pages |
IT Configuration Manager (CMS and AM)(Demo) Page IT Configuration Manager (CMS and AM) Page |
| Scorecards |
|
| Business Contexts |
CMS_ConfigurationManagementSystem For details, see Semantic Layer - Contexts and Universes. |
| KPIs and Metrics |
Note The Demo CAP includes KPIs with names followed by (Demo). The CAP includes the same KPIs with names that do not include (Demo). The KPIs are the same but have different names so that both the Demo CAP and the CAP can be activated at the same time. Applications Synced Between CMS and AM vs Applications in AM KPI. The number of Business Applications synchronized between CMS and AM compared to the number of Business Applications in AM. CIs Synced Between CMS and AM vs CIs in AM KPI. The number of CIs synchronized between CMS and AM compared to the number of CIs AM (for CIs of type Node, Business Service, Infrastructure Service, or Business Application). Nodes Synced Between CMS and AM vs Nodes in AM KPI. The number of Nodes synchronized between CMS and AM compared to the number of Nodes in AM. Percentage of Application Virtualization KPI. The number of Business Applications provided by the relative Server components running on cloud virtualization technology relative to the total number of Business Applications (KPI.s show data only if you are using CMS 10.22 and above). Percentage of Applications Related to Nodes KPI. The number of Business Applications that have at least 1 direct or indirect relationship with a Node relative to the number of Business Applications. Percentage of Authorized Applications KPI. The number of authorized Business Applications relative to the total number of Business Applications (KPI.s show data only if you are using UCMDB Configuration Manager). Percentage of Authorized CIs KPI. The number of authorized CIs relative to the total number of CIs (KPI.s show data only if you are using UCMDB Configuration Manager). Percentage of Authorized Nodes KPI. The number of authorized Nodes relative to the total number of Nodes (KPI.s show data only if you are using UCMDB Configuration Manager). Percentage of Authorized Services KPI. The number of authorized Services relative to the total number of Services (Service in Business Service or Infrastructure Service) (KPI.s show data only if you are using UCMDB Configuration Manager). Percentage of Node Virtualization KPI. The number of Nodes that are running on cloud virtualization technology relative to the total number of Nodes (KPI.s show data only if you are using CMS 10.22 and above). Percentage of Nodes with Vendors KPI. The number of Nodes that contain vendor information relative to the total number of Nodes. Percentage of Service Virtualization KPI. The number of Services provided by the relative Server components running on cloud virtualization technology relative to the total number of Services (Service in Business Service or Infrastructure Service) (KPI.s show data only if you are using CMS 10.22 and above). Percentage of Services Modeled by Automated Service Modeling KPI. The number of Services that are modeled by automated service modeling relative to the number of Services that are created during the measurement period (Service in Business Service and Infrastructure Service) (KPI.s show data only if you are using CMS 10.2 and above). Percentage of Services Related to Nodes KPI. The number of services that have at least 1 direct or indirect relationship with a Node relative to the number of services (Service in Business Service or Infrastructure Service). Services Synced Between CMS and AM vs Services in AM KPI. The number of Services synchronized between CMS and AM compared to the number of Services in AM (Service in Business Service or Infrastructure Service). CMS Growth Metric. The number of CIs created in the last period relative to the number of CIs created in the previous period. Number of CIs Monitored by CMS Metric. The total number of CIs monitored by CMS. Number of CIs Not in Authorized State Metric. The total number of CIs that are not in authorized state. Number of Missed CIs Compared to Asset Manager Metric. The number of CIs in Asset Manager that do not have a relevant CI record in CMS (for CIs of type Node, Business Service, Infrastructure Service, or Business Application). Number of Nodes Monitored by CMS Metric. The total number of Nodes Monitored by CMS. |
| Data (External Tables) |
CMS_demo |
IT Configuration Manager (CMS and AM)(Demo) Page
IT Configuration Manager (CMS and AM) Page
IT Configuration Manager (CMS)(Demo) Page
IT Configuration Manager (CMS) Page
We welcome your comments!
To open the configured email client on this computer, open an email window.
Otherwise, copy the information below to a web mail client, and send this email to SW-Doc@hpe.com.
Help Topic ID:
Product:
Topic Title:
Feedback: