
Searching the Help
To search for information in the Help, type a word or phrase in the Search box. When you enter a group of words, OR is inferred. You can use Boolean operators to refine your search.
Results returned are case insensitive. However, results ranking takes case into account and assigns higher scores to case matches. Therefore, a search for "cats" followed by a search for "Cats" would return the same number of Help topics, but the order in which the topics are listed would be different.
| Search for | Example | Results |
|---|---|---|
| A single word | cat
|
Topics that contain the word "cat". You will also find its grammatical variations, such as "cats". |
|
A phrase. You can specify that the search results contain a specific phrase. |
"cat food" (quotation marks) |
Topics that contain the literal phrase "cat food" and all its grammatical variations. Without the quotation marks, the query is equivalent to specifying an OR operator, which finds topics with one of the individual words instead of the phrase. |
| Search for | Operator | Example |
|---|---|---|
|
Two or more words in the same topic |
|
|
| Either word in a topic |
|
|
| Topics that do not contain a specific word or phrase |
|
|
| Topics that contain one string and do not contain another | ^ (caret) |
cat ^ mouse
|
| A combination of search types | ( ) parentheses |
|


![]()
![]()

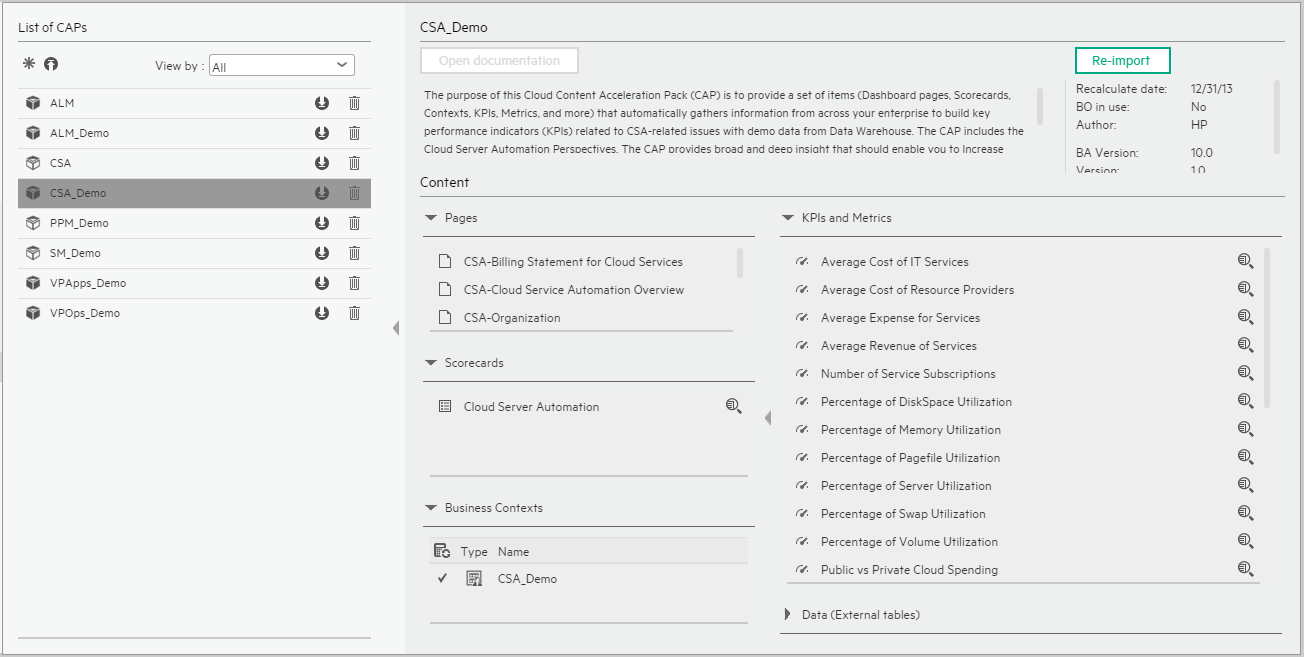
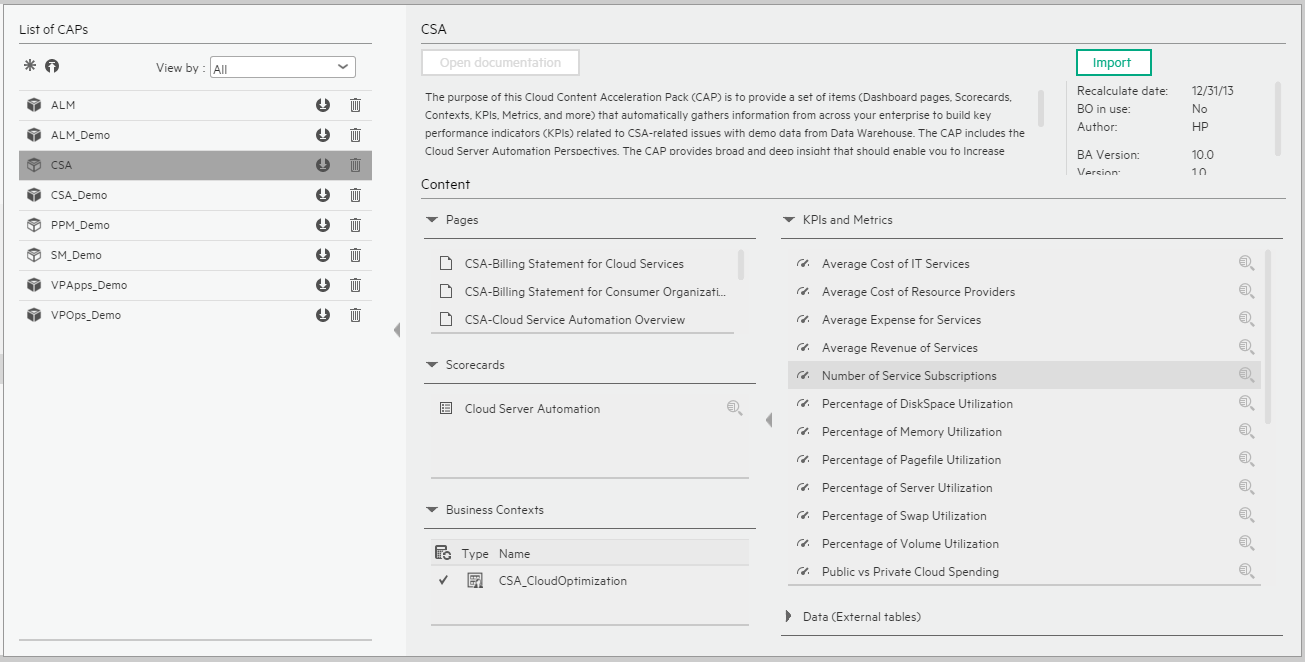
CSA_Demo and CSA CAPs
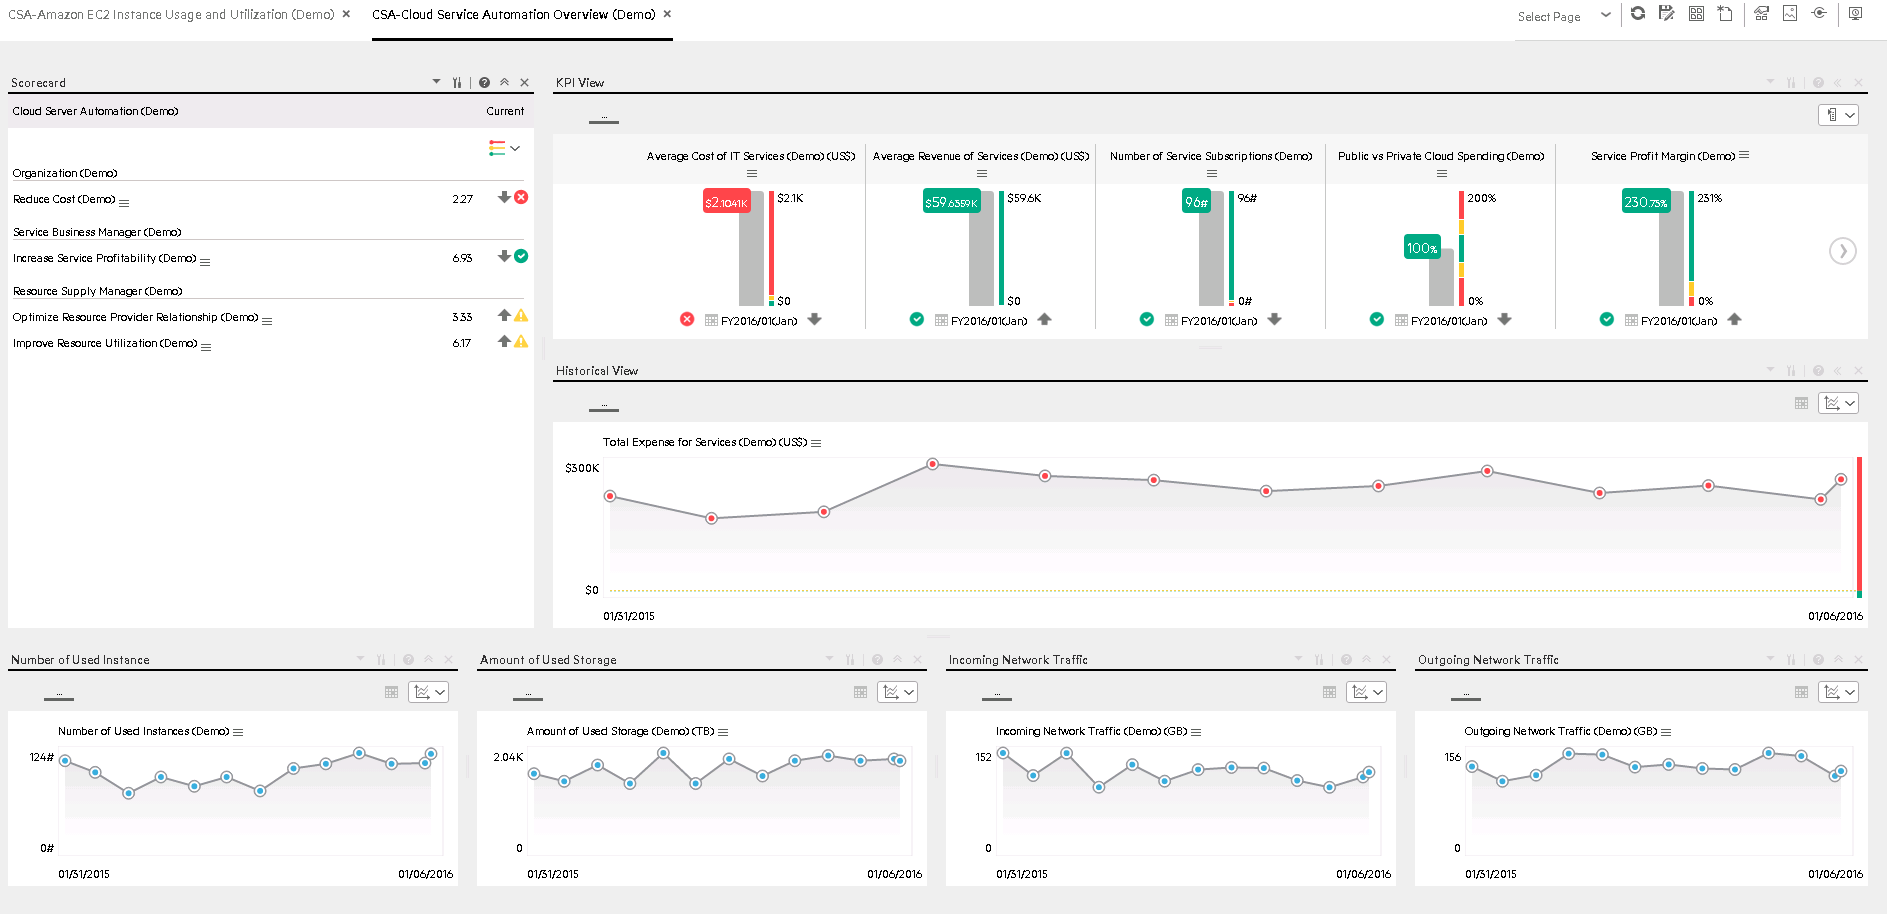
The purpose of the CSA_Demo and CSA Content Acceleration Packs (CAPs) is to provide a set of items (Scorecards, Contexts, KPIs, Metrics, and more) that automatically gathers information from across your enterprise to build key performance indicators (KPIs) related to CSA-related issues with OOTB data from Data Warehouse as well as Dashboard pages that display the relevant information. The CAPs include the Cloud Server Automation Perspectives. The CAPs provide broad and deep insight that should enable you to Increase Service Profitability, Optimize Resource Provider Relationship, Improve Resource Utilization. This CAP provides a 360 degree Cloud Service Automation view.
The CSA is based on the Cloud Service Automation and Amazon Web Services
The CSA_Demo is based on data in .csv files that are part of the CAP package and CSA CAPs include data from data sources.
The relevant content packs are CSA, AWS
 Reports
-
To view data in the CSA-related reports, make sure you have installed BOE.
-
The cloud-related reports (Dashboard pages) provided in the CSA_CAP and CSA_Demo_CAP CAPs combine integrated data from the following data sources Cloud Service Automation (CSA), and Amazon Web Services (AWS),
CSA_Demo and CSA
User interface elements are described below (when relevant, unlabeled elements are shown in angle brackets):
|
UI Element |
Description |
||||
|---|---|---|---|---|---|
| Pages |
|
||||
| Scorecards |
|
||||
| Business Contexts |
For details, see Semantic Layer - Contexts and Universes. |
||||
| KPIs and Metrics |
Note The Demo CAP includes KPIs with names followed by (Demo). The CAP includes the same KPIs with names that do not include (Demo). The KPIs are the same but have different names so that both the Demo CAP and the CAP can be activated at the same time. KPIs
Metrics:
|
||||
| Data (External Tables) |
|
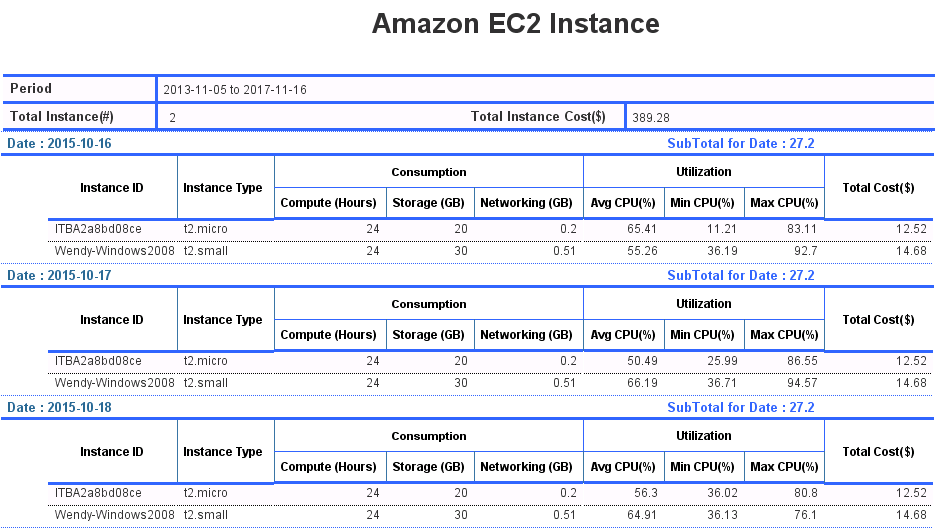
CSA - Amazon EC2 Instance Usage and Utilization Page
The data sources are AWS
Limitation: The report can only display USD as currency.
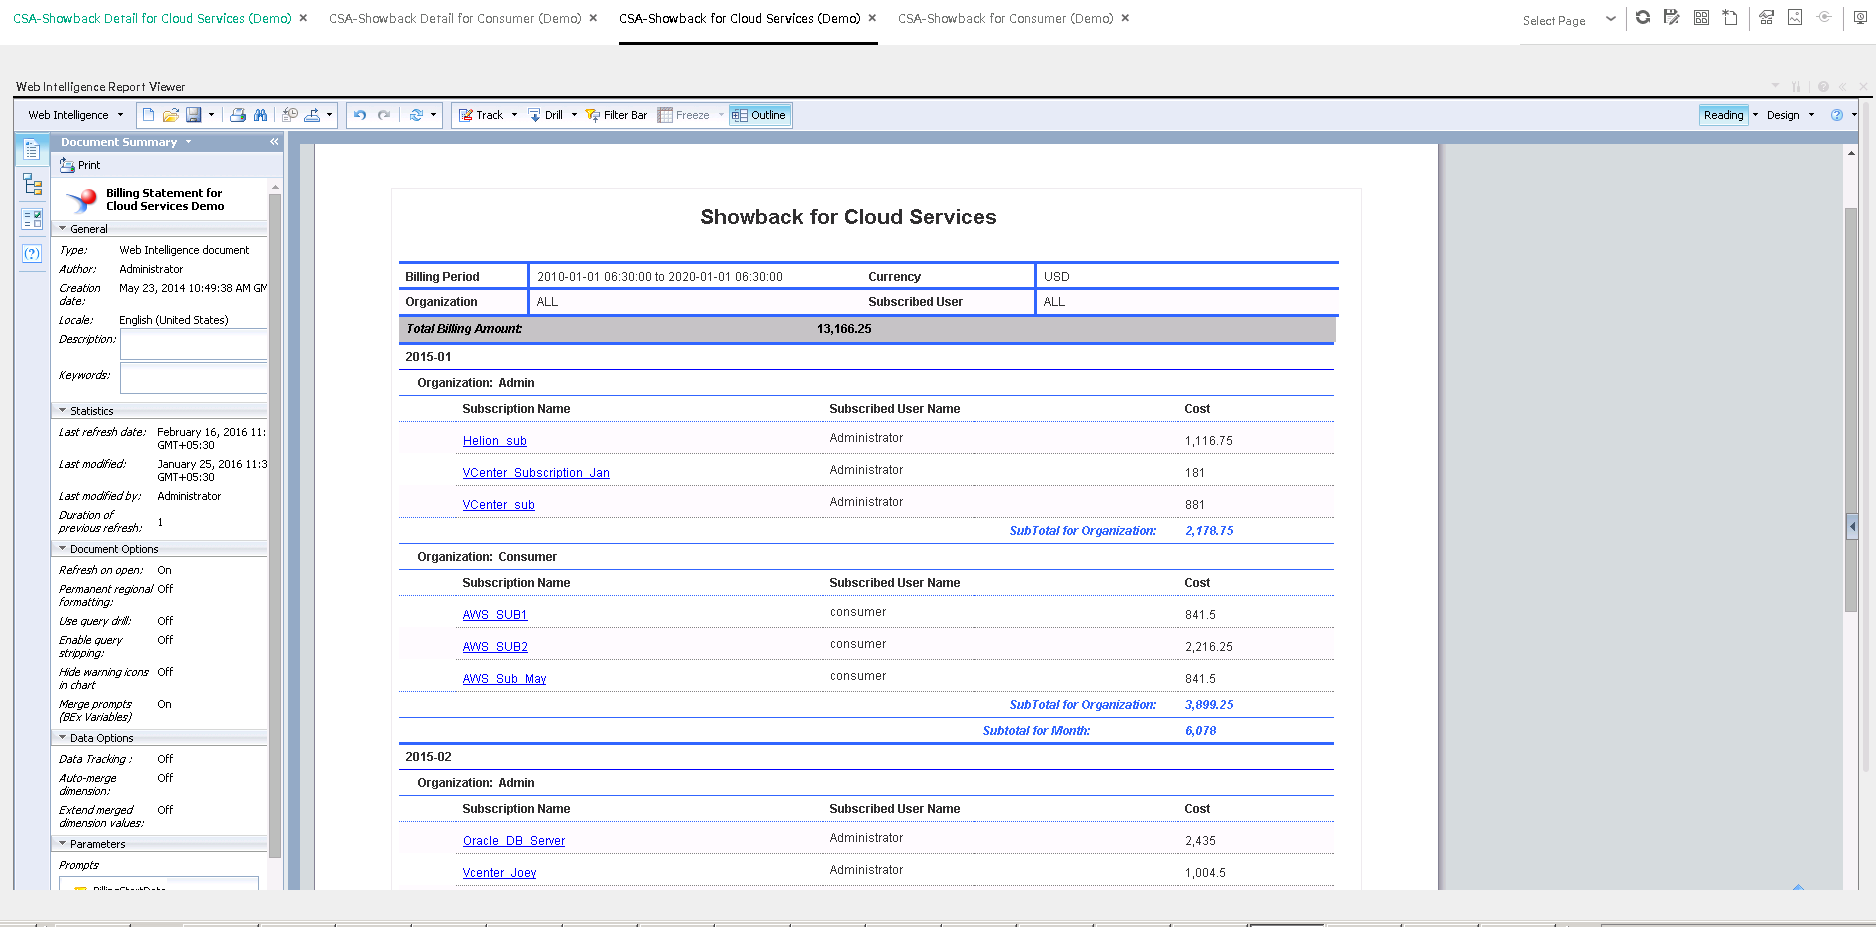
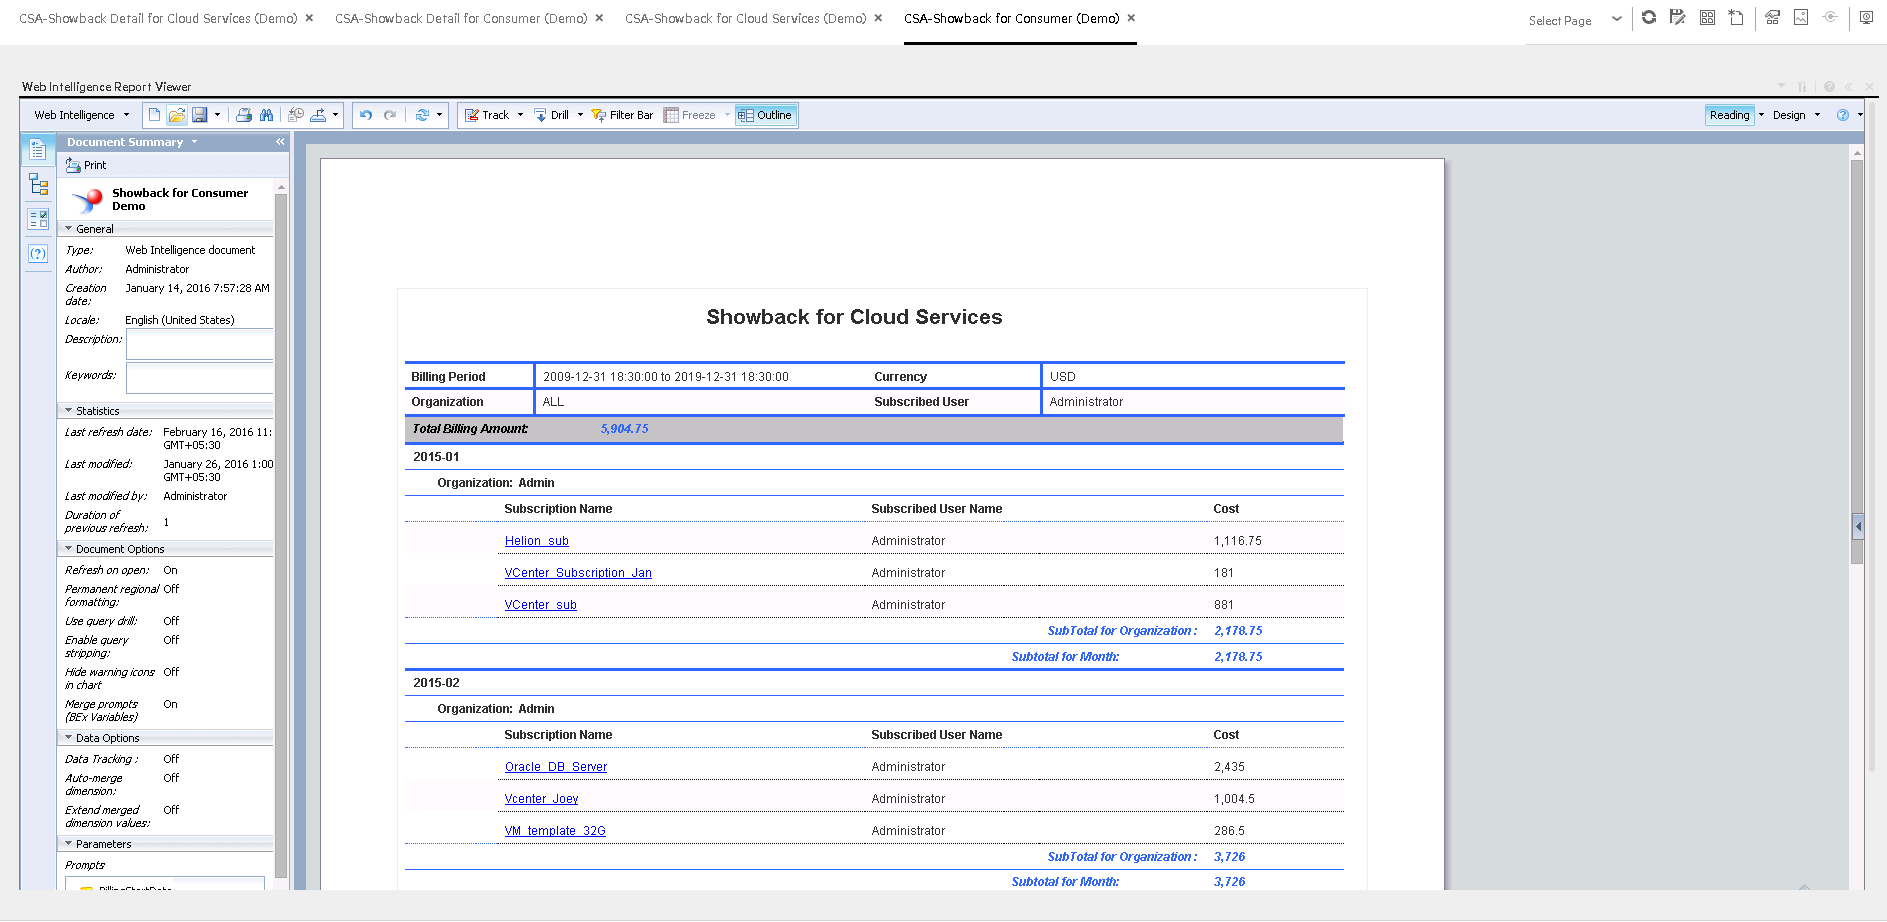
CSA-Showback for Cloud Services Page
The CSA-Showback for Cloud Services report displays the subscription cost incurred, during the time period specified when the end user opened the report, by the organizations for which the end user has permission. It also displays the Option Full Name, Property Name, Property Value, and Cost for each selected user subscription. The period granularity of this report is daily. You can search by specific date range, by user name, or by organization name.
The CSA-Showback for Cloud Services report displays the subscription cost incurred by each organization based on demo data.
In the CSA-Showback for Cloud Services report, the modification initial values are not calculated when the subscription is modified with different initial charges - only recurring charges are updated.
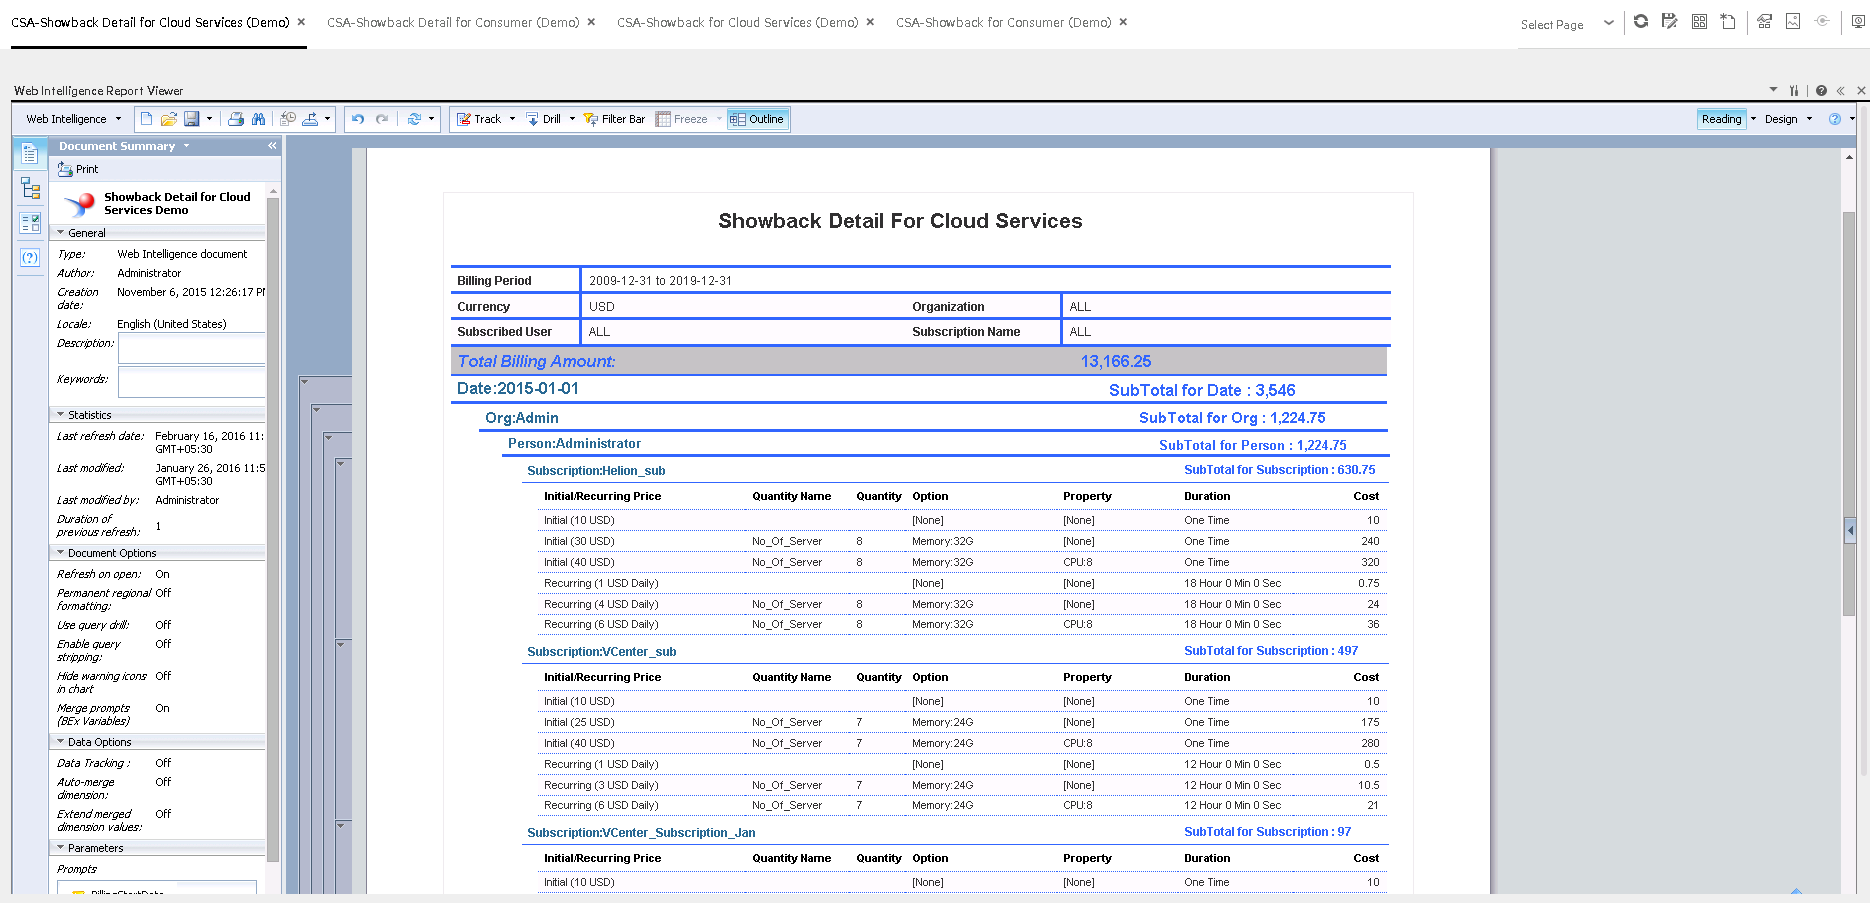
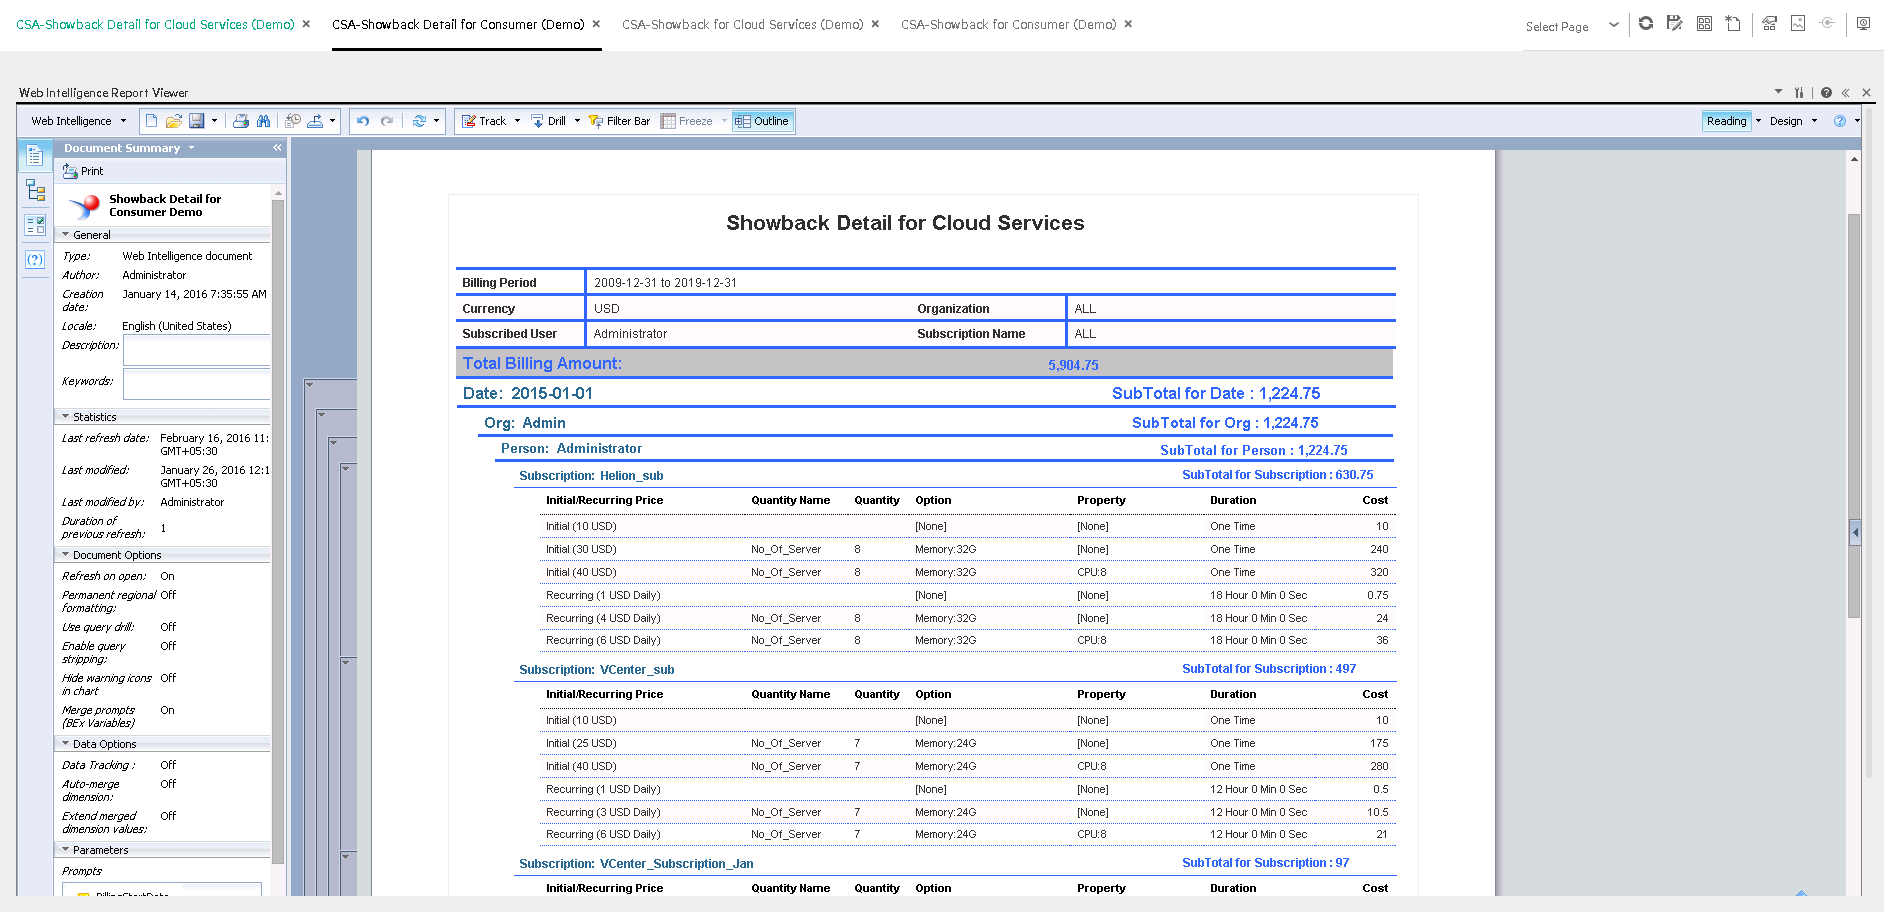
CSA-Showback Detail for Cloud Services Page
The report displays the option and property cost for each selected user subscription. The period granularity of this report is daily. The user can search by specific date range, by user name, by organization name, or by subscription name.
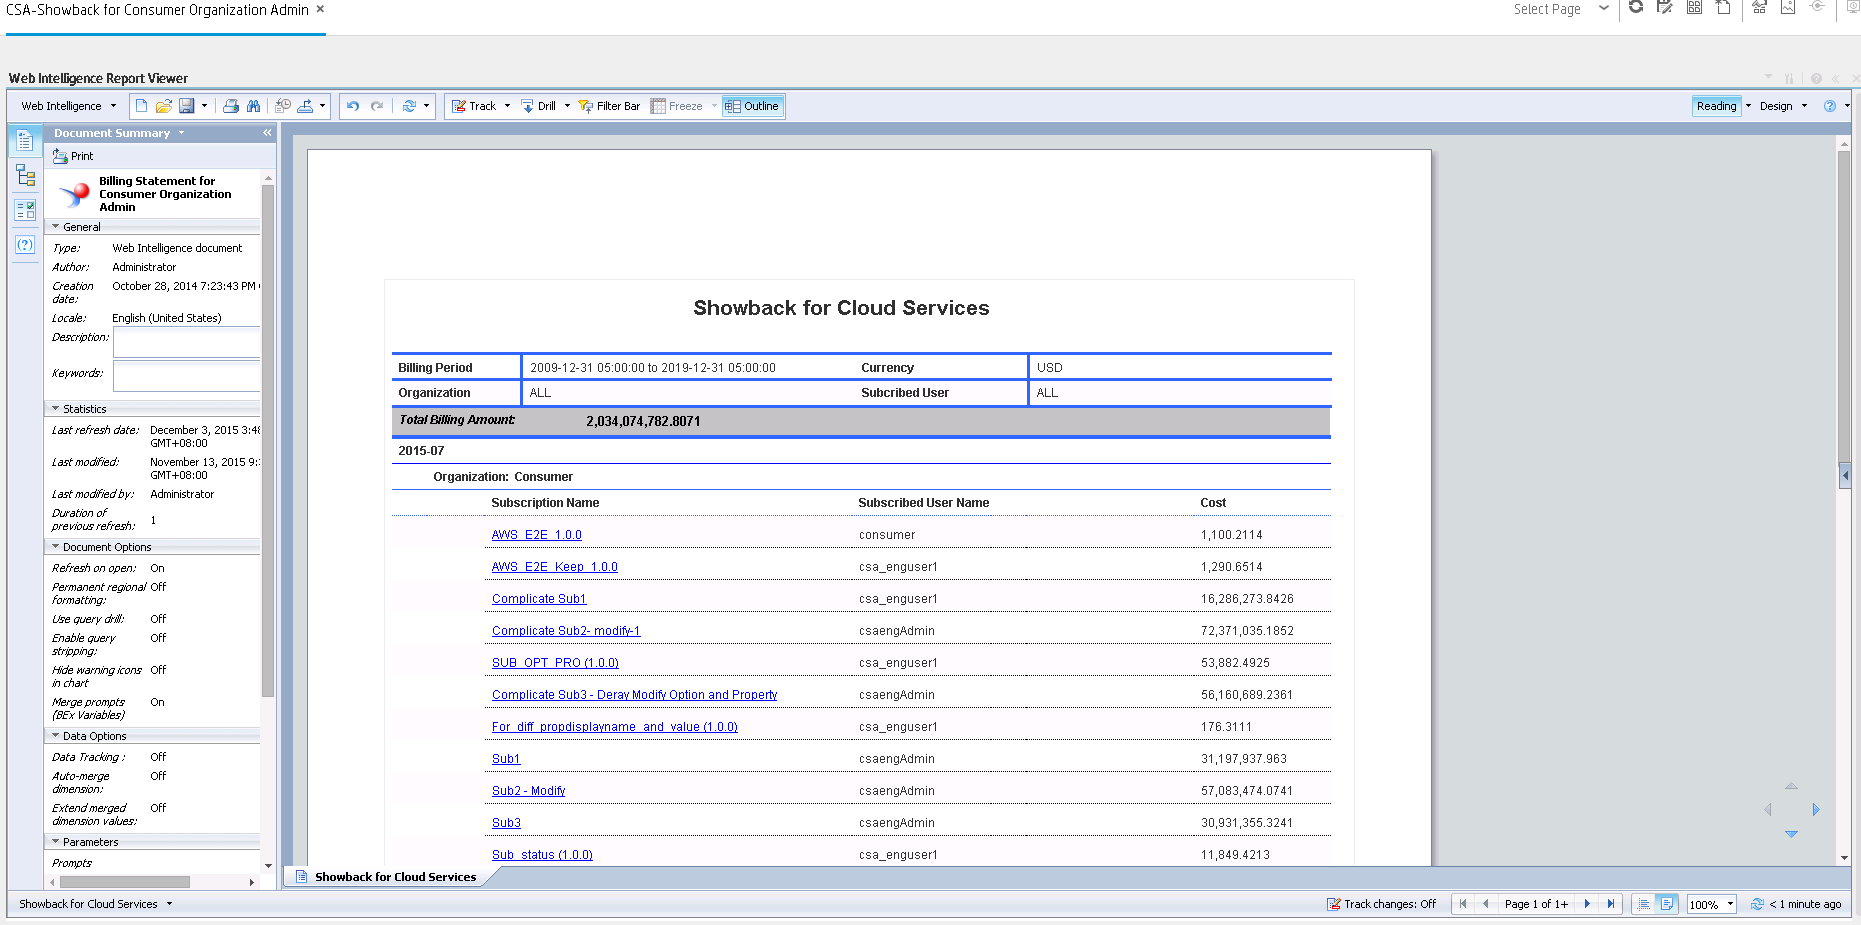
CSA-Showback for Consumer Organization Admin Page
The CSA-Showback for Consumer Organization Admin report displays the subscription cost incurred by each organization during the time period you specified when you opened the report for the Admin user.
CSA-Showback for Consumer Page
CSA-Showback Detail for Consumer Page
CSA-Cloud Service Automation Overview Page
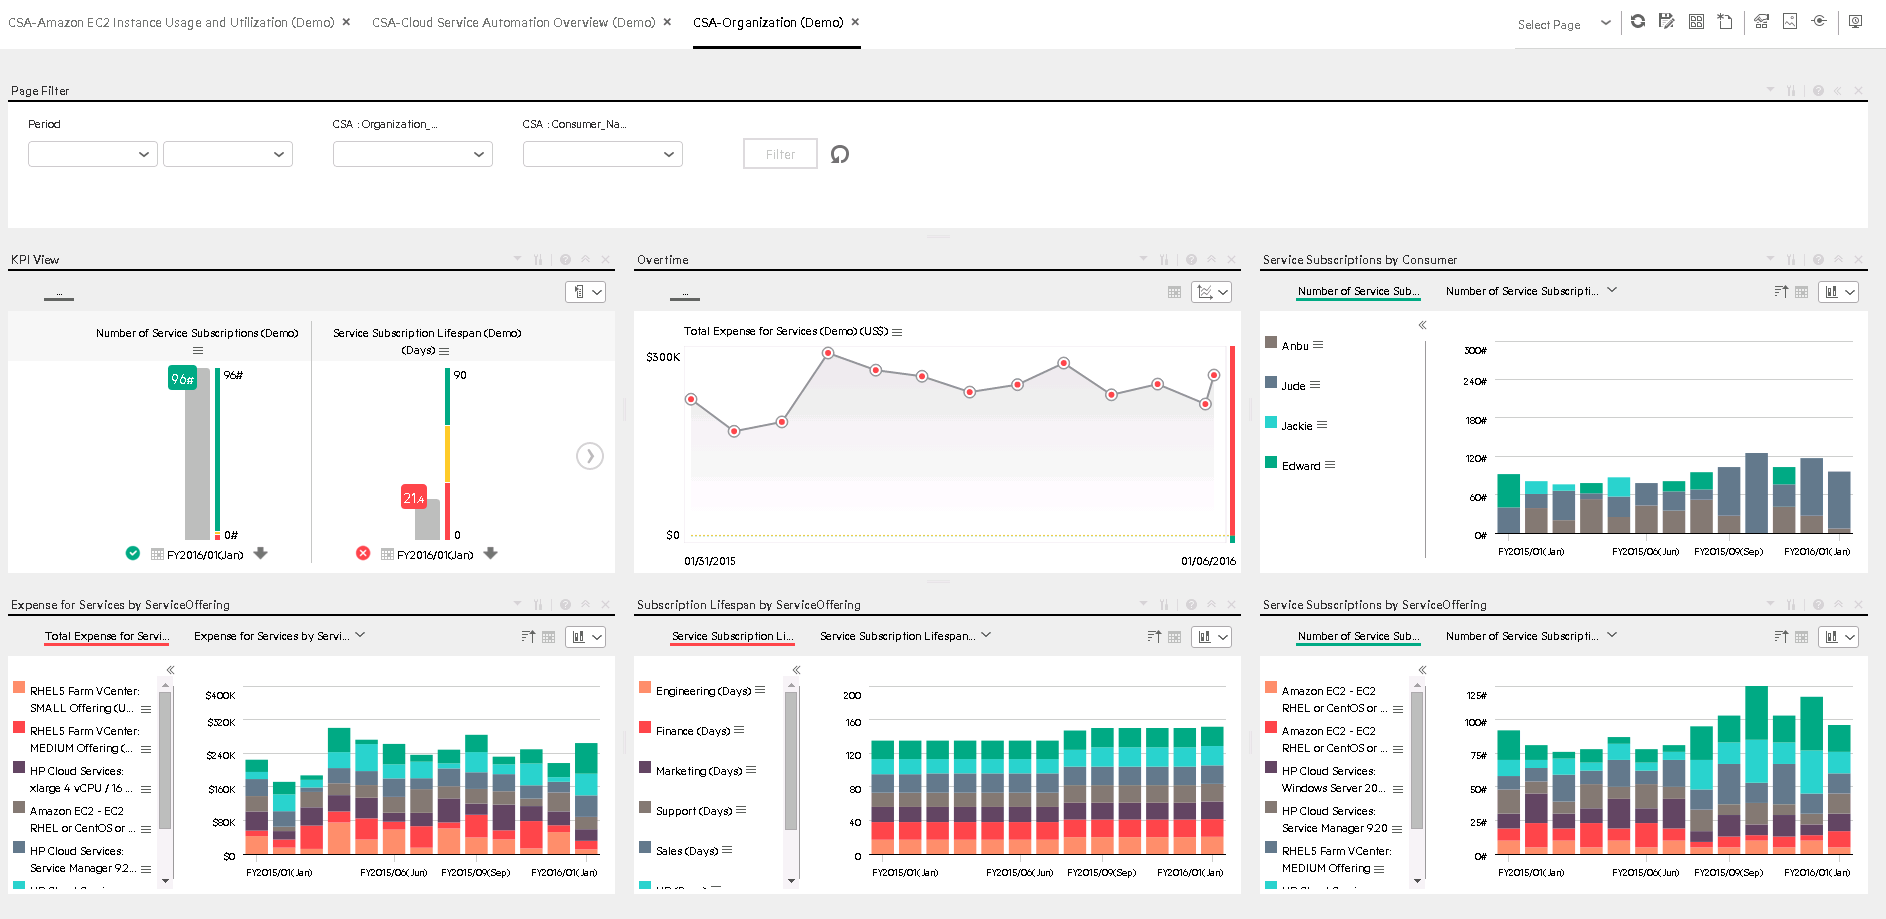
CSA-Organization Page
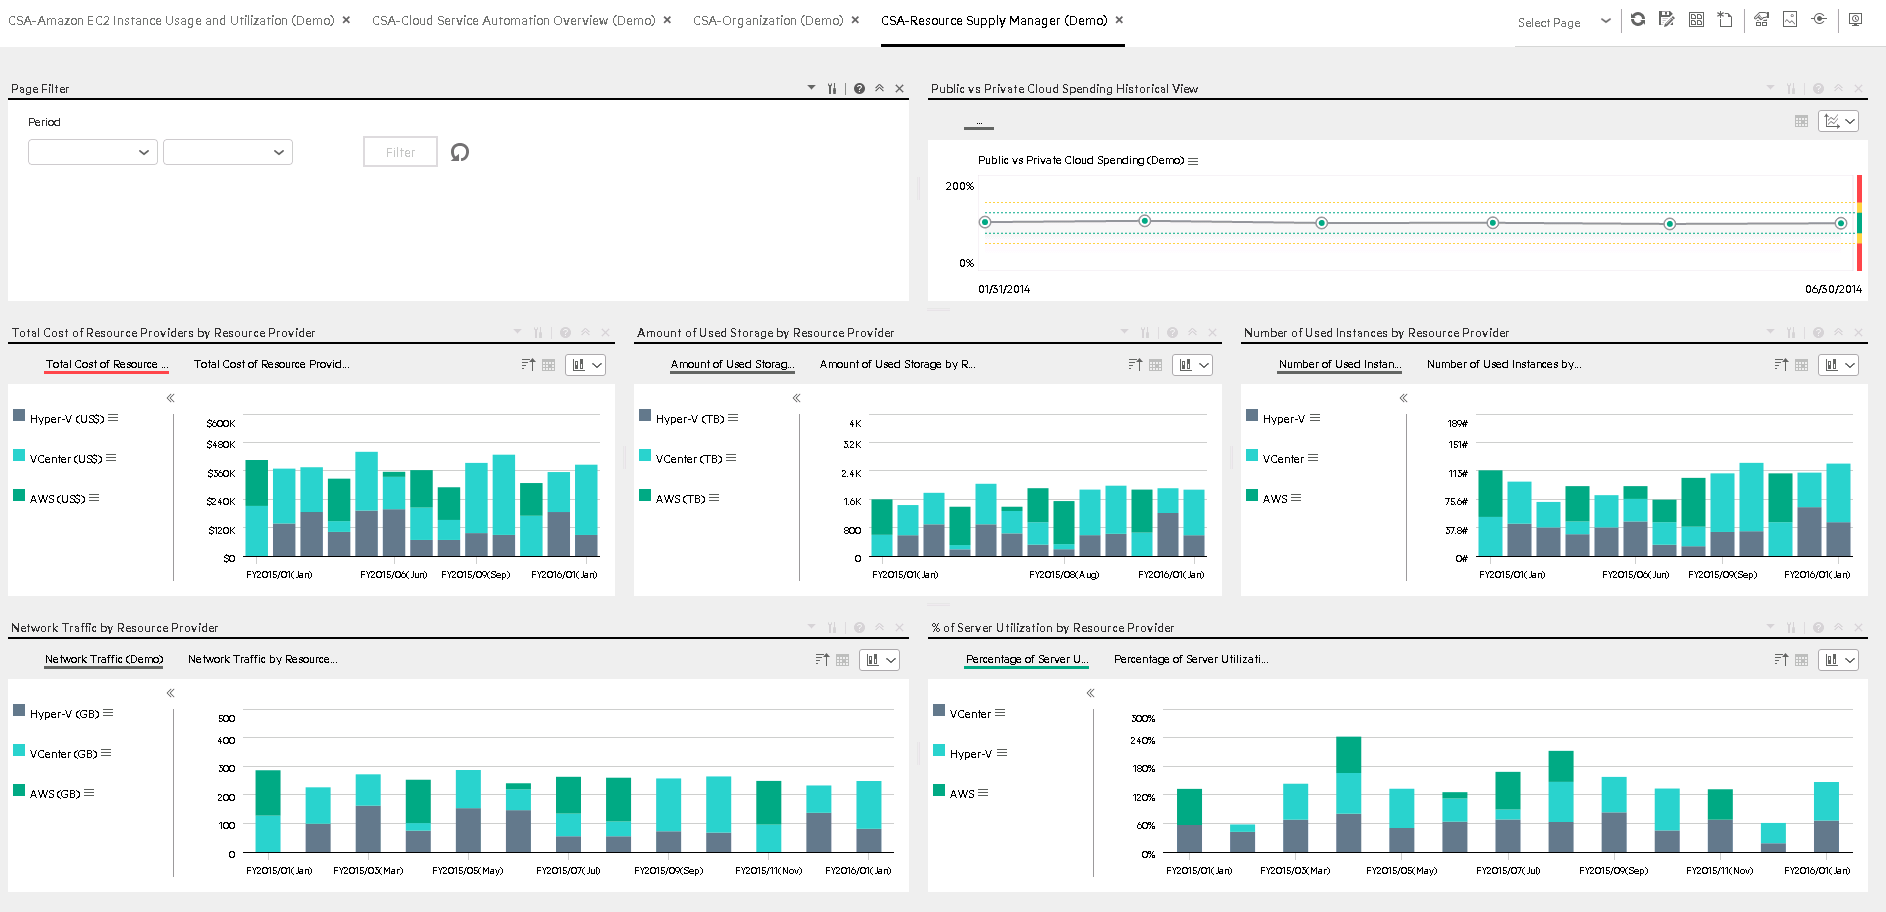
CSA-Resource Supply Manager Page
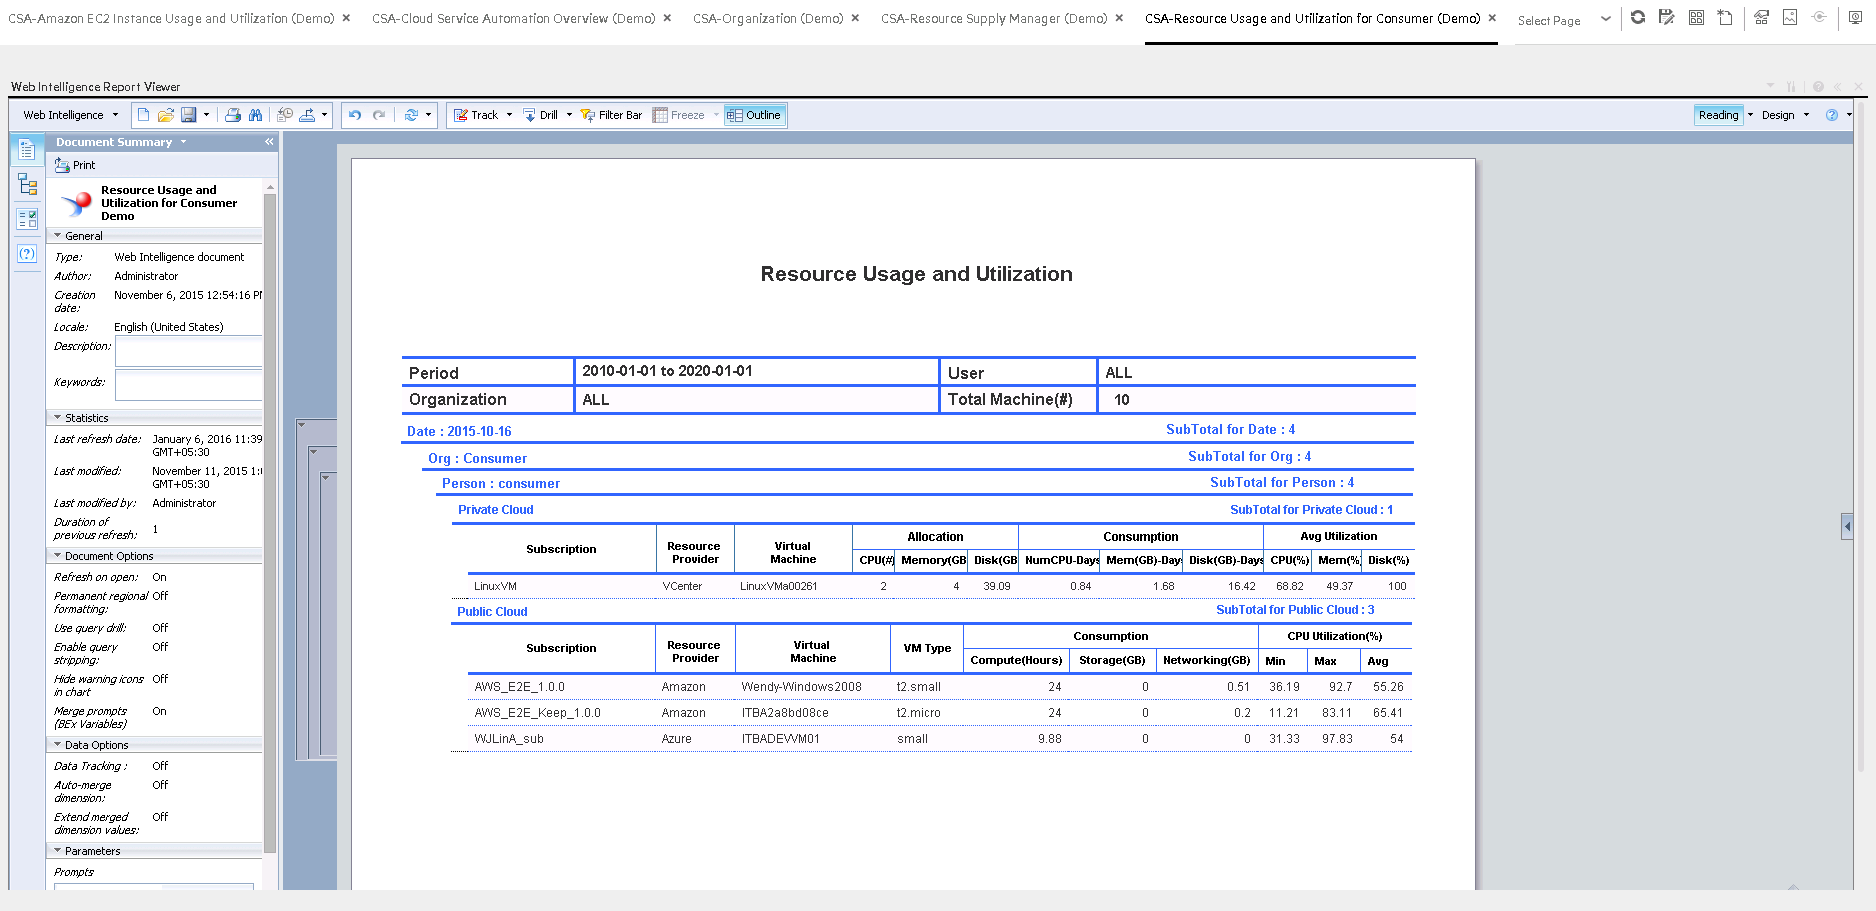
CSA-Resource Usage and Utilization for Consumer Page
The persona is the resource supply manager, who is responsible for the management of equipment, hardware, and other logistical details of a company or a company’s division.
Since the traditional IT is transforming to the new style of IT by moving IT assets to the cloud, His job is to manage each resource provider; deliver the infrastructure service to support the business application and service run in the company; make sure the overall cost of resource provider is under control.
In this report, the private cloud VM instance cost is based on the based rate inputed by user multiplied by real VM usage. Other usage and utilization are directly from VM.
The report only displays the VM that created by CSA subscription, if the VM has no linkage to CSA subscription, it should display on this report.
The report is at daily level. User will able to filter start time and end time, organization, resource provider.
Limitation: The report can only display USD as currency.
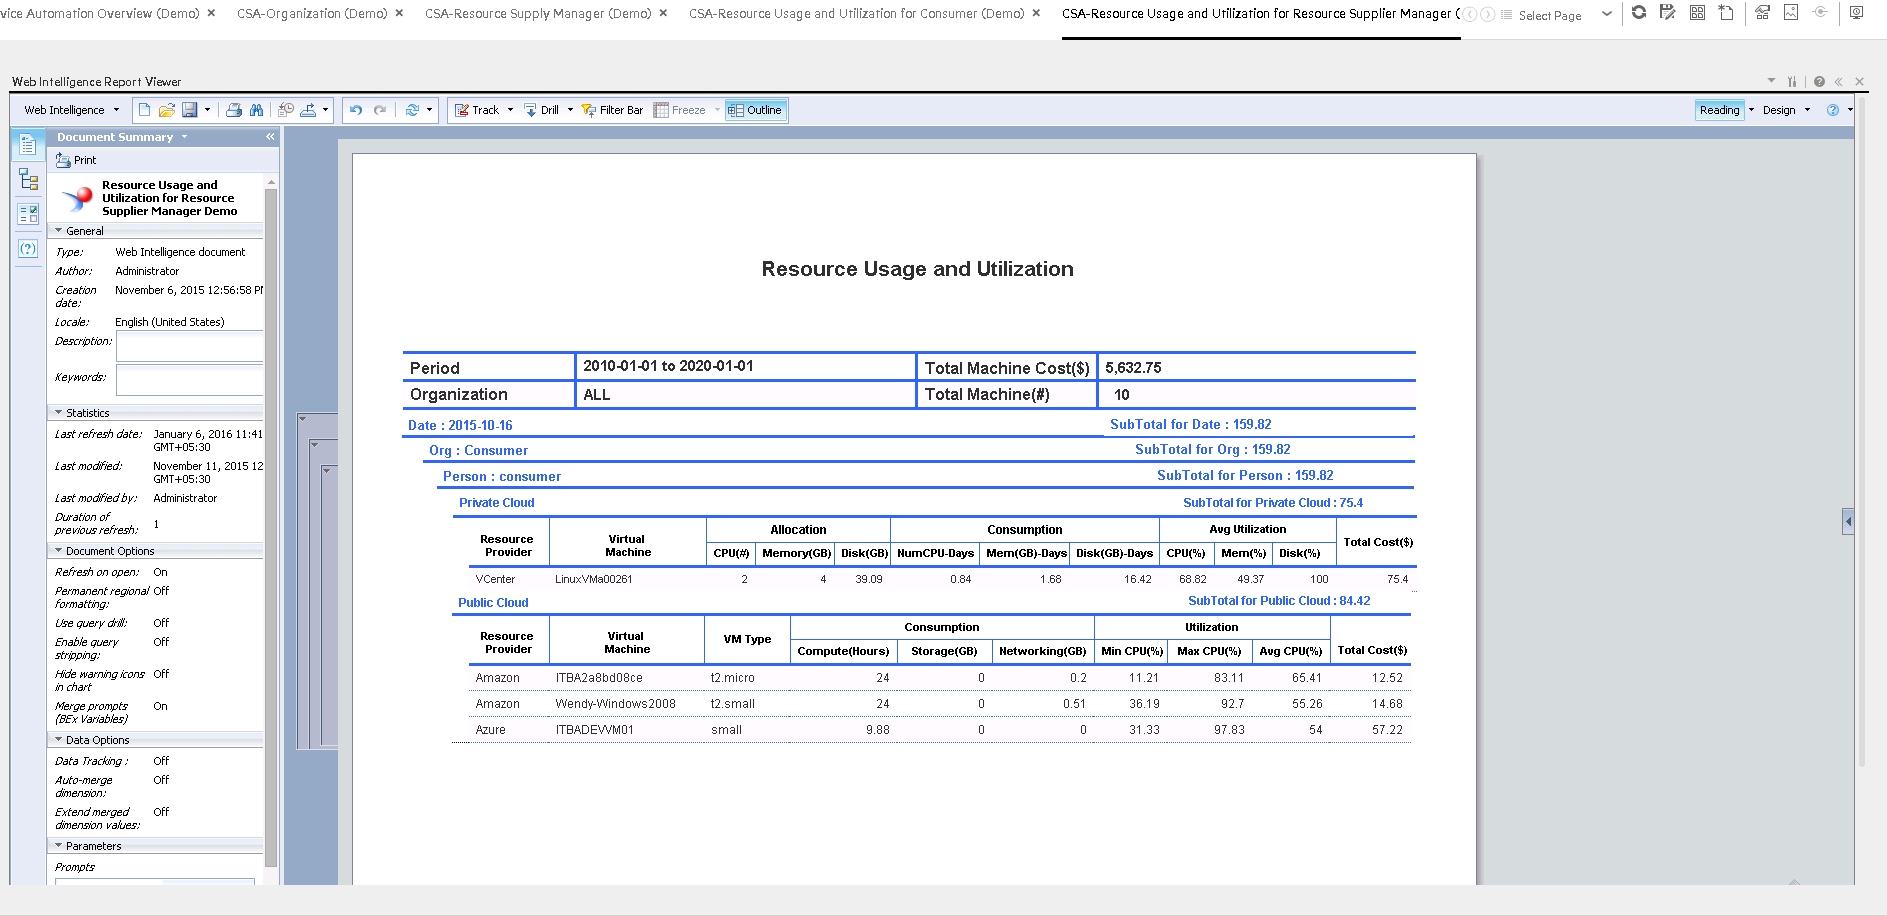
CSA-Resource Usage and Utilization for Resource Supplier Manager Page
Limitation: The report can only display USD as currency.
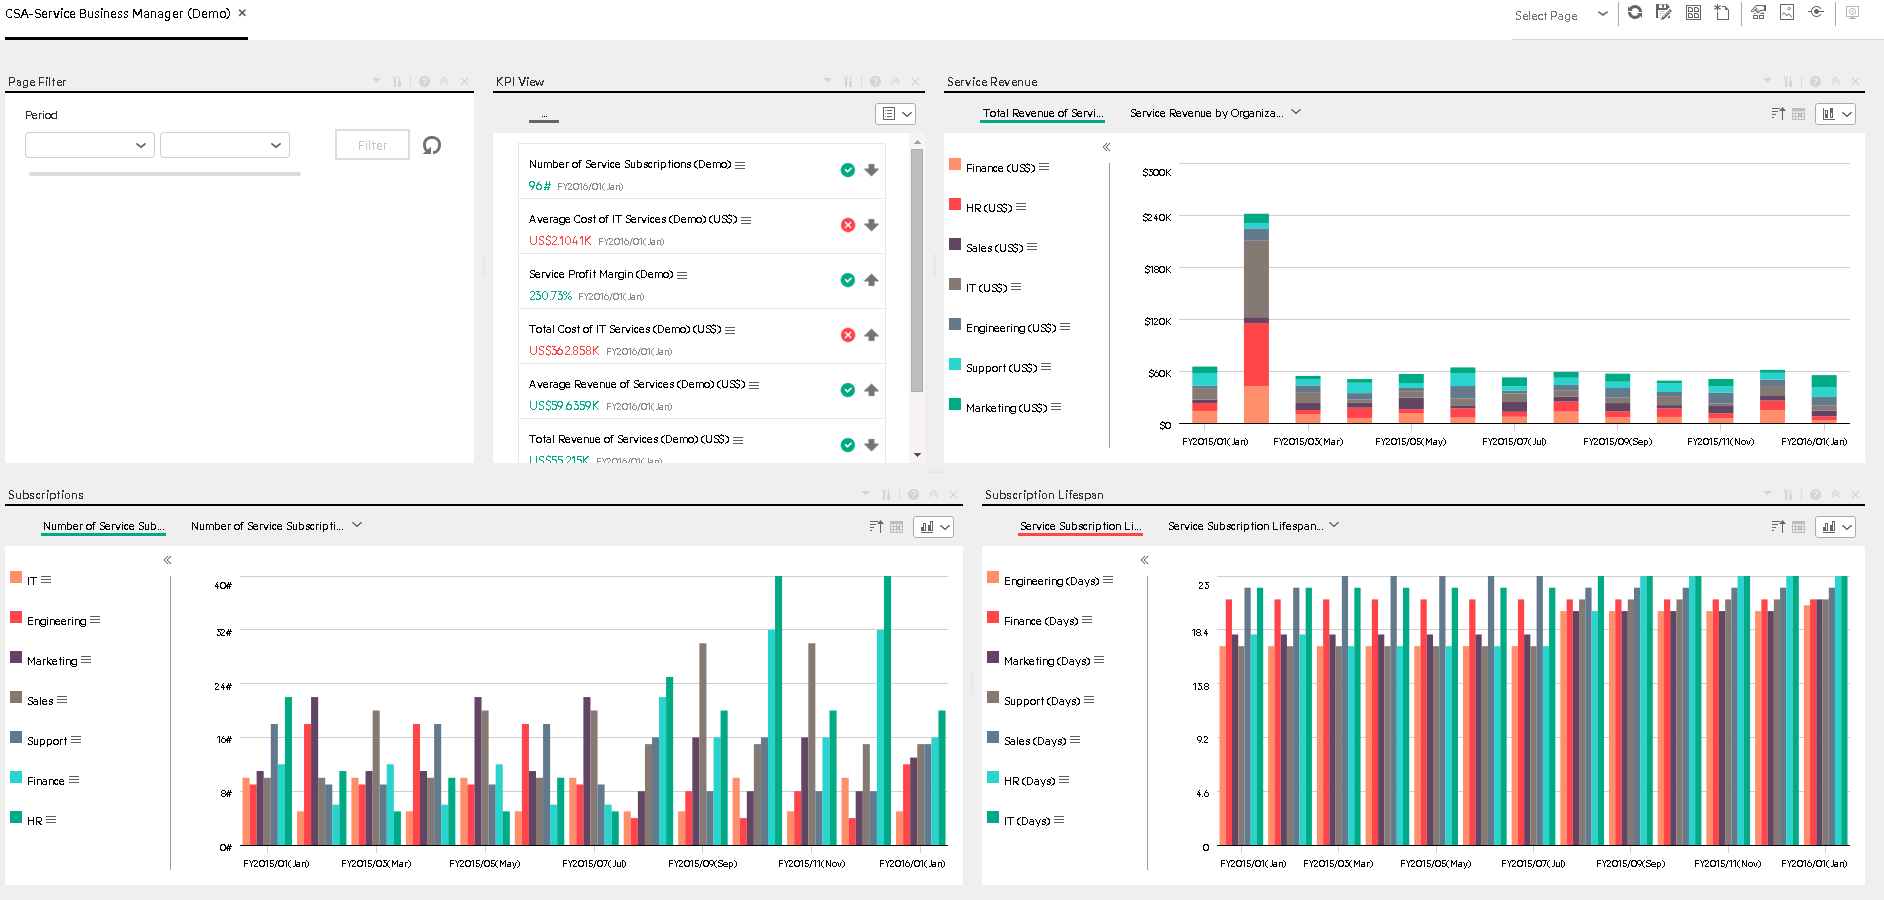
CSA-Service Business Manager Page
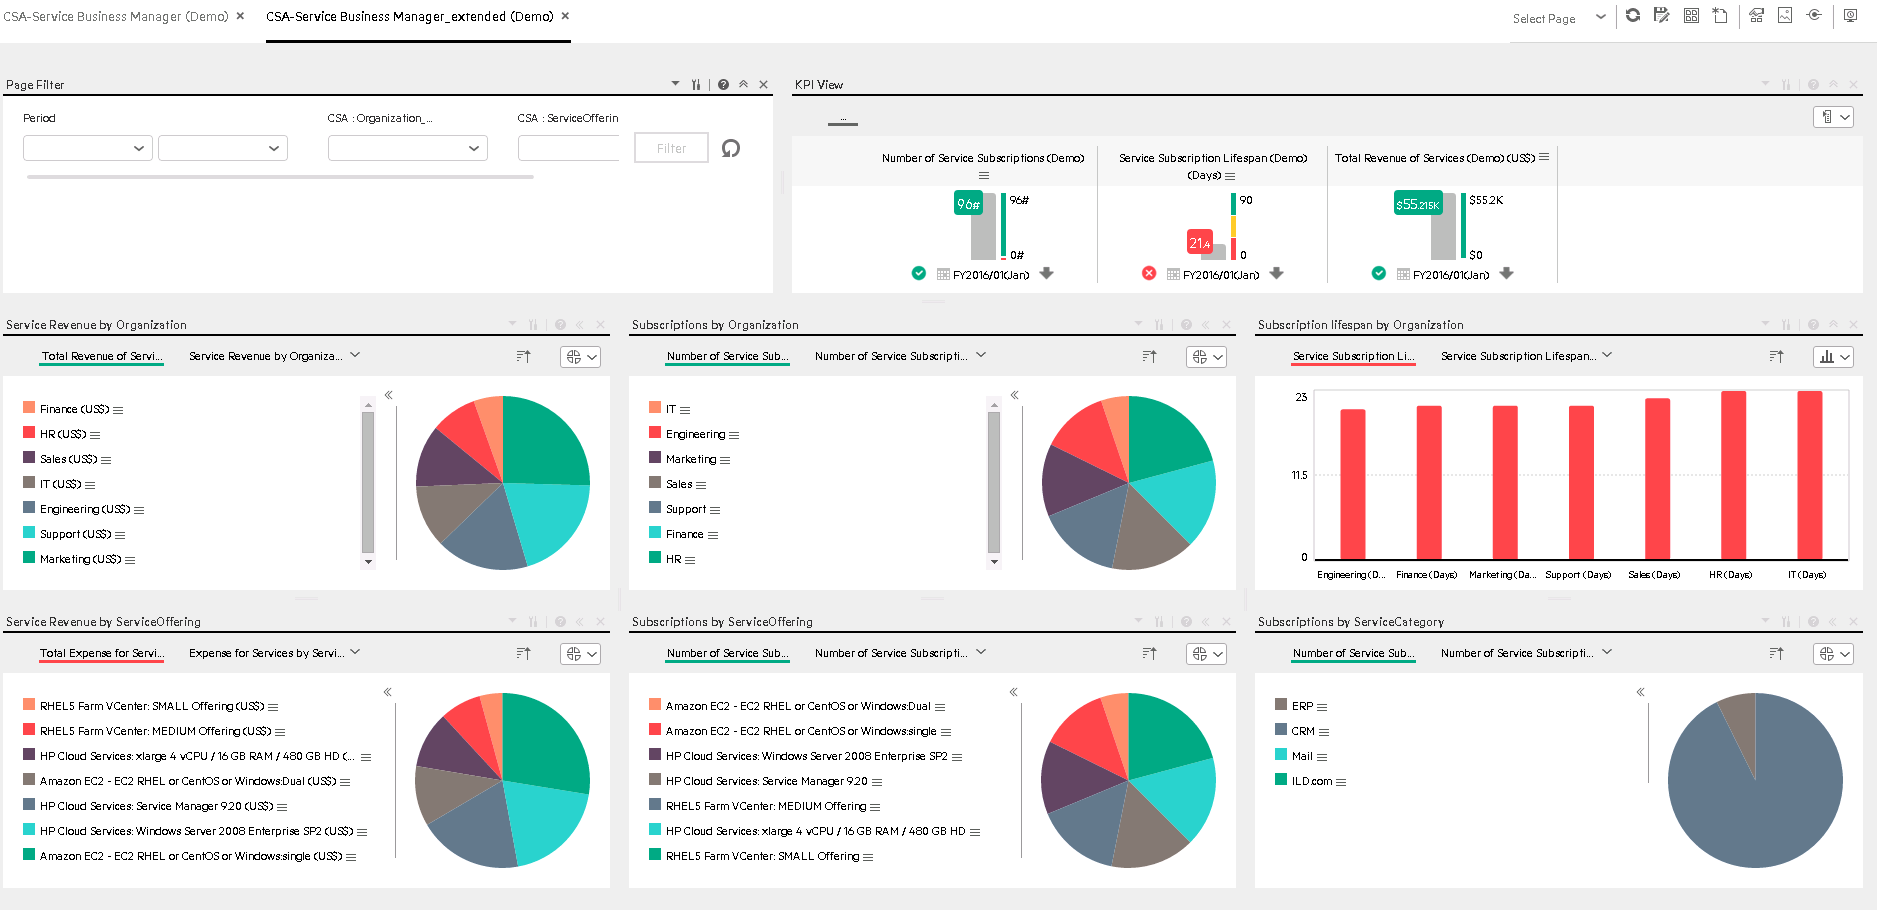
CSA-Service Business Manager_Extended Page
Note This page is only available on your mobile device.
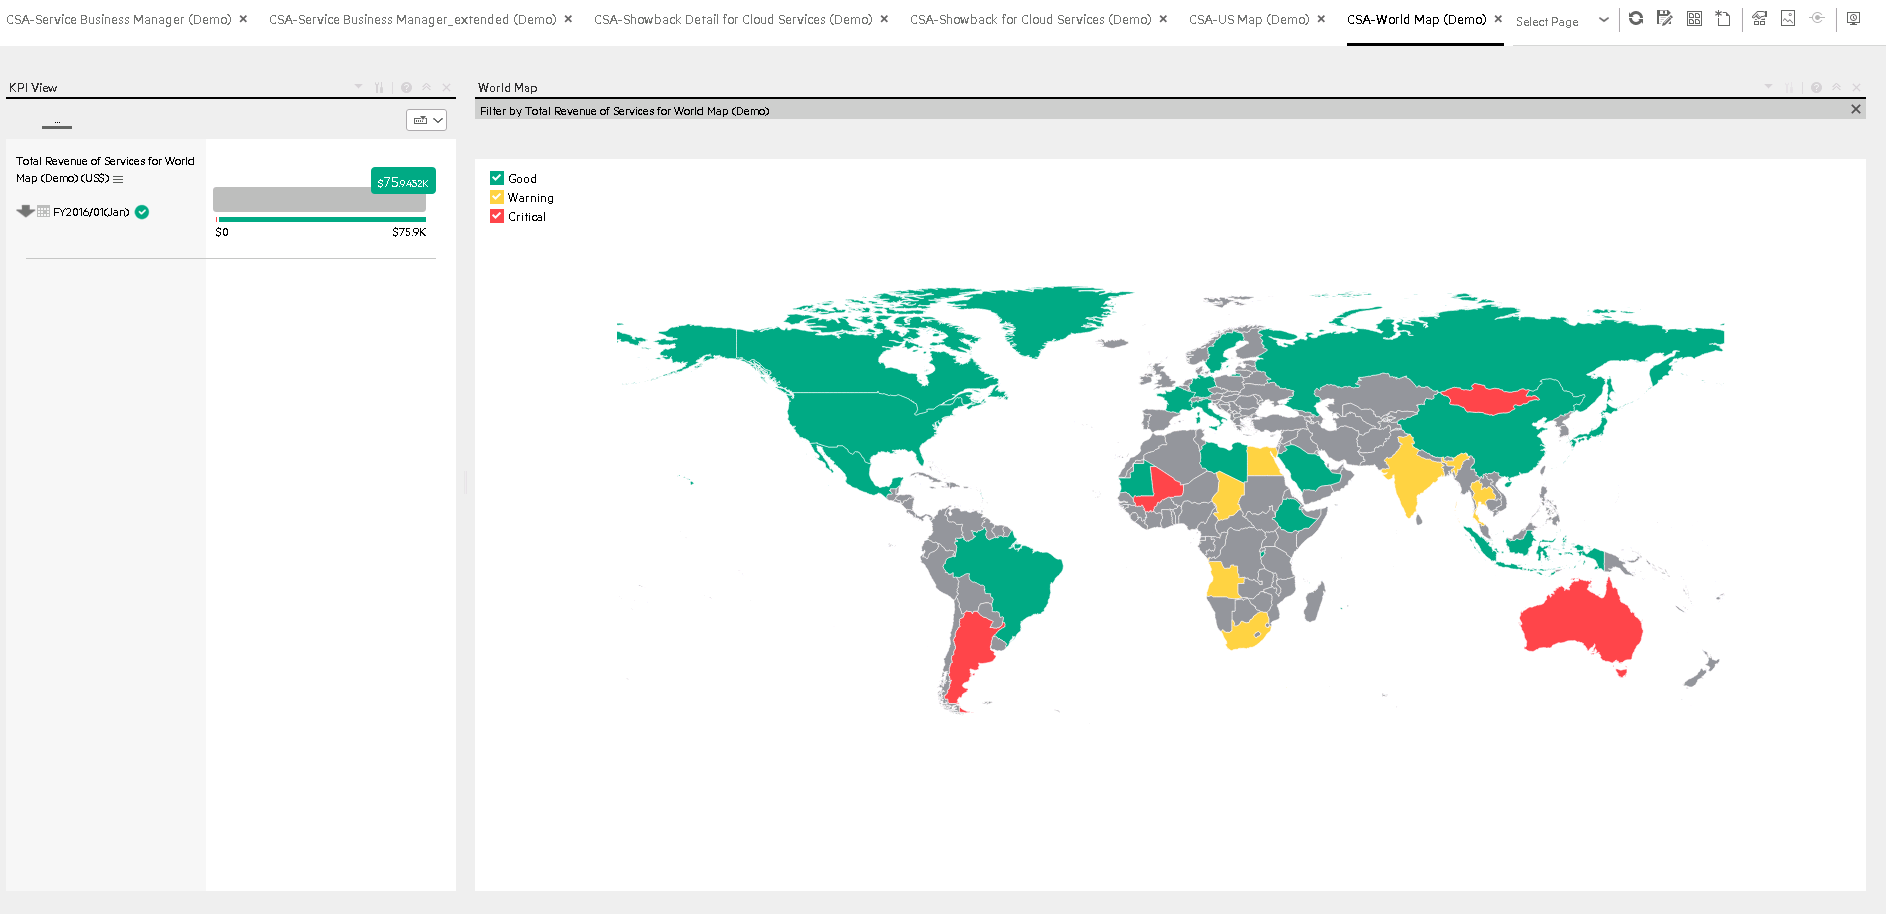
CSA-World Map Page
This page is only available with the CSA_Demo CAP. For details, see CSA_Demo and CSA Content Acceleration Packs .
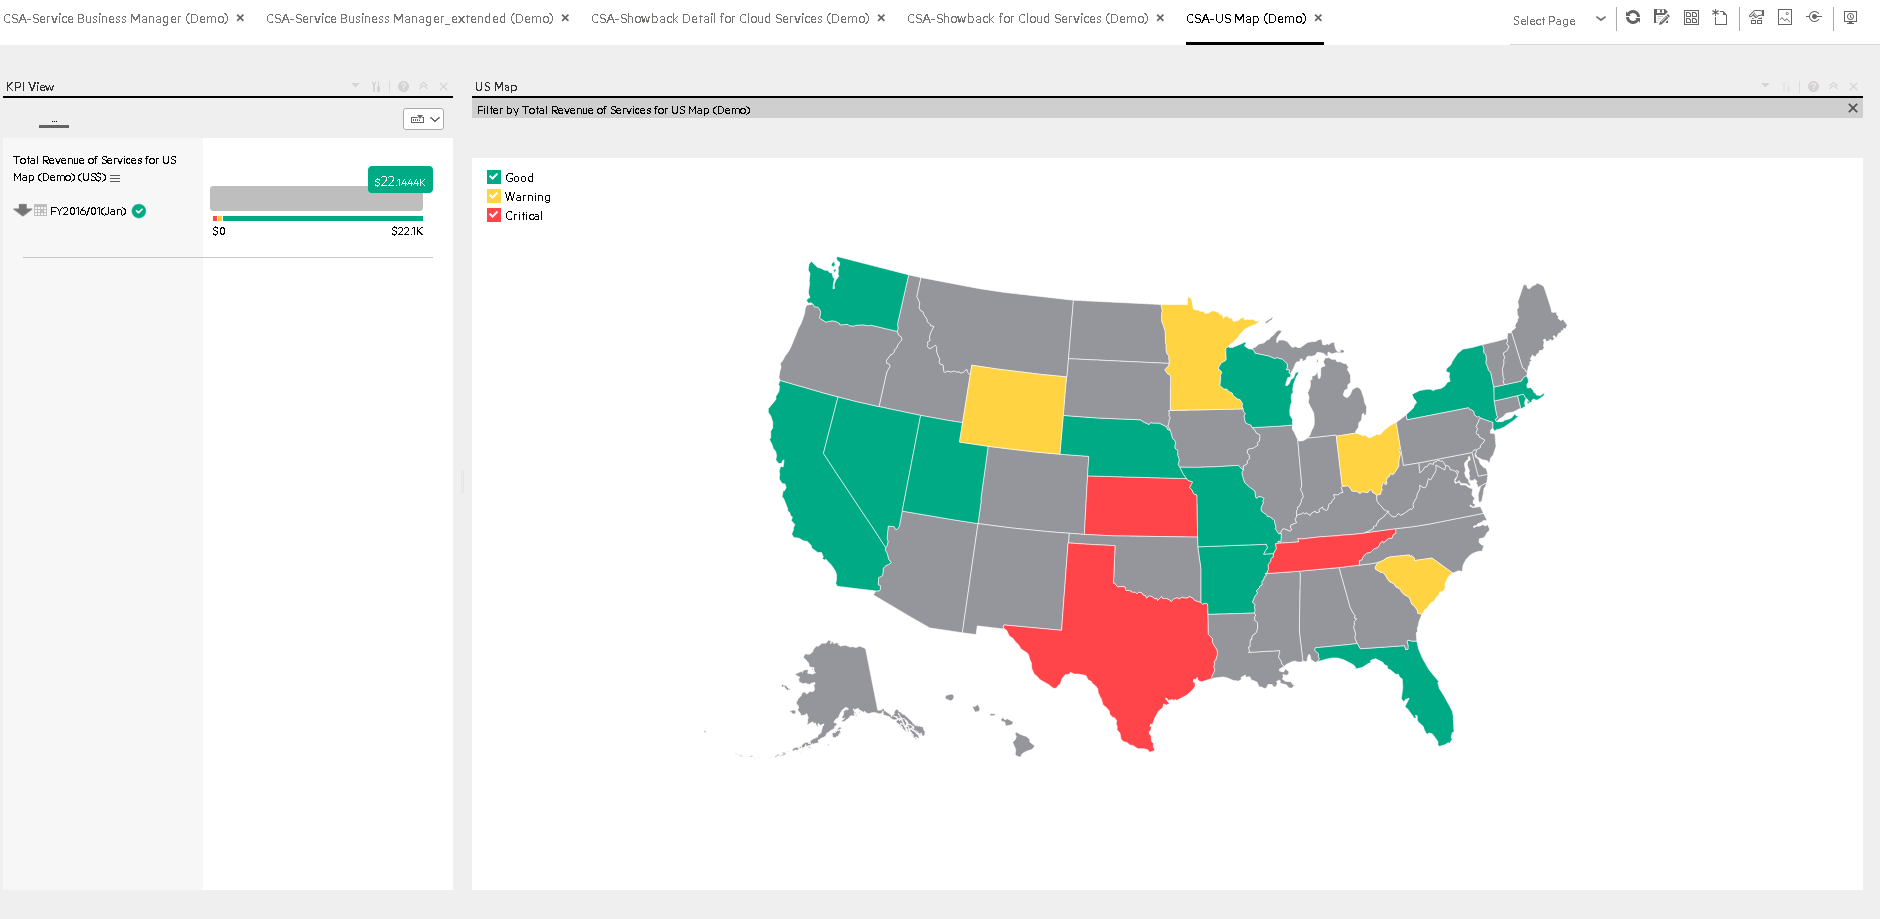
CSA-US Map Page
This page is only available with the CSA_Demo.
We welcome your comments!
To open the configured email client on this computer, open an email window.
Otherwise, copy the information below to a web mail client, and send this email to SW-Doc@hpe.com.
Help Topic ID:
Product:
Topic Title:
Feedback: