
Searching the Help
To search for information in the Help, type a word or phrase in the Search box. When you enter a group of words, OR is inferred. You can use Boolean operators to refine your search.
Results returned are case insensitive. However, results ranking takes case into account and assigns higher scores to case matches. Therefore, a search for "cats" followed by a search for "Cats" would return the same number of Help topics, but the order in which the topics are listed would be different.
| Search for | Example | Results |
|---|---|---|
| A single word | cat
|
Topics that contain the word "cat". You will also find its grammatical variations, such as "cats". |
|
A phrase. You can specify that the search results contain a specific phrase. |
"cat food" (quotation marks) |
Topics that contain the literal phrase "cat food" and all its grammatical variations. Without the quotation marks, the query is equivalent to specifying an OR operator, which finds topics with one of the individual words instead of the phrase. |
| Search for | Operator | Example |
|---|---|---|
|
Two or more words in the same topic |
|
|
| Either word in a topic |
|
|
| Topics that do not contain a specific word or phrase |
|
|
| Topics that contain one string and do not contain another | ^ (caret) |
cat ^ mouse
|
| A combination of search types | ( ) parentheses |
|


![]()
![]()

VP of Applications CAP
The purpose of the VP of Applications Content Acceleration Pack (CAP) is to provide a set of items (Dashboard pages, Scorecards, Contexts, KPIs, and more) that automatically gathers information from across your enterprise to build Key Performance Indicators (KPIs) related to VP of Applications-related issues. The CAP provides broad and deep insight that should enable you to reduce the cost of application development, justify the investments, provide explanations for project's delays, provide explanations for application failures in production, analyze why applications are not meeting business requirements, find the vendors with the best performance, balance available resources with business demands, be provided with the ability to quickly respond to the needs of the business, and to deliver secure applications
If the applications are not aligned with the business, there is no innovation, users go to competitors, and business revenues decline.
The use case for this Content Acceleration Pack is to provide a 360 Degree Application View.
The data sources for the VP of Apps CAP are Application Lifecycle Management (ALM), Project and Portfolio Management (PPM), and Service Manager (SM).
The relevant content packs are ALM, PPM, and SM. For details, see Integration with ALM, Integration with PPM, andIntegration with SM.
 VPAps_Demo
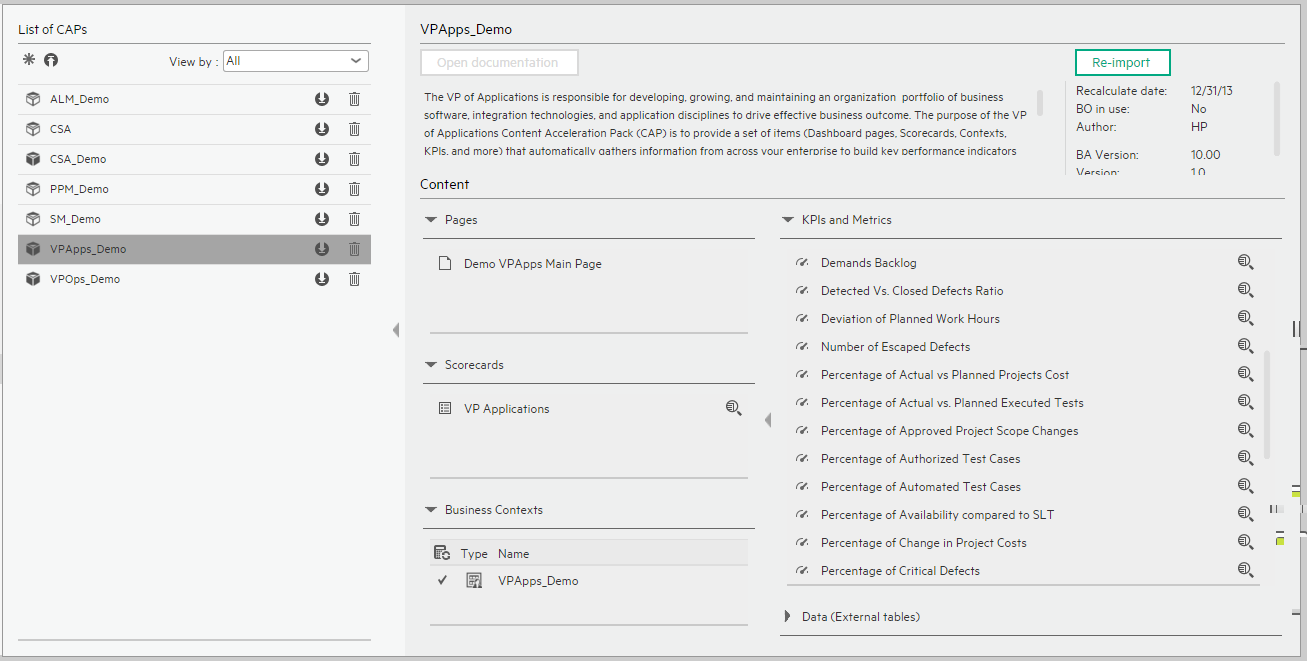
User interface elements are described below (when relevant, unlabeled elements are shown in angle brackets):
|
UI Element |
Description |
|---|---|
| Pages | |
| Scorecards |
VP Applications |
| Business Contexts |
VPApps_Demo For details, see Semantic Layer - Contexts and Universes. |
| KPIs and Metrics |
Note The Demo CAP includes KPIs with names followed by (Demo). The CAP includes the same KPIs with names that do not include (Demo). The KPIs are the same but have different names so that both the Demo CAP and the CAP can be activated at the same time.
|
| Data (External Tables) |
VPApps_Demo |
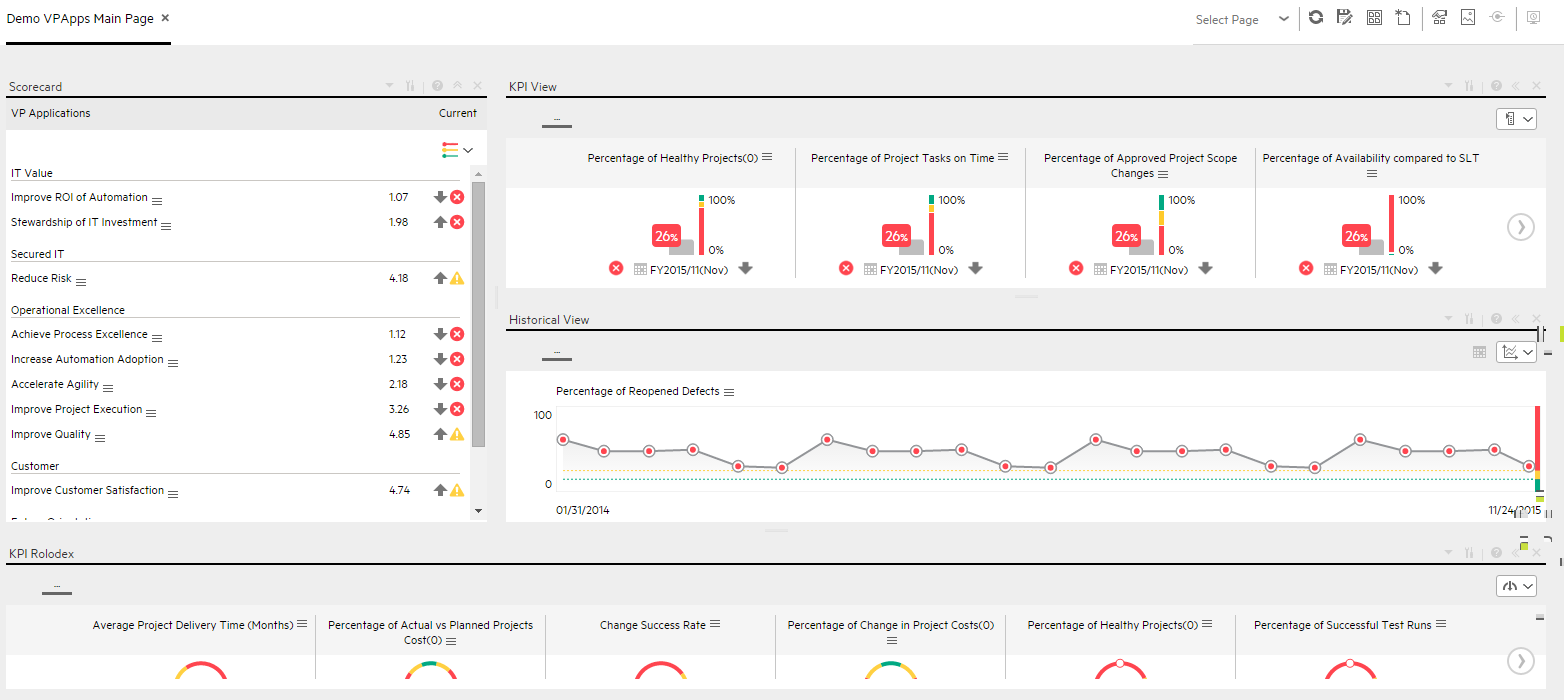
Demo VPApps Main Page
We welcome your comments!
To open the configured email client on this computer, open an email window.
Otherwise, copy the information below to a web mail client, and send this email to SW-Doc@hpe.com.
Help Topic ID:
Product:
Topic Title:
Feedback: